
Abstract
The authors address the gap in what is known about voting among Asian American ethnic subgroups using National Asian American Survey 2016 Post-Election Survey data to investigate the propensity to vote in the 2016 presidential election across two samples: registered Asian Americans and registered naturalized Asian Americans. The authors use logistic regressions to examine voting behavior across 10 Asian ethnic subgroups for the first time. Across both samples of Asian Americans and naturalized Asian Americans, Chinese Americans demonstrate a lower propensity to vote than most other Asian ethnic subgroups, while Asian Indian and Bangladeshi Americans demonstrate a higher propensity to vote. Among all Asian Americans, being female, being older, and having more education all pattern higher rates of reported voting in the 2016 presidential election, while for naturalized Asians, time in the United States and higher levels of education are associated with a higher likelihood of voting in the 2016 presidential election.
Although recent elections have been decided by razor-thin margins, very little scholarly attention has been paid to the voting habits of Asian Americans. In the 2020 election, Asian Americans were increasingly portrayed as a potential voting bloc within the larger electorate by popular media outlets. The possible effect of mobilizing Asian Americans to vote gained momentum with the candidacy of Vice President Kamala Harris as a second-generation Asian Indian and former President Donald Trump’s referencing the coronavirus disease 2019 pandemic as “the China virus” and the “kung flu.” Asian Americans represent the fastest-growing electorate compared with all other major races and ethnicities, and their population more than doubled between 2000 and 2020 (Budiman 2020). With 22.4 million Asian Americans, or 6.4 percent of the total U.S. population (U.S. Census Bureau 2019), Lee and Ramakrishnan (2019) made the case that Asian Americans represent the “new face of immigration” in the United States.
At the same time, Asian Americans are the most heterogeneous ethnically and culturally, compared with the other major racial-ethnic groups of whites, blacks, and Hispanics in the U.S. population (Lee and Ramakrishnan 2019). This Asian American ethnic diversity is largely patterned by national origins and homeland ethnic identity, which, in turn, pattern variation in levels of income (De La Cruz-Viesca et al. 2016) and other factors associated with social integration. Still, we know little about how Asian American ethnic subgroups may affect electoral participation.
A majority of Asian Americans are foreign born, which stands in contrast to other major U.S. racial and ethnic groups. Among Asian American eligible voters, 67 percent are naturalized citizens (Budiman 2020), and 90 percent are either first- or second-generation American (Lee and Ramakrishnan 2019). These demographic differences set Asian Americans apart within the electorate as a group of interest. These distinguishing characteristics also suggest that nativity status should be examined for Asian Americans as a whole and that naturalized Asian Americans should be analyzed separately.
There is a need to examine the voting behavior of Asian Americans, the fastest growing and most ethnically diverse of all U.S. racial-ethnic groups, with the highest concentration of naturalized citizens. Moreover, there is much to be understood about the voting behavior of the ethnic subgroups that constitute the category of Asian American. To date, there is little and inconclusive scholarship about Asian American ethnic subgroups, because of the lack of available data with sufficient samples of these ethnic subgroups and because the composition of the Asian American group is continually changing as immigrants continue to arrive. However, the data landscape is changing as the number of Asian Americans increases and as new survey instruments, such as the National Asian American Survey (NAAS 2020) become available. The NAAS was fielded in 2008 and again in 2016, with a focus each time on gathering information on Asian Americans’ political attitudes, beliefs, and behaviors (see Wong et al. 2011).
In this article we examine Asian American voting behavior first across ethnic subgroups within a nationally representative sample of registered Asian Americans and, second, to ascertain if any ethnic subgroup patterns exist within a sample of registered naturalized Asian Americans, testing for the same relationships and including time in the United States as a focal variable of interest. We use NAAS 2016 Post-Election Survey data to examine the propensity to vote in the 2016 presidential election. To date, we have found no published study in which the voting behavior of Asian American ethnic subgroups in the 2016 presidential election was examined. Therefore, we examine Asian American voting behavior in the 2016 presidential election for the first time. Also, the NAAS 2016 data allow us to test for differences across 10 Asian American ethnic subgroups for the first time. Prior studies (see Bass and Casper 2001b; Diaz 2012; Lien 2004) have compared across fewer ethnic subgroups. This proposed research improves upon prior research by testing for relationships across 10 focal Asian ethnic groups, a greater number than found in prior studies, and also includes those who identify as Bangladeshi and Pakistani American voters for the first time.
What May Shape the Voting Behavior of Asian Americans?
Voting among Asian Americans
Prior research has established that overall, Asian Americans are less likely to vote than other major racial-ethnic groups in the United States (Bass and Casper 2001a). However, Xu (2005:683) found that the disparity in voter turnout between whites and Asians “would virtually disappear” considering eligible voters (i.e., registered citizens), among whom Asians vote at comparable rates as whites. In agreement, our cursory examination of published Current Population Survey (CPS) Voting Supplement data tables (U.S. Census Bureau 2017) indicates that among those who were eligible (i.e., registered), 87.2 percent of Asians (alone) and 87.8 percent of whites (alone) reported voting in the 2016 presidential election. Qualifying this by generational status, Logan, Darrah, and Oh (2012) found that the lower likelihood of Asian Americans’ voting compared with whites is not different when comparing between third-generation Asian Americans and third-generation whites. Together, these studies (Logan et al. 2012; Xu 2005) point to naturalization and registration as structural barriers to voting that must be overcome for naturalized Asian Americans, and further, Logan et al.’s findings highlight that generation in the United States is salient for shaping voting behavior among Asian Americans, because over generations, social integration takes place.
Similarly to citizens in general and among naturalized citizens, some research indicates that Asian Americans who are more established in society—such as older individuals, those with more schooling, and those with higher incomes—are more likely to vote (e.g., with CPS data, see Bass and Casper 2001b; with NAAS data, see Yoon 2015). However, other studies (Junn 1999; Lien 2004; Wong et al. 2011; Xu 2005) suggest that socioeconomic factors may not predict electoral participation among Asian Americans overall, or for national origin groups, to the same degree as for the U.S. population in general. For example, Masuoka, Ramanathan, and Junn (2019) reported that higher socioeconomic status is not associated with a higher likelihood of electoral participation once the requirement of registration is satisfied, using a registered citizen sample from the Collaborative Multiracial Post-Election Survey data. These somewhat mixed findings highlight the continued need to include socioeconomic factors when modeling what predicts electoral participation for Asian Americans.
Being of Asian American origin matters for both social integration and political behavior. The term Asian American originated in the late 1960s when college activists adopted the Asian American panethnic identity to contest discriminatory treatment as minority group members and to push for reform and equality (Hune 2002; Wei 1993). Scholars (Espiritu 1992; Masuoka and Junn 2013; Okamoto 2003, 2006) contend that panethnic Asian American concept is salient to understand political participation because (1) the dominant culture treats Asian Americans in U.S. society by a hierarchical ordering, and (2) there is a sense of linked fate with others of the same racial group. Supporting this, empirical research (Wong, Lien, and Conway 2005) shows a bivariate positive relationship between having an Asian American group consciousness and electoral participation, specifically registering and voting, using the Pilot National Asian American Political Survey (PNAAPS). Similarly, Liu (2011) found that social capital, as operationalized by the frequency of religious service attendance, is positively associated with voting for Asian Americans using the PNAAPS data. With these studies, identifying or associating with the Asian American community is positively related to electoral participation. However, other scholars (Hune 2002; Tam 1995) caution that using the umbrella concept of Asian American can obscure key differences patterned by country of origin and ethnic identity across Asian American subgroups, so in this research we consider the category of all Asians as a sample of interest, as well as possible national and ethnic origin relationships with electoral participation.
Voting across Asian American Ethnic Subgroups
Asian ethnic subgroup, largely resulting from a national origin or homeland ethnic identity, is a focus of this analysis. The largest and fasting growing Asian ethnic subgroup is Chinese, with 4.9 million people, followed by Asian Indian (4.4 million), Filipino (4.0 million), Vietnamese (2.1 million), Korean (1.9 million), and Japanese (1.5 million); altogether these six Asian American ethnic subgroups represent 85 percent of Asian Americans (U.S. Census Bureau 2019). Across groups, Japanese are most likely to be native born (80 percent), and they largely represent the descendants of the first wave of Asian migration arriving before World War II. Hune (2002) explained that most Asian Americans, specifically Chinese, Asian Indians, Filipinos, and Koreans, are part of the second wave of Asian immigration, which took place after the 1965 Immigration Act ended Asian immigration restrictions. Since 2018, China has replaced Mexico as the largest sending country annually of foreign-born immigrants to the United States (Echeverria-Estrada and Batalova 2020). By and large, these Asian Americans migrated for economic opportunity and to reunite with family members. In contrast, Vietnamese migrants arrived along with Cambodians, Laotians, and the Hmong, as political refugees, after the Vietnam War and the passage of the 1975 Indochina Migration and Refugee Assistance Act, the 1980 Refugee Act, and the 1987 Amerasian Homecoming Act (see Hune 2002). Across these time-specific migrant waves, Asian American ethnic subgroups pattern and differentiate the primary reasons for migration—whether economic, political, or family reunification—which may in turn shape immigrant social integration.
A growing body of research (Bass and Casper 2001b; Masuoka et al. 2019; Ramakrishnan 2005; Wray-Lake, Tang, and Victorino 2016) provides evidence of variation in social and electoral participation across Asian American subgroups that is shaped directly or indirectly by country of origin. Testing for national origin differences using a naturalized sample from the CPS, Bass and Casper (2001b) found that Chinese Americans had a lower propensity to vote in the 1996 U.S. presidential election than naturalized citizens from the Philippines, Vietnam, and India, while they found no difference in the propensity to vote between Korean and Chinese Americans. Another study (Lien 2004) using CPS data showed that Korean and Vietnamese Americans differentiated their voting from the reference group of other Asian among registered voters, while another study (Masuoka et al. 2019) using Collaborative Multiracial Post-Election Survey data revealed that Filipino and Vietnamese Americans were more likely to vote than the reference category of East Asian and other Asian among registered voters. Finding more support for homeland origin, Wray-Lake et al. (2016) found that Filipino and East Indian/Pakistani American college students were more likely to report being voting involved compared with Chinese, Japanese, Korean, Vietnamese, and other Asian American college students. Although these studies used difference reference categories, when taken together, their findings provide considerable evidence that national origin is relevant to explain different levels of electoral participation across unique studies and data sources.
Scholars (Lien 2010; Lien, Conway, and Wong 2004; Ramakrishnan 2005; Tam 1995) reason that national origin affects electoral and civic participation, because each national origin group has experienced different cultural and political socialization in its country of origin. For example, Ramakrishnan (2005) and Tam (1995) explained that those who come from countries with different political systems may not be as likely to participate in American electoral practices, because their political socialization and the expectation for participating is different. Similarly, Bass and Casper (2001b) explained their results that naturalized Filipino and Indian Asian Americans have a higher propensity to vote, because they arrive with a homeland experience of open elections and similar democratic processes.
The type and timing of an immigrant wave may also shape the political socialization of naturalized citizens. Other research points to the political refugee status of Vietnamese immigrants as a positive influence in social and political socialization upon arrival in the United States, as refugees are allowed economic assistance from the government (Bass and Casper 2001b). Lien (2004) stated that those who had arrived as refugees may face difficulties in political participation due to their disadvantaged socioeconomic background related to their refugee status, but their politically motivated migration may facilitate their political participation on the other hand. Lien used this logic to postulate that Vietnamese who had arrived here as political refugees may have a higher propensity to vote than those from Korea and China, who had arrived as economic or family reunification migrants.
Overall, these studies align with the sentiment of Masuoka et al. (2019), who asserted that national origin differences have not been fully accounted for in explanations of Asian American political participation. And although prior research is limited to the extent that it uses different reference categories across studies, there is evidence suggesting that we can expect a lower likelihood to vote for Chinese Americans compared with most other ethnic subgroups.
Nativity Status, Time in the United States, and Voting
Naturalization is an important variable of focus. Although prior research has not found nativity status—whether one is native born or naturalized—to be a significant factor associated with voter turnout among registered Asian Americans as a whole (Lien 2004), nativity status remains a defining feature of the Asian American population. Asian Americans are the only major U.S. racial-ethnic group wherein naturalized citizens constitute a majority (i.e., two thirds) of eligible voters (Budiman 2020). To be sure, nativity status should be included as a focal variable when examining electoral participation for all Asian Americans, and moreover, the electoral participation of naturalized Asian Americans should be considered as a distinct analytical sample.
For naturalized American registered citizens, time in the United States is associated with a higher propensity to vote (Bass and Casper 2001b). However, this has not been found to be the case in previous research on all Asian Americans as a whole. Diaz (2012) tested for but found no relationship between time in the United States and the propensity to vote for registered Asian Americans using 2000 CPS data. This may be due to the relatively short time that Asian Americans have been in the United States, as there is not that much time variation. Time in the United States should continue to be included to understand voting participation among naturalized Asian Americans.
Research Imperative
Given the rapid increase in the number and diversity of Asian Americans in recent decades and on the basis of our synthesis of the scholarly research on Asian American voting, this research addresses the need to consider Asian ethnic subgroup differences in the propensity to vote, as well as the need to consider all Asian Americans and naturalized Asian Americans as distinctive analytical samples. We include 10 Asian American ethnic subgroups for the first time using a nationally representative sample of each subgroup. First, we profile what predicts the propensity to vote for all registered Asian Americans. Second, we profile what predicts the propensity to vote for registered naturalized Asian Americans, and we include time in the United States as a focal variable of interest.
In addition to the variables—Asian ethnic subgroups, nativity, and time in the United States—prior research makes it clear that we need to consider individual-level socioeconomic and demographic background factors as possible predictors of voting, and we also need to consider any underlying interrelationships across these factors by including these factors in our model. As an example, although naturalization is a barrier to electoral participation for immigrants, DeSipio (1996) found that increasing levels of education and age are powerful positive influences on electoral participation among Mexican and Cuban American voters. Furthermore, although voting research of the general U.S. population shows that women are more likely to vote than men (Jennings 1985), other studies have shown that naturalized women are no more likely than naturalized men to vote (Bass and Casper 2001a), so possible underlying relationships across gender and nativity status need to be considered in modeling the propensity to vote for Asian Americans. In our analysis, we include the demographic variables of gender, marital status, and age and the socioeconomic variables of educational attainment, income, and employment status for possible relationships with voting behavior, while controlling for any interrelationships across these factors.
Data and Methods
Data
We use the NAAS 2016 Post-Election Survey instrument to examine voting behavior across 10 Asian American ethnic subgroups. The survey collects nationally representative data on Asian Americans, Pacific Islanders, whites, and other ethnic groups through telephone interviews in the United States. It asks a significant amount of information of Asian Americans, which includes individuals’ demographic information and their attitudes and behaviors toward social issues. We use the NAAS because it has multiple advantages over exit polls, which include conducting interviews in multiple languages, involving respondents from ethnic enclaves and areas where Asian Americans disperse, and producing nationally representative characteristics of Asian Americans with the sample weight (Ramakrishnan et al. 2017). Furthermore, the NAAS is a quality data resource because it explicitly samples a robust number of Asian Americans, who are representative of Asian ethnic subgroups in the U.S. population. Kennedy and Ruiz (2020) asserted that prior research on the views of Asian Americans using a general national sample has typically faced high sampling error. Another strength is that the 2016 NAAS included representative national subsamples of Bangladeshi and Pakistani American voters for the first time, so a survey such as the NAAS, with its explicit focus on Asian Americans and with an adequate number and sampling frame for each of the Asian ethnic subgroups, is a real improvement to help us understand the views of Asian Americans.
By conducting telephone interviews of Asian American adults from November 10, 2016, to March 2, 2017, the NAAS included 4,393 individuals who identified as having a family background from Asia and who self-identified as Asian. The 10 Asian ethnic groups included in this analysis are 475 of Chinese origin, 320 of Bangladeshi origin, 401 of Cambodian origin, 505 of Filipino origin, 504 of Asian Indian origin, 351 of Hmong origin, 499 of Korean origin, 517 of Japanese origin, 320 of Pakistani origin, and 501 of Vietnamese origin. Table 1 shows the descriptive statistics for the variables of interest in this analysis, and the number of cases and weighted percentages are presented for the two analytical samples: all registered Asian Americans and naturalized registered Asian Americans. We weight the data using the NAAS sample weight variable, which uses a raking method and the U.S. Census Bureau’s American Community Survey data to produce nationally representative estimates by race, nativity, age, state of residence, and education (Ramakrishnan et al. 2017; Wong et al. 2011). The effective samples are representative of 2.7 million Asian Americans and 2 million naturalized Asian Americans.
Descriptive Statistics of Variables in this Analysis.

Source: National Asian American Survey 2016 Post-Election Survey.
Note: Observation cases for Asian Americans, n = 3,468; observation cases for naturalized Asian Americans, n = 2,397. Weighted percentages are presented for discrete variables. Weighted mean and standard deviation are presented for the continuous variable, time in the United States. Population size for Asian Americans is 2,682,766; population size for naturalized Asian Americans is 1,980,481.
Dependent Variable
Voting among Registered Asian Americans
Respondents, who were registered voters, were asked to indicate whether they voted in the 2016 presidential election. We treat those who voted in the election as the group of interest (coded 1) and those who did not vote as the reference group (coded 0). As shown in Table 1, 79.0 percent of registered Asian Americans and 79.1 percent of naturalized registered Asian Americans reported voting in the 2016 presidential election. The NAAS estimate for registered Asian American voting participation is in the range but different than the CPS Voting Supplement’s estimates of 65.1 percent of Asian American citizens voting and 87 percent of registered Asian American citizens voting in the 2016 presidential election (U.S. Census Bureau 2017). This difference may be a result of survey instrument differences, because the CPS asks all citizens if they registered and voted, whereas the NAAS asks all citizens if they registered and then asks only registered citizens if they voted. Adding to this, although citizens in all but one U.S. state, North Dakota, must be registered prior to Election Day in order to vote, North Dakota alone would not account for the variation in these estimates. It is established that higher estimates are typical of self-report voting data, such as the CPS Voting Supplement (U.S. Census Bureau 2020) and American National Election Studies (2020), and we expect the same for the NAAS estimates as self-reported voting data.
Independent Variables
Asian Ethnic Subgroups
We include those who identified as having any family background in Asia and who self-identified as Asian Americans in the analysis. We treat those who identified with Chinese origins as the reference group because Chinese Americans are the largest ethnic subgroup among the Asian American population. We treat those identifying as the following Asian ethnic origins as separate groups: Bangladeshi, Cambodian, Filipino, Hmong, Asian Indian, Japanese, Korean, Pakistani, and Vietnamese. Table 1 shows that the actual counts and weighted percentages of the ethnic subgroups included in the analytical samples of all registered Asian Americans and naturalized registered Asian Americans. All ethnic subgroup categories, with the exception of the Hmong ethnic subgroup, correspond to countries. Although the Hmong ethnic group may live in China, Vietnam, Laos, Thailand, or Myanmar, most Hmong in the United States came as refugees after 1975, mainly from Laos, where they are an ethnic minority group with a distinctive culture and language (Yau 2005). Well over 200,000 Hmong have fled Laos as refugees, and they are included as a distinctive Asian American ethnic subgroup in this analysis.
Using weighted data, Table 2 presents the weighted percentage who voted in the 2016 presidential election for each of the 10 Asian ethnic subgroups who are the focus of this analysis for both all registered Asian American and naturalized registered Asian American samples. Among all Asian Americans, those with Japanese origins have the highest rates of reported voting at 93.3 percent, whereas those identifying as Hmong have the lowest rates of reported voting at 53.7 percent. Among naturalized citizens, Bangladeshi Americans have the highest rates of voting at 90.3 percent, while Hmong still report the lowest rates of voting at 50.1 percent. These bivariate correlations between Asian ethnic subgroup and self-reported voting do not control for other variables associated with voting participation, such as age, education, and income, for Americans in general. We therefore examine these relationships controlling for other factors in the model. However, the results in Table 2 are in line with the results of logistic regressions presented later.
Proportion of Respondents Who Reported Voting among Registered Asian American Ethnic Subgroups.

Source: National Asian American Survey 2016 Post-Election Survey.
Note: Percentages are weighted.
Nativity Status
To investigate whether nativity affects voting behavior, respondents are considered in foreign-born and native-born groups. The group of interest consists of the foreign-born population (coded 1), which includes people who were not U.S. citizens at birth and have become U.S. citizens through naturalization. Others are grouped into the reference category, composed of those born in the United States and those born abroad to a U.S. citizen parent or parents. (coded 0). From Table 1, the nativity status variable indicates that there are 77.4 percent naturalized Asian Americans and 22.6 percent native-born Asian Americans in the effective sample.
Time in the United States
To investigate whether time spent in the United States for naturalized Asian Americans affects their voting behavior, we include time in the United States as another focal variable in the analysis. Respondents are asked to report their year of arrival in the United States in the questionnaire. We converted their year of arrival to the number of years they have lived in the United States. The newly coded time in the United States variable ranges from 2 to 71 years. Table 1 shows that the mean time spent in the United States is 28.8 years, and the standard deviation is 12.9.
Control Variables
We include several other factors that have been known to predict voting behavior as the control variables in this analysis. Control variables include gender, marital status, age, education, household income, and employment status. Gender is measured as a dummy variable, with females coded as 1 and males coded as 0. Marital status is measured with the dummy variables ever married (i.e., divorced, separated, or widowed) and single, with those who are currently married or cohabiting as the reference category. Age is measured as a categorical variable, with those 18 to 34 years old as the reference category and three dummy variables: 35 to 49, 50 to 64, and 65 to 100 years old. This categorical measurement of age aligns with recent studies of voting behavior (e.g., Logan et al. 2012).
Education is measured with dummy variables indicating those with some college, those with bachelor’s degrees, those with advanced degrees, and with those holding a high school diploma or less as the reference category. Household income is measured using a dummy variable, with 1 corresponding to having a household income greater than $50,000 per year and 0 corresponding to having a household income of $50,000 or less per year. Employment status is measured as a dummy variable, with being employed coded 1 and being unemployed coded 0 and used as the reference group.
Analytical Strategy
We use binary logistic regression models to analyze the data, because the dependent variable, voting behavior, is a binary categorical variable. The left side of the equation is a logit link function where p stands for the probability that respondents reported voting in the 2016 presidential election (Y = 1). β0 on the right side is the intercept. X1 to Xk refer to independent variables with β1 to βk as coefficients (or parameter estimates) corresponding to each independent variable, respectively
Results
Voting among Registered Asian Americans
To investigate the propensity of voting among registered Asian Americans, we use four models in Table 3. Model 1 includes the primary variables of interest, the Asian ethnic-origin subgroups. Model 2 adds nativity status. Model 3 adds demographic variables, including gender, marital status, and age, and model 4 includes socioeconomic variables, which include education, household income, and employment status.
Propensity to Vote among All Registered Asian Americans.

Source: National Asian American Survey 2016 Post-Election Survey.
Note: Weighted sample size is 2,682,766.
p < .10. *p < .05. **p < .01. ***p < .001.
Model 1 in Table 3 indicates that seven Asian American ethnic subgroups—specifically those identifying as Bangladeshi, Filipino, Asian Indian, Japanese, Korean, Pakistani, and Vietnamese—are more likely to vote than Chinese Asian Americans. This pattern of voting behavior among Asian ethnic subgroups holds constant after adding nativity status in model 2, controlling for respondents’ demographic background in model 3, and testing for socioeconomic status variables in model 4, which is the full model. Although model 1 indicates that Hmong Americans are less likely to report voting than Chinese Americans in the 2016 presidential election, this no longer holds once socioeconomic status is included in model 4.
The odds ratios presented in model 4 in Table 3 show that among those identifying as Asian American and net of other factors, those of Bangladeshi, Filipino, Asian Indian, Japanese, Korean, Pakistani, and Vietnamese origin demonstrate higher odds of voting than Chinese Americans. Specifically, the odds of voting for Bangladeshi Americans and Japanese Americans are 4.90 and 4.68 times, respectively, as great as for Chinese Americans. And the odds of voting for those of Asian Indian origin are 3.21 times as great as for Chinese Americans, net of other relationships. Adding to this, the odds of voting are higher for Vietnamese (2.63 odds ratio), Pakistani (2.44 odds ratio), Filipino (1.99 odds ratio), and Korean (1.54 odds ratio) Americans than for Chinese Americans. Overall, Chinese Americans stand out as having markedly lower rates of reported voting in the 2016 presidential election compared with most of the Asian ethnic subgroups considered, with the exceptions being the Cambodian and Hmong ethnic subgroups, for which the estimates are not significant in the full model. Figure 1 provides a visualization of the probability of voting in the 2016 presidential election across Asian ethnic subgroups. Bangladeshi Americans have the highest probability of voting at 91 percent, whereas Hmong Americans and Chinese Americans have the lowest probabilities of voting at 67 percent and 69 percent, respectively.

Probability of voting among all registered Asian Americans.
Model 4 in Table 3 also shows that nativity status, whether one is a native-born or naturalized citizen, does not affect voting behavior among all registered Asian Americans, which agrees with prior research findings of Lien (2004) on voter turnout.
Interpreting the socioeconomic and demographic relationships, model 4 shows that gender, age, and educational attainment are all associated with the outcome variable of reported voting. Among all registered Asian Americans, the propensity to vote in the 2016 presidential election is higher among women compared with men, agreeing with Jennings’s (1985) findings for the U.S. population overall. Furthermore, the odds of voting are higher for those who are 50 years and older, compared with the reference category of those 18 to 34 years old. Also, those with higher levels of educational attainment are more likely to vote than those with a high school or less educational level, all else being equal. These findings for higher ages and higher education being associated with voting agrees with prior research of Yoon (2015) using NAAS data and Bass and Casper (2001a) using CPS Voting Supplement data.
In response to Liu’s (2011) finding that religious attendance being positively associated with voting participation, we test for two relationships: (1) religious affiliation (i.e., Christian, non-Christian [e.g., Buddhist, Muslim], or not religious) and (2) frequency of worship. However, these variables are not found to be independently associated with the propensity to vote among all Asian Americans (results not shown).
Voting among Naturalized Registered Asian Americans
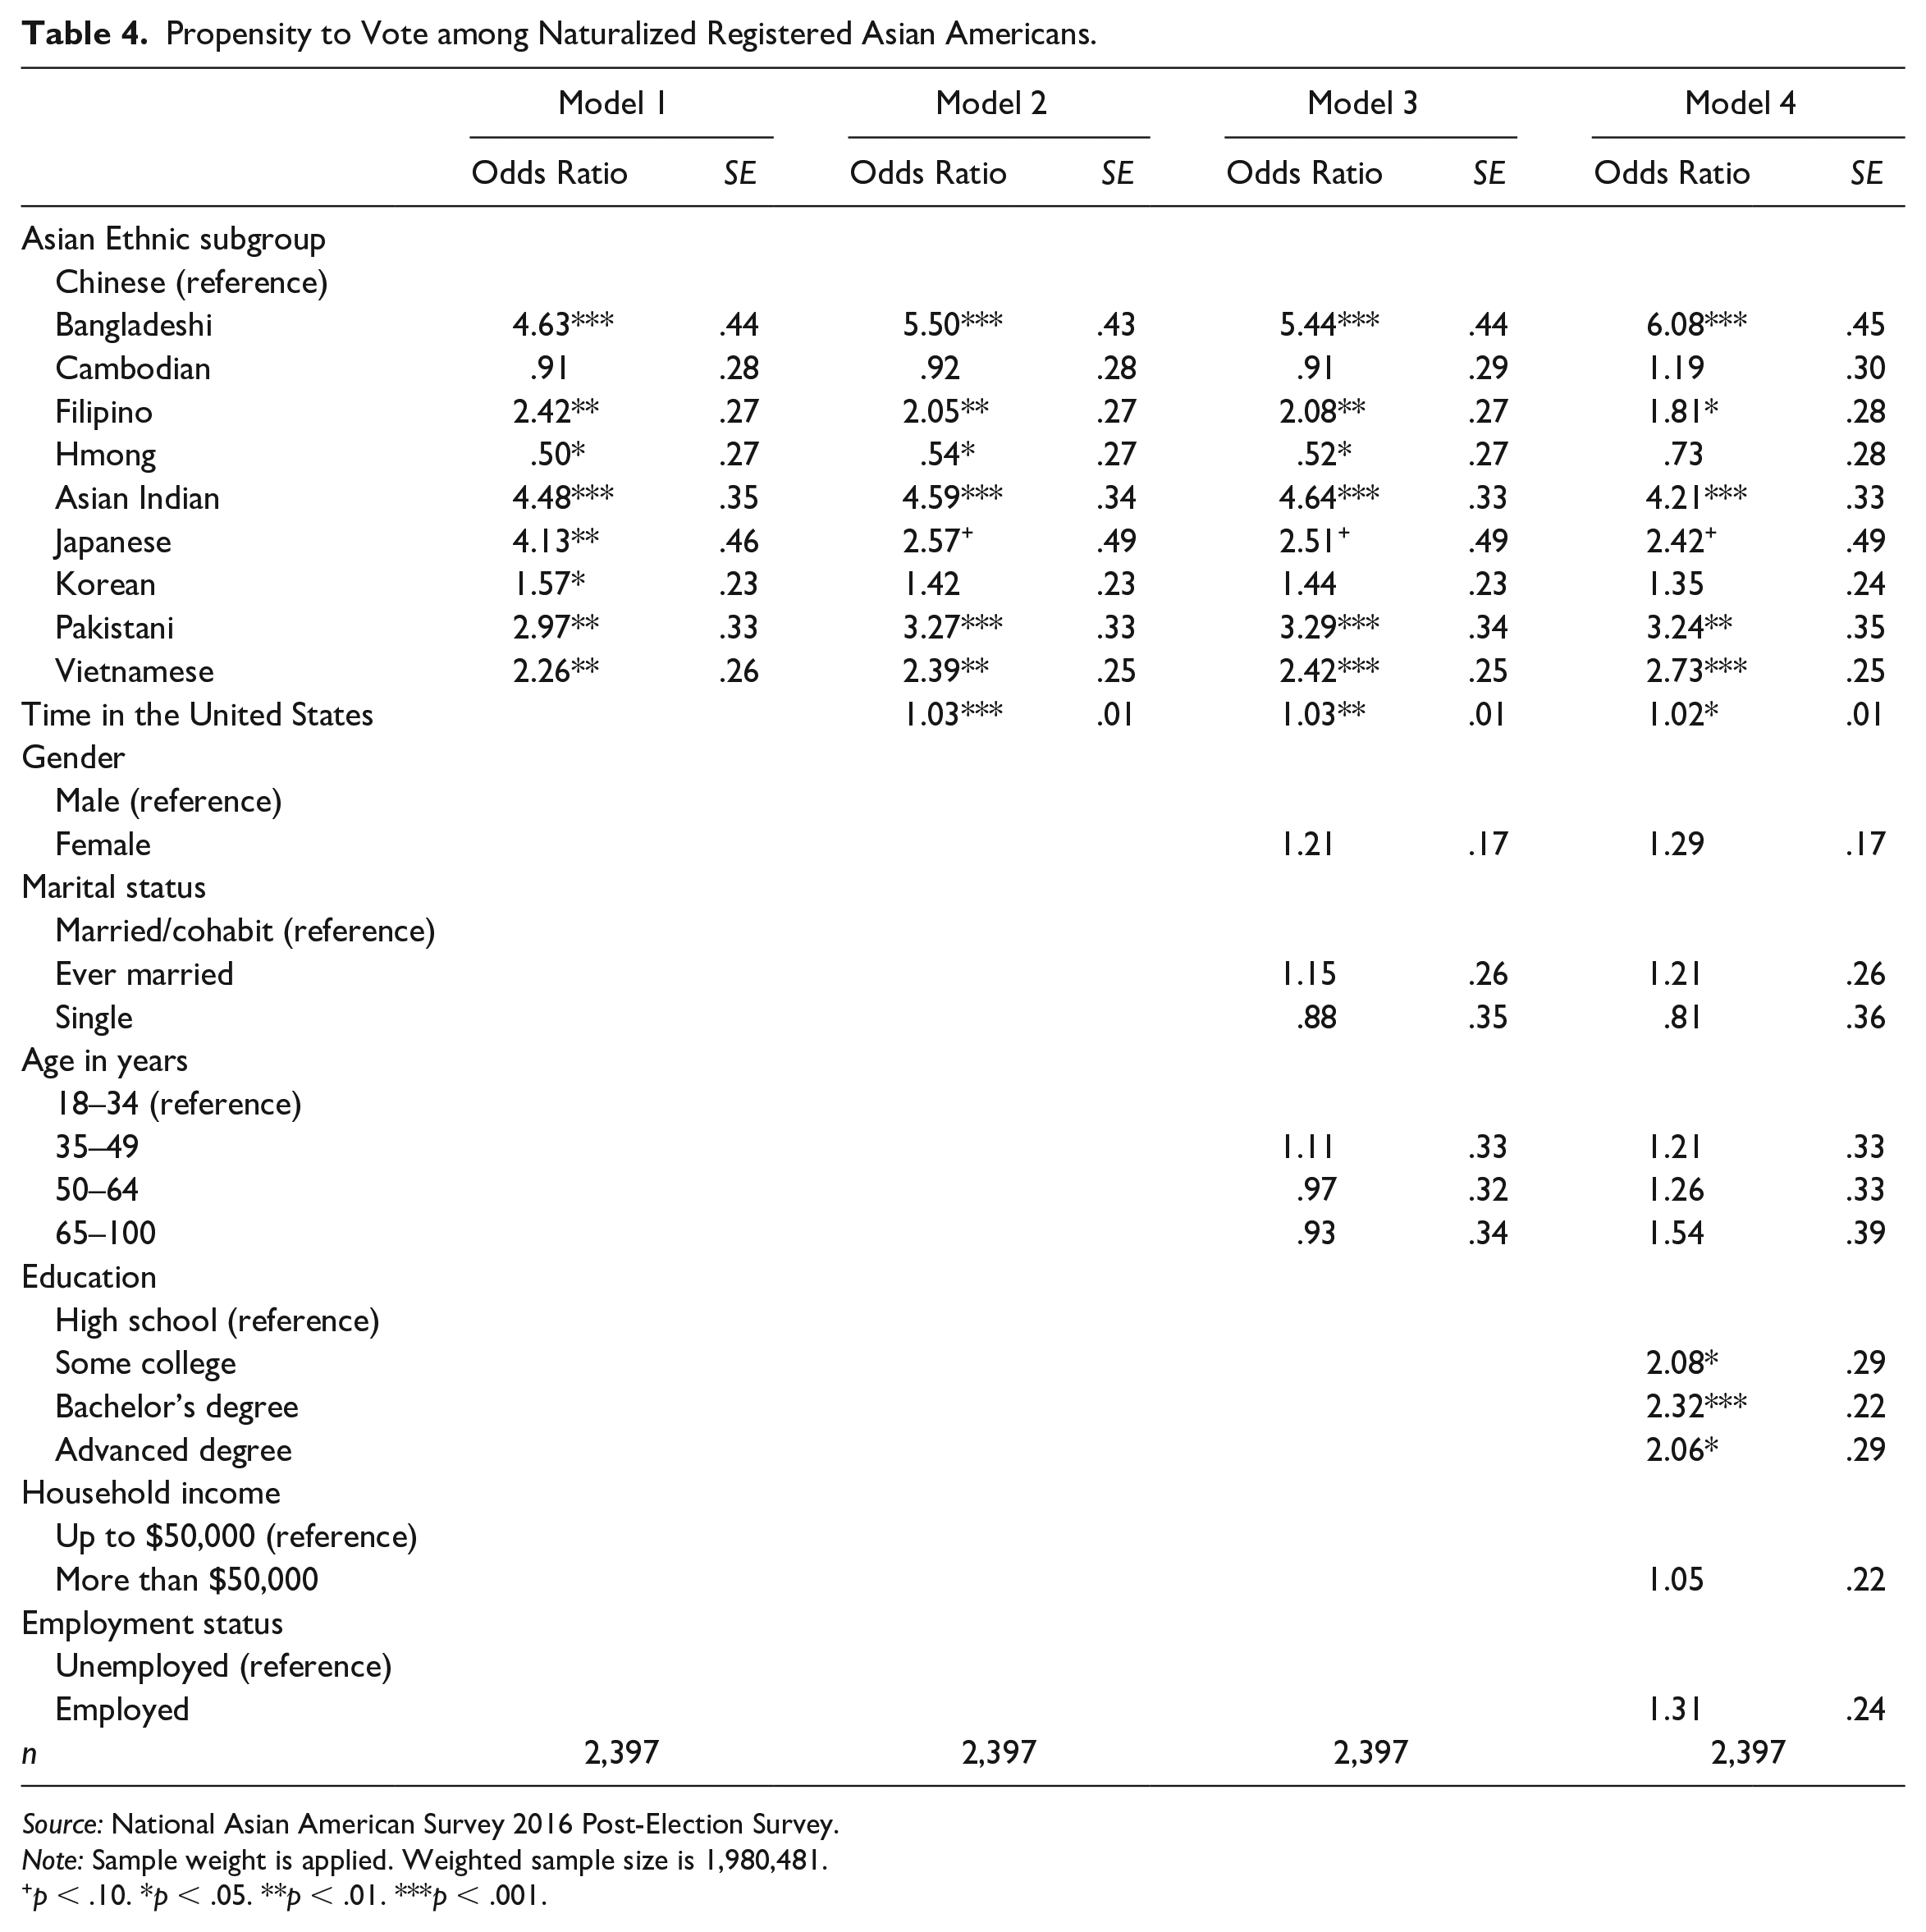
To investigate naturalized registered Asian Americans’ voting behavior, Table 4 presents the results of four models that estimate for the odds of reported voting and takes both ethnic identity and time spent in the United States into consideration as focal variables of interest. Model 1 in Table 4 tests for differences in the propensity to vote in the 2016 presidential election across naturalized Asian American ethnic subgroups. Model 2 adds time spent in the United States, and model 3 controls for the demographic variables of gender, marital status, and age. Model 4 in Table 4 tests for relationships with socioeconomic variables, which include education, household income, and employment status, and represents the full model in this analysis of voting participation among naturalized registered Asian Americans.
Propensity to Vote among Naturalized Registered Asian Americans.
Source: National Asian American Survey 2016 Post-Election Survey.
Note: Sample weight is applied. Weighted sample size is 1,980,481.
p < .10. *p < .05. **p < .01. ***p < .001.
Overall, Table 4 indicates that naturalized Asian Americans are similar in their voting profile compared with the larger Asian American group. Like the registered Asian American sample, naturalized registered Asian Americans identifying as Chinese origin are less likely to vote than those identifying as Bangladeshi, Filipino, Asian Indian, Japanese, Pakistani, and Vietnamese origin. For these six Asian American origin subgroups, the relationships remain significant in direction and magnitude across models 2 through 4, when including time in the United States and controlling for demographic and socioeconomic background factors. And although Korean Americans are more likely to report that they voted in the all registered Asian American sample presented in Table 3, Table 4 indicates that although naturalized Korean Americans seem to be more likely to vote than naturalized Chinese Americans in model 1, this relationship does not hold once time in the United States is included in model 2 and after we control for demographic and socioeconomic background.
Interpreting the full model for naturalized Asian Americans, model 4 of Table 4 indicates that those who identify with Bangladeshi, Filipino, Asian Indian, Japanese, Pakistani, and Vietnamese all have higher odds of voting than the reference category of naturalized Chinese Americans. Among naturalized Asians, Bangladeshi and Indian ethnic subgroups demonstrate a higher propensity of voting compared with Chinese Americans. Specifically, the odds of voting for Bangladeshi and Indian Americans are 6.08 and 4.21 times, separately, as great as for Chinese Americans. Among naturalized Asians, the odds of voting are greater for those identifying as Pakistani (3.24 odds ratio), Vietnamese (2.73 odds ratio), Japanese (2.42 odds ratio), and Filipino (1.81 odds ratio) than for naturalized Chinese Americans. To visualize these relationships, Figure 2 presents the probability of voting across 10 naturalized Asian American ethnic subgroups and illustrates that naturalized Bangladeshi and Indian Asian Americans have the highest probabilities of voting at 92 percent and 89 percent, respectively, whereas naturalized Hmong and Chinese Americans have the lowest probabilities of voting at 62 percent and 68 percent, respectively, all else being equal.

Probability of voting among naturalized registered Asian Americans.
Model 4 in Table 4 indicates that the focal variable, time spent in the United States, is positively associated with voting in the 2016 presidential election; the odds of voting increase with more time spent in the United States for naturalized Asian Americans. This finding stands in contrast to prior research (Diaz 2012; Lien 2004), and our finding makes a substantial contribution to understanding voting behavior among naturalized Asian Americans. In addition, those with higher levels of educational attainment are more likely to report voting in the 2016 presidential election than those with a high school or less educational level, all else being equal. In response to Liu’s (2011) finding, we test again for a relationship with religious affiliation (i.e., Christian, non-Christian [e.g., Buddhist, Muslim], or not religious) and frequency of worship, we find non-Christians are marginally more likely than Christians to report voting in the 2016 presidential election (results not shown).
Discussion
Using the most recently made available data from the NAAS 2016 Post-Election Survey, this research profiles Asian American voting behavior in the 2016 presidential election for the first time, and it investigates the propensity to vote across two nationally representative samples: a registered Asian American sample and a registered naturalized Asian American sample.
Moreover, this research addresses a gap in the voting literature by profiling the differences in voting behavior across 10 Asian American ethnic subgroups for the first time. We find that among all registered Asian Americans, those who identify as Bangladeshi, Filipino, Asian Indian, Japanese, Korean, Pakistani, and Vietnamese demonstrate a higher likelihood of voting compared with Chinese Americans. Among registered naturalized Asian Americans, those identifying as Bangladeshi, Filipino, Asian Indian, Japanese, Pakistani, and Vietnamese have higher odds of voting than naturalized Chinese Americans. The relationships that Bangladeshi Americans and Pakistani Americans have a higher likelihood of voting than Chinese Americans in both samples of all registered Asian Americans and naturalized registered Asian Americans are new findings in the voting literature. It is striking that across both samples of all registered Asian Americans and only naturalized registered Asian Americans, Chinese Americans demonstrate a lower propensity to vote compared with most other Asian ethnic subgroups.
Our findings therefore agree with and broaden the scope of prior research that theorizes and provides empirical evidence that national origin is salient for shaping the electoral participation of Asian Americans (Lien 2010; Lien et al. 2004; Ramakrishnan 2005; Tam 1995). The lower propensity to vote for Chinese Americans has been documented in prior research, with Bass and Casper (2001b) reporting lower turnout for naturalized citizens from China compared with those from the Philippines, Vietnam, and India and Tam (1995) reporting lower turnout of Chinese Americans compared with Japanese Americans among registered voters. Our research updates these findings to the 2016 presidential election and expands the number of Asian ethnic subgroups included in the analysis.
Factors related to country of origin, such as type of political system, English-speaking ability, and type and timing of immigrant wave, provide understanding of the lower propensity of voting for Chinese Americans, net of other effects. Prior scholarship (Ramakrishnan 2005; Tam 1995) makes the case that immigrants who come from countries with different political systems than in the United States may have less knowledge about how to participate and may be less inclined to participate in the American democratic system. We find that Asian Indians and Filipino Americans both evidence a higher propensity to vote than Chinese Americans, and they also arrive with considerable experience with similar democratic political institutions in their country of origin.
Drawing upon Tam Cho (1999), who found that English proficiency facilitates naturalization and political socialization for immigrants in general, Chinese Americans’ limited English proficiency helps explain their lower propensity to vote. More than half of Chinese Americans (58 percent) have limited English proficiency, which means that their English proficiency is lower than for the foreign-born population overall (Echeverria-Estrada and Batalova 2020). Across both samples, Chinese Americans evidence a lower propensity to vote compared with Indian Asian, Filipino, and Pakistani Americans, who identify with homelands where English is widely spoken and an official language of the governments.
Type and timing of immigrant wave help explain why Chinese Americans have a lower propensity to vote. Prior scholarship explains the higher propensity to vote for Vietnamese Americans compared with Chinese Americans as resulting from their refugee status, because Vietnamese refugees have received economic assistance from the U.S. government (Bass and Casper 2001b) and may be already politicized because their migration is politically motivated in nature (Lien 2004). Chinese Americans have arrived in greater numbers after 1980 as economic and family reunification migrants, and 58 percent of all Chinese immigrants arrived in 2000 or later, the past 20 years (Echeverria-Estrada and Batalova 2020). Chinese Americans represent the most recent wave of Asian immigrants; they are the largest contributor of immigrants on an annual basis since 2018. Overall, Chinese Americans are still clearing the hurdles of naturalization and registration in order to participate in electoral politics, whereas other ethnic subgroups, such as Korean Americans and Japanese Americans, have been in the United States for two generations or more and hence have had more time to socialize and integrate into the electorate.
Looking across these two Asian American samples, we find that although all registered Asian Americans exhibit voting behavior that is similar to the U.S. population, fewer socioeconomic and demographic factors are found to pattern the voting behavior among naturalized registered Asian Americans. For all registered Asian Americans, being female, being older than 50 years, and possessing higher levels of education all pattern higher odds of reported voting in the 2016 presidential election, yet for naturalized Asians, just two additional factors, time in the United States and higher levels of education, are associated with a higher likelihood of voting in the 2016 presidential election.
For registered Asian Americans overall, we find that nativity status is not associated with the propensity to vote, which agrees with prior research (Lien 2004) using another data source. Furthermore, for naturalized registered Asian Americans, we find no relationship between naturalized Asian American women and voting, which agrees with prior findings that naturalized women are no more likely than naturalized men to vote (Bass and Casper 2001a). This agreement across data sources also speaks to the usefulness and validity of the NAAS data for investigating these relationships and the propensity to vote among Asian Americans more generally.
In contrast to earlier research that asserts no relationship between time in the United States and the propensity to vote among registered Asian Americans (see Diaz 2012), we find that time in the United States is positively associated with voting in the 2016 presidential election among naturalized registered Asian Americans. This positive relationship between time in the United States and showing up to vote has been established for naturalized Americans in general (Bass and Casper 2001a), and this research extends this general pattern for the first time to ethnic subgroups of naturalized Asian Americans. Our research establishes that time in the United States is positively associated with the propensity to vote among naturalized Asian Americans and should continue to be included as an explanatory variable in future research. Related to this finding on time in the United States, we concur with Logan et al. (2012) that future research examining the voting behavior of Asian Americans should consider the possible effect of generational status (i.e., with the third generation being the salient generation to examine), yet the 2016 NAAS only allows for the first and second generations to be included. Furthermore, Tam Cho’s (1999) theorizing on the “socialization-participation connection” reminds us that the time in the United States variable may be useful, but this variable is shorthand for socialization and may not account for the diversity inherent within the category of Asian American (e.g., English proficiency, prior experience with electoral processes, immigrant wave, refugee status) or the many paths to political participation.
On the basis of prior research (Liu 2011) of Asian American voting behavior, we test for the effect of religious affiliation and religious attendance on the propensity to vote in both Asian American and naturalized Asian American samples, but we find that these two factors are not associated with the propensity to vote for all Asian Americans, and we find that non-Christians are marginally more likely than Christians to report voting in the 2016 presidential election among naturalized Asian Americans. This finding for religious affiliation among naturalized Asian Americans suggests that future research should continue to interrogate this area to understand the voting behavior of naturalized citizens.
Conclusion
This research increases our understanding of Asian American voting behavior in important ways. We profile what factors shape the propensity to vote in the 2016 presidential election for the first time and across two samples: all registered Asian Americans and naturalized registered Asian Americans. Furthermore, this research tests for differences in the propensity to vote across 10 ethnic subgroups within the diverse pan-Asian American category and finds that Chinese Americans are less likely to vote than Bangladeshi, Filipino, Asian Indian, Japanese, Korean, Pakistani, and Vietnamese American ethnic subgroups when considering all registered Asian Americans and that these relationships hold except for Korean Americans when considering the naturalized registered Asian American sample. Another contribution of this research is that it includes both Bangladeshi Americans and Pakistani Americans in modeling the voting behavior of Asian Americans for the first time. Furthermore, this research establishes that time in the United States is a relevant factor associated with the propensity to vote among naturalized Asian Americans. Finally, our use of the NAAS 2016 Post-Election Survey for this purpose highlights the usefulness of this relatively new public-use data resource for this type of analysis.
In addition to establishing the salience of Asian ethnic subgroups as a relevant factor to understand Asian American voting participation, this research highlights the need for more research to disentangle the underlying variation across Asian subgroups related to homeland factors—such as type of political system, English proficiency, and type and timing of immigrant wave—that may shape the social and political integration of Asian immigrants. Future research on Asian Americans should consider Asian ethnic subgroups as explanatory variables and, if possible, as distinct analytical samples to comprehend this ethnic subgroup variation. Indeed, this research suggests that ethnic subgroup variation is key to gaining a better grasp of Asian American civic socialization and electoral participation.
Footnotes
Acknowledgements
We wish to thank the University Libraries Open Access Fund at the University of Oklahoma for their generous support. In addition, we are grateful to the peer reviewers and editors of Socius for their comments, which greatly improved this research.