
Abstract
Access to child care centers reduces the care burden of parents, promotes child development, and creates employment opportunities. During the coronavirus disease 2019 pandemic, however, many child care centers closed or reduced capacity because of restrictions and declining demand for in-person care. The authors use anonymized and aggregated mobile phone data to track year-over-year changes in visits to child care centers across most counties in the United States during each month of the pandemic. The findings reveal that two-thirds of child care centers closed in April 2020, while one-third remained closed in April 2021. Moreover, non-White families are more likely to be exposed to child care closures than White families. The findings point to widening inequalities in access to child care and potential inequalities in the pace of labor market recovery after the pandemic subsides. The authors make their monthly updated database on child care closures publicly available.
Child care centers are essential resources for parents, children, and the economy. Access to child care centers reduces the domestic care burden for parents and family members, provides an environment for social and cognitive development in young children, and generates thousands of jobs (England and Folbre 1999; Hook 2006; Pettit and Hook 2005; Rindfuss et al. 2007). During the coronavirus disease 2019 (COVID-19) pandemic, however, many child care centers in the United States closed or greatly reduced capacity to limit the spread of COVID-19. Even among child care centers remaining open, many parents opted out of sending their children to in-person care (Barnett, Jung, and Nores 2020).
With the rise of COVID-19 cases in the United States, federal and state governments mandated or recommended the closure of businesses and schools, including many child care centers, in April 2020 (Education Week 2020). Data show extensive closure among public and private child care centers by June 2020 (Barnett et al. 2020). Throughout the end of 2020 and the start of 2021, however, child care closures (which we define as reducing capacity by at least 50 percent of prepandemic levels) have varied across place and time because of variation in the risk for COVID-19 contagion, public guidelines around reopening, and social and political preferences for reopening. Thus far, however, little information exists as to the precise demographic, socioeconomic, and geographic distributions of child care closures in 2020 and the beginning of 2021. Knowledge of disparities in child care closure is critical for an understanding of the potential exacerbation of inequalities in access to child care, parental unemployment, child development, and the survival of child care centers.
This study introduces the U.S. Database of Child Care Closures during COVID-19, a public-access database covering most counties in the United States from January 2020 through April 2021 (at time of writing, though the public data set will continue to be updated monthly). Using aggregated, anonymized, monthly tracking data of more than 40 million mobile phone users provided by SafeGraph, we measure the year-over-year change in total monthly in-person visits to child care centers throughout 2020 and the beginning of 2021. This year-over-year change is used to determine the closure status of each individual organization. Validation checks presented within this study suggest that our estimates of child care closures align closely with similar data on school closures and with estimates of year-over-year changes in state-level employment rates among mothers with young children.
We combine the SafeGraph data with county-level indicators to determine how characteristics of families and children affected by child care closures vary by race/ethnicity, income, single-parent status, and other characteristics. Prior research has shown that child care deserts (geographic locations with inadequate child care supply) vary from state to state but disproportionately affect rural communities, low- and middle-income families, and Black and Latino families at the national level (Malik et al. 2018). It is possible that these inequalities have worsened over the past year because of COVID-19-related child care closures.
Our findings make three primary contributions. First, we find that Black, Latino, and Asian families have been exposed to child care closures to a much greater extent than White families. Second, we find that a large share of closed child care centers are located in densely populated areas, though closures also extend throughout many sparsely populated regions. Third, we make our data set public for all to use at no cost, with the hope of spurring future research on the short- and long-term consequences of child care center closures during the COVID-19 pandemic.
Background
The Importance of Child Care Services
Child care services alleviate parental care responsibilities, provide a safe and nurturing environment for young children, and supply jobs for caretakers and early educators (England and Folbre 1999; Gornick and Meyers 2003; Hook 2006; Pettit and Hook 2005; Rindfuss et al. 2007). For working parents, child care centers provide reliable supervision and physical care of children—including feeding, playing, and hygienic maintenance—throughout the workday. With two-thirds of children five years of age and younger in the United States having all available parents in the workforce, child care services are especially important (KIDS COUNT Data Center 2019). In 2016, 58.7 percent of children younger than five years participated in nonparental child care arrangements (RegionTrack 2019). Additionally, 88.4 percent of children younger than five years with two full-time working parents, and 83.5 percent of children younger than five years with a full-time working single parent, depended on nonparental-based child care services (RegionTrack 2019).
For young children, child care can be an essential part of development. In particular, the cognitive, linguistic, and social development of young children has shown to be positively correlated with the quality of child care received, independent of the demographic characteristics of children (Burchinal et al. 2000; Keys et al. 2013; Phillips, McCartney, and Scarr 1987). Specifically, the National Institute of Child Health and Human Development (2006) reported that high-quality child care is a predictor of academic readiness, positive social interaction, and cooperative and compliant behavior in young children. Quality of child care was determined on the basis of the adult-to-child ratio and education and/or vocational training of the child care provider. Additional studies have shown the positive impact of child care provider education and/or training on the quality of child care provided to children (Bernal 2015; Harding Weaver 2002; Koh and Neuman 2009; Mashburn et al. 2008).
COVID-19 and Child Care
After the onset of the COVID-19 pandemic, child care centers across the country closed or reduced capacity to limit the spread of the virus. A study of close to 1,000 children three to five years of age showed that by the beginning of June 2020, preschool enrollment had dropped from the prepandemic rate of 61 percent to merely 8 percent of all children in the United States, independent of demographic background (Barnett et al. 2020). This drop in enrollment was due to program closure, which affected 74 percent of children previously enrolled, as well as voluntary decisions by 11.7 percent of families to remove children from preschool programs that remained open (Barnett et al. 2020). By September 2020, however, it was estimated that 50 percent of children who previously left preschool programs because of COVID-19 had returned to classrooms, with significant variation in return rate by state (Greszler and Burke 2020).
Closures of child care centers because of COVID-19 have been difficult on child care staff members, parents, and children. For early educators provided with the option of teaching online, the transition to remote learning was sudden and left early educators unprepared for an online format (Barnett and Jung 2020). Additionally, child care staff members have expressed concerns of unemployment and reduced salary. In a March 2020 survey of 6,000 child care providers, 49 percent reported that they had experienced loss of income because of reduced enrollment. In the same survey, only 11 percent of child care providers reported that their respective programs would confidently be able to survive an indeterminate length of closure without financial assistance (National Association for the Education of Young Children 2020). To make up for the financial insecurity caused by limited enrollment, many child care programs have increased fees. One study suggests that pandemic-related state guidelines have forced child care centers to increase enrollment fees by 47 percent during the COVID-19 pandemic (Workman and Jessen-Howard 2020). As a consequence, inequalities in access to child care services may rise because only a select group of individuals are able to afford increased enrollment fees.
With significant closure of daycare centers, child care responsibilities have been abruptly placed on many parents. These added responsibilities throughout the day make it difficult for working parents to balance family and work. As of early 2021, mothers and fathers are, on average, working fewer hours than before the start of the pandemic. However, a greater proportion of mothers have decreased working hours or left the job market completely (Collins et al. 2021; Kochhar 2020). Parents of children of all ages experienced decreases in working hours in 2020 compared with 2019, but working mothers of children five years and younger were found to have worked the least number of total hours per week compared with mothers and fathers of older children (Kochhar 2020). Additionally, women have been found to take on a disproportionate share of unpaid child care work compared with men during the COVID-19 pandemic (Zamarro and Prados 2020). Parents have also experienced negative mental health changes over the course of the pandemic, with a greater share of mothers experiencing depression, feelings of isolation, and stress compared with fathers (Cox and Abrams 2020; Zamarro and Prados 2020). Put simply, the evidence suggests that the closure of child care centers has been difficult for parents (and mothers especially) who wish to remain employed full-time.
The transition to at-home child care has also resulted in worsened care for young children in many cases. Young children affected by COVID-19-related child care closures lack daily participation in at-home learning activities, such as reading with an adult, physical exercise, and engaging with music (Barnett et al. 2020). Additionally, parental engagement in learning activities varies across race/ethnicity and parental education. In general, non-Hispanic White children read more with their parents and engage in more frequent physical play relative to engaging in activities on a computer or television compared with non-Hispanic Black and Hispanic children. A similar relationship is observed when considering increasing levels of parental education and child at-home learning activities (Barnett et al. 2020). As a result, non-Hispanic Black and Hispanic children, as well as children with parents of lower levels of education, are more likely to engage in extensive screen viewing, which has been shown to be associated with higher risk for obesity, negative sleep habits, and social and cognitive developmental delays (Council on Communications and Media 2016; Cox et al. 2012; Hinkley et al. 2014; Tomopoulos et al. 2010; Waller et al. 2021). Moreover, 63 percent of children previously enrolled in individualized education programs are not receiving full support in remote settings (Barnett et al. 2020). As a result, children already struggling with cognitive and social development may fall further behind during the COVID-19 pandemic.
Child care closures risk the exacerbation of numerous inequalities in access to child care. With reduced enrollment and increased enrollment fees, it is possible that low-income families will not be able to afford child care as easily as high-income families. Similarly, child care deserts may widen, which would disproportionately affect racial/ethnic minorities and lower income families (Malik et al. 2020).
However, although the literature has made clear the consequences of child care closures, scholars and the general public still lack a thorough accounting of demographic, socioeconomic, and geographic disparities in exposure to child care closures throughout the COVID-19 pandemic. In this study we thus investigate inequalities in exposure to child care closures from the prepandemic period of January 2020 through April 2021.
Data
Data Source
We construct the U.S. Database of Child Care Closures during COVID-19 using aggregated, anonymized data from SafeGraph. SafeGraph provides Global Positioning System data on more than 40 million mobile phone users in the U.S. The monthly release of SafeGraph data provides updated information on the movement of users to close to 6.5 million physical locations, including child care centers, businesses, and other public spaces. SafeGraph coverage and U.S. census population counts were closely correlated by state (r = 0.977), county (r = 0.966), racial/ethnic makeup (r = 1.00), level of education (r = 0.999), and 16-category household income bin (r = 0.997). SafeGraph data have been used widely in recent research related to mobility during the COVID-19 pandemic (Allcott et al. 2020; Dave et al. 2021; Goolsbee and Syverson 2021; Parolin and Lee 2021; Simonov et al. 2020).
Key Measures
Our data include 85,328 total child care centers across 2,228 U.S. counties. The child care centers belong to North American Industry Classification System code 62441, which identifies all centers that are “primarily engaged in providing day care of infants or children. These establishments generally care for preschool children, but may care for older children when they are not in school and may also offer pre-kindergarten and/or kindergarten educational programs” (NAICS Association 2017). We estimate the coverage rate of the SafeGraph data to be about 78 percent of all licensed child care centers, the broadest among available data sets. 1 This estimate is based on the number of child care centers in our database relative to the 109,414 total licensed child care institutions in the United States (National Association for Regulatory Administration 2017). For each child care center, we measure the monthly year-over-year change in total visits to determine the rate of closure. For example, if there were 100 recorded visits to a given child care center in January 2019 and 40 visits in January 2020, the year-over-year decline is 60 percent. For both 2020 and 2021 data, we calculate the year-over-year change by comparing the monthly total visits with the total visits during the same month in 2019. Child care centers with more than 50 percent declines in year-over-year visits were determined to be “closed” or “at reduced capacity,” suggesting that more than 50 percent of children and families were no longer receiving in-person services. We emphasize that this indicator measures de facto rather than de jure closure; if a center does not formally close its doors, but more than half of families stop attending, it is likely to show up in our data as experiencing a 50 percent or greater decline in monthly visits. The 50 percent benchmark follows findings from Parolin and Lee (2021) that this particular threshold is useful in identifying public schools experiencing verified closures. Additionally, in our public data set, we provide estimates on the share of child care centers that exhibit 25 percent and 75 percent declines in in-person attendance. The public data set also provides the mean year-over-year change for all geographic units and aggregates child care center closure rates at the census tract, county, and state levels for each month.
Geographic, Demographic, and Socioeconomic Covariates
The SafeGraph data provide the name and geographic location (state, county, and census tract) of each child care center. We combine these data with external sources on the demographic and socioeconomic characteristics of families in the census tract or county where the center is located. 2 Specifically, we merge in data from Opportunity Atlas to provide the following characteristics of each census tract: the share of families headed by a single parent; the share of families in poverty; the share of White, Black, Latino, and Asian families; the share of adults who have a college degree; median income; and population density (Chetty et al. 2018).
Validation Tests
This study follows the same methods as Parolin and Lee (2021) in Nature Human Behaviour, but we apply the framework to measure child care closures rather than school closures. Parolin and Lee presented several sets of validation tests to demonstrate that the SafeGraph data accurately reflect patterns of school closures in the United States. Their study was able to benchmark its findings against other public data related to school closures, including school-provided reports on their closure status. Unfortunately, there do not exist similar public data sets for child care closures; thus, we cannot benchmark our results to the same extent as Parolin and Lee (2021). Given that we use the same data framework and methods and that SafeGraph’s coverage rate of child care centers is comparable with its coverage rate of public schools, there is little reason to believe that the child care data would be notably less accurate than the public schools data. Nonetheless, we present two validation checks in Appendix A to corroborate this claim as best as possible.
The left panel of Figure A1 in Appendix A shows that state-level estimates of school closures from Parolin and Lee (2021) align very closely with this study’s state-level estimates of child care closures. The correlation is .9, suggesting that, as expected, child care centers and public schools tend to experience similar variation in rates of closure. The right panel of Figure A1 shows that our state-level estimates of child care centers overlap moderately with year-over-year changes in employment rates among mothers with children younger than five years (r = .4). This association cannot, of course, provide any certainty that child care closures are the source of the employment declines, as both indicators are endogenous to the spread of COVID-19 and other covariates; nonetheless, the close association of the two indicators provides greater certainty of the accuracy and usefulness of the SafeGraph data.
Limitations
We emphasize several potential limitations of the data set. First, we measure only formal, center-based child care; our data set does not account for home-based care or care provided in other informal settings. Second, mobile tracking data may overstate child care closures if the pandemic-influenced economic crisis led to families reducing phone plan coverage. Third, our tract-specific analyses rely on the assumption that families tend to use child care services within their given census tract, which is not always the case. However, we also provide county- and state-level estimates in our public data set. Finally, the use of mobile phone data to measure in-person visits to a center may be biased in centers that used alternative pickup or drop-off points during the pandemic or if centers limited entry to parents in a way that did not allow mobile phones to be registered as visiting the center. Despite these limitations, our validation checks and descriptive evidence provide confidence that the data tend to accurately represent child care center closures across the United States.
Analysis
This study exclusively provides descriptive evidence of child care closure rates and disparities in exposure to closures from January 2020 to April 2021. We make the database publicly accessible for researchers to use in future investigations. The link to the database can be found in Appendix B.
Findings
Figure 1 displays the share of U.S. child care centers with a 50 percent or more year-over-year decline in in-person visits, our benchmark to estimate whether a child care center is closed. The figure also visualizes the share of centers with reduced capacity at varying levels above the 50 percent cutoff: a 50 percent to 60 percent decline, a 60 percent to 70 percent decline, and so on.
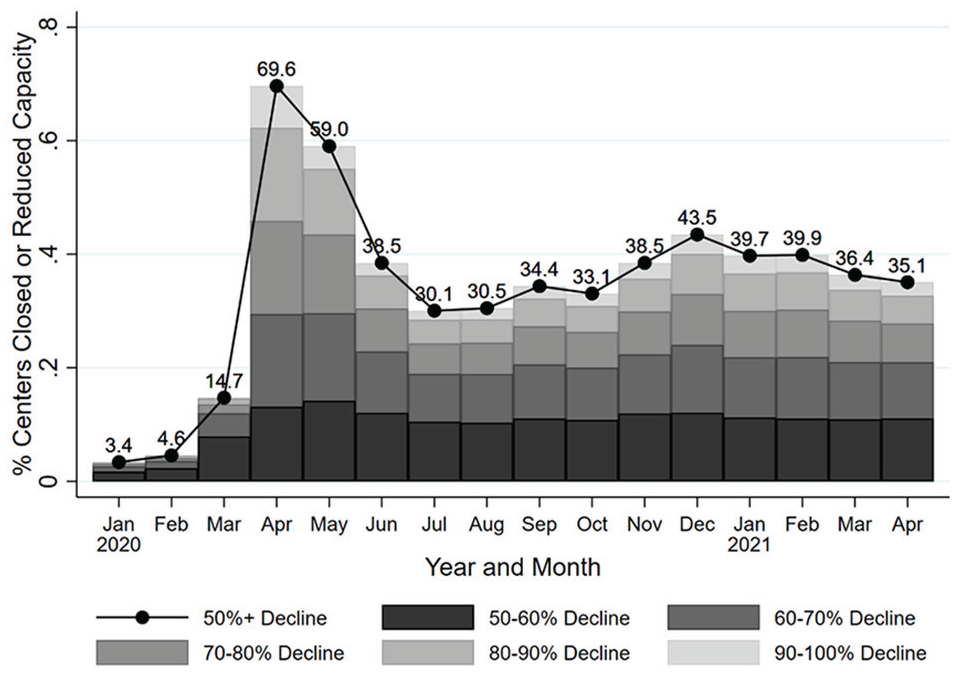
National trend in share of child care centers with at least 50 percent year-over-year decline in in-person visits.
The first major peak in child care center closure is observed in April 2020, closely aligning with the first-wave COVID-19 spike in the United States (New York Times 2021). An estimated 70 percent of child care centers were closed or reduced capacity by at least half in April 2020. This rate declined to 59 percent in May and subsequently dropped to 38.5 percent in June, 30.5 percent in August, 34.4 percent in September, and 33.1 percent in October. In November, however, the rate increased to 38.5 percent and climbed further to 43.5 percent in December 2020, perhaps in part because of a new wave of COVID-19 cases in the United States in the same month. The relative spike in child care center closure in April and December 2020 aligns with a report by Procare Solutions (2021), producer of one of the leading child care management software packages currently available. 3 In April 2021, 35 percent of child care centers remained closed, roughly half the rate observed in April 2020.
Figure 2 presents the estimated racial/ethnic characteristics of families affected by child care closures across the United States. These estimates are based on the racial/ethnic composition of residents in the census tract associated with each child care center. Trends in exposure to closures for White, Black, Latino, and Asian families show similar trends, but with large and persistent differences in levels of exposure. From March 2020 onward, White families have faced less exposure to child care closures (lower than the national average) throughout the pandemic. In April 2021, for example, an estimated 27.5 percent of White families were exposed to child care closures. In contrast, an estimated 37.6 percent of Black families, 40.1 percent of Latino families, and 42.4 percent of Asian families were exposed to child care closures.
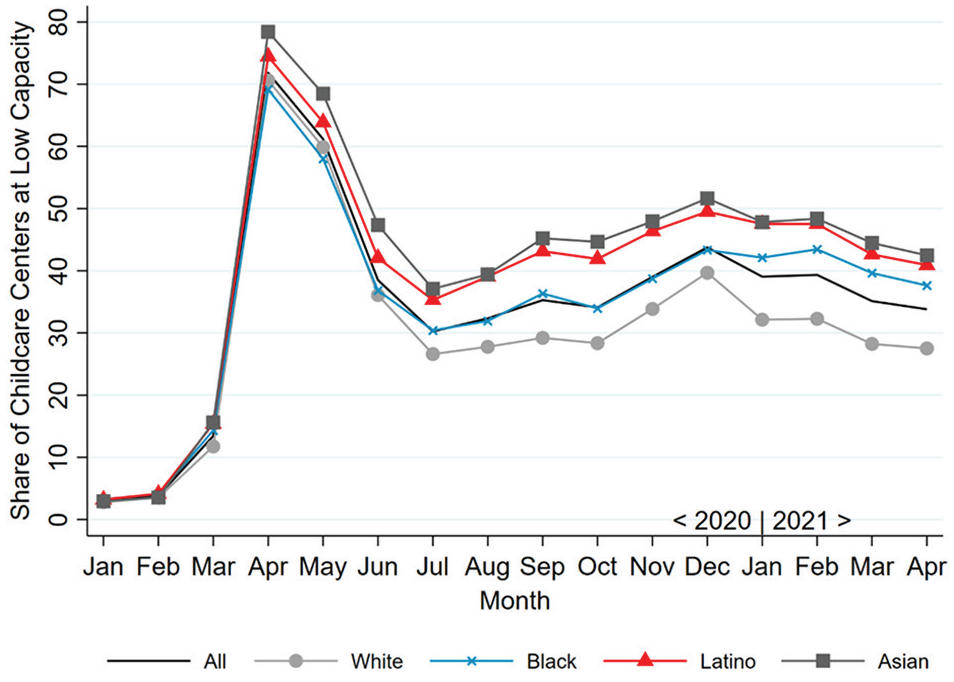
Trend in share of child care centers with at least 50 percent year-over-year decline in in-person visits by race/ethnicity of families in census tract.
Figure 3 displays trends in closures for various demographic, socioeconomic, and geographic characteristics of affected families. For each subplot, the average monthly percentage of closed child care centers (50 percent or more decline in in-person attendance) is plotted against the deciles of the characteristics along the x axis. In other words, the y axis presents the mean closure rate from April 2020 through April 2021, while the x axis includes 10 points representing the decile value of the given characteristic.

Binned scatterplots showing share of child care centers with at least 50 percent year-over-year decline in in-person visits by characteristics of census tract (mean, April 2020 to April 2021).
The top left panel of Figure 3 shows a negative correlation between the share of White families and the percentage of closed child care centers in each census tract. The nearly linear fit shows, in other words, that non-White families are particularly exposed to child care closures. Specifically, the census tracts with the highest shares of White families face a mean closure rate of about 20 percent, while tracts with the lowest shares of White residents face a closure rate of around 40 percent.
The top middle panel shows that the share of Black families in a tract is not strongly associated with closure rates. In contrast, the top right panel shows a positive association between closure rates and the share of Latino families in the census tract. The child care centers serving the greatest share of Latino families show a 40 percent closure rate, whereas those with the lowest share of Latino families show only 25 percent closure. A similar trend can be seen in the middle left panel, displaying an increase in child care closure as the share of Asian families increases in a census tract.
The middle and middle right panels show a slight U-shaped relationship between the share of families in poverty (middle) and the share of single-parent families (middle right) and closure rates, while the bottom row shows stronger, positive associations among closure rates and the share of the census tract with a college degree (bottom left), median income of the census tract (bottom middle), and population density of the census tract (bottom right).
Figure 4 displays the geographic distribution of child care closure across the United States from April 2020 to April 2021. Data for 2,228 (about three fourths of) U.S. counties are included. Each county is color-coded according to the average year-over-year change in in-person attendance across child care centers in a given county. The darkest shaded counties experienced 50 percent or more decline in in-person attendance, which is the cutoff used throughout this study to identify a child care center as closed. The lightest shaded counties are those that experienced less than a 20 percent decline in attendance. Mobile tracking data for child care centers were not available for gray-shaded counties, which tend to be smaller and less populated.

Mean year-over-year decline in in-person visits to child care centers by county (April 2020 to April 2021).
Counties experiencing relatively high rates of child care closure appear to be concentrated along the coasts of California, Oregon, and Washington, as well as along the northeastern coast. There are fewer child care center closures toward the middle of the United States; that said, there remain counties with 40 percent or greater closure scattered throughout the Midwest, generally around large population clusters. Some states, such as Hawaii, Wyoming, and Maine, express relatively low closure rates, with all associated counties having less than 50 percent child care closure from April 2020 to April 2021.
Discussion and Conclusion
The COVID-19 pandemic has resulted in widespread closure of child care centers across the country. April 2020 experienced the greatest rate of closure (defined as capacity reduction equal to or greater than 50 percent of prepandemic attendance) at 70 percent, and the rate remained about 35 percent one year later in April 2021. Child care closures, although often necessary to prevent the spread of COVID-19, have likely contributed to increased stress for working parents and reduced employment among parents, mothers in particular. Moreover, the closures have contributed to fewer jobs for child care workers and may risk a decline in the quality of care provided to children. This study provides descriptive evidence of large racial/ethnic and geographic disparities in exposure to child care closure across the United States during the COVID-19 pandemic.
Our findings show that a disproportionate share of Latino, Asian, and Black families are affected by child care closures. Latino and Asian families since the start of the pandemic (and Black families since the start of 2021) have consistently experienced child care closure at rates above the national average. In contrast, White families have experienced child care closure at rates below the national average.
We also show geographic disparities in child care closure, with areas along the west coast and northeast coast experiencing relatively high rates of closure. These areas tend to include large, dense metropolitan areas. Because of the tendency of large cities to have greater racial/ethnic diversity in comparison with more rural areas, this likely helps explain the racial/ethnic disparities in child care center closure. However, child care closures are not confined to major cities; geographic regions experiencing high rates of closure are scattered across the country. In contrast, regions such as Hawaii, Wyoming, and Maine experienced relatively low closure rates.
Racial/ethnic and geographic disparities in child care closure risk the widening of preexisting disparities in access to the limited supply of child care services in the United States (Malik et al. 2018). As such, they may generate further inequalities in labor market outcomes as the pandemic subsides.
To spur future research, we provide researchers access to our database using the link in Appendix B. The database features monthly updated closure rates for more than 80,000 child care centers across the country, aggregated up to the levels of census tract, county, and state. This database can be used to investigate potential consequences of child care closures, such as the impact of closures on parental employment, child development, and family well-being.
Footnotes
Appendix A: Sensitivity Tests Figure
Appendix B: Data Access
This study introduces the U.S. Database of Child Care Closures during COVID-19, made publicly available to all researchers at no cost. The data are updated monthly and can be downloaded at https://osf.io/k3t98/.
Funding
The author(s) disclosed receipt of the following financial support for the research, authorship, and/or publication of this article: We acknowledge funding from the Bill and Melinda Gates Foundation.
1
The 85,328 centers included are those that SafeGraph can identify on the basis of the information associated with the center’s online presence (such as being listed as a childcare center in a maps-based application or online). The centers included should not be understood as a random sample selected from a larger population of centers, as SafeGraph attempts to collect data from all such institutions it can identify. Without having a centralized database of all childcare institutions and their prepandemic attendance rates, we cannot assess whether the “missing” centers are notably different in characteristics relative to the centers included. This is a limitation of our study.
2
Census tracts are small geographic units nested within counties. There are more than 2,000 tracts in New York City alone, for example.
3
Procare uses data collected from its pool of child care center clients to estimate closure rates; their measure of closure thus differs from our 50 percent year-over-year decline measure.