
Abstract
Despite growing economic inequality in recent decades, public support for government intervention to address it has been stable. A substantial literature has documented the individual-level demographic, social, and political characteristics that are associated with the extent to which individuals favor government intervention to reduce inequality. However, less work has examined how the local social environments that individuals are embedded in shape attitudes regarding inequality remediation. Using data from the General Social Survey (2006–2012) and other data sources, the authors examine whether local economic and social characteristics are associated with individuals’ support for government intervention to address income inequality in the United States during the Great Recession. Specifically, the authors link restricted General Social Survey data with place-level identifiers to county-level data on local income inequality, racial segregation, and partisan leanings. Broadly, the authors find that although individual-level conditions and year fixed effects are strongly correlated with perceptions about inequality remediation, most local-level characteristics were not strongly nor significantly associated with individual attitudes regarding government intervention to address inequality. These findings suggest that individuals formulate policy stances regarding inequality on the basis of national messaging rather than on observations within their own communities.
In the leadup to the Great Recession, scholars, policy makers, the media, and the general public became increasingly concerned with rising inequality by income and wealth in the United States. Income inequality has been rising steadily over the past several decades, and inequality today is at least as high if not higher than inequality during the 1920s. As inequality has risen, so too has public concern over the issue. The Occupy Wall Street protests of the early 2010s propelled inequality into national prominence. With slogan “We are the 99 percent”, the movement called attention to the rising gap between the richest Americans (the 1 percent) and everybody else and spurred politicians to do something to reduce inequality. In his final state of the union address, President Obama (2016) argued that rising income inequality was one of the four biggest questions facing the United States. In turn, scholars have recently examined how the public perceives inequality, specifically, whether these perceptions are accurate (Gimpelson and Treisman 2015; Norton and Ariely 2011), whether the public thinks there is too much or too little inequality (Kenworthy and McCall 2008; McCall 2013), and whether they perceive it as a corrosive social problem (Fairbrother and Martin 2013; Hastings 2019; Pickett and Wilkinson 2015).
A plausible, and commonly stated, hypothesis is that as inequality increases, the public will be more inclined to believe that something should be done to remediate it (Jordan 2018; McCall and Kenworthy 2009; Sands 2017; Wright 2017). But to date, research on this topic shows that public attitudes about inequality, particularly redistribution, have not changed in response to rising income inequality (Breznau and Hommerich 2019; Kenworthy and McCall 2008; McCall and Kenworthy 2009; VanHeuvelen 2017; Wright 2018). Figure 1 demonstrates that over time, there is essentially no correlation between increases in income inequality (as measured by the Gini index) and changes in the American public’s attitudes about whether the government should do something to reduce it. 1 Other research suggests similar patterns for other attitudinal measures about inequality remediation, including whether income differentials in the United States are “too large,” whether the government should be responsible for reducing income differences, and support for government action to redistribute wealth (McCall 2013). The question, then, is what does matter for shaping individual attitudes about inequality remediation?

Gini index and support for inequality remediation, 1978 to 2018.
In light of these patterns, a growing literature highlights the individual-level social, structural, and cultural characteristics that are associated with the extent to which individuals feel something should be done about rising inequality. For example, people of color, women, low-income individuals, and those who are politically liberal are more likely to report that the government should do something to reduce inequality than their counterparts (Cech 2017; Davis and Robinson 1991; Kluegel and Smith 1986; McCall 2013). However, less work has examined how the immediate social environments that individuals are embedded in may shape perceptions of social inequality and what should be done about it. For example, those who live in more socially unequal environments may be more or less likely to endorse government action to reduce inequality. Similarly, high levels of segregation by race and social class may skew how Americans perceive inequality, as they are often surrounded by those who share their outlooks and social position in life. Recent experimental work provides suggestive evidence that social context shapes individuals’ perceptions about whether inequality should be reduced (Chavanne 2018; Heiserman and Simpson 2017; McCall et al. 2017; Sands 2017). Other evidence suggests that higher inequality in U.S. states is associated with a reduced sense of financial satisfaction (Hastings 2019). Still, no research we are aware of has explicitly examined the contextual correlates of inequality remediation.
In this study, we ask how local social and economic context is associated with individual attitudes about inequality remediation. To do this, we use restricted data from the General Social Survey (GSS) coupled with county-level data from the American Community Survey and other sources to examine whether local economic and social characteristics are associated with individuals’ perceptions of what should be done to reduce social inequality in the United States. Broadly, we find that although individual-level conditions and year fixed effects are strongly correlated with attitudes about inequality remediation, local-level characteristics, including measures of social inequality, are not strongly associated with individual perceptions of inequality.
Literature Review
Economic inequality in the United States in the twenty-first century is extreme both compared with most other nations and over time (Keister and Lee 2014; Piketty and Saez 2014). Inequality, in terms of both income and wealth, has grown substantially in recent decades. In 1980, the top 1 percent of households’ share of income was about 10 percent. By 2015, it had more than doubled to 22 percent (Stone et al. 2018). Income inequality is now at levels not seen since the Gilded Age of the late nineteenth century (Acemoglu and Autor 2011; Piketty and Saez 2003). Recent economic crises, particularly the Great Recession and the ensuing the foreclosure crisis, made these inequalities strikingly visible, created distress and despair (Houle 2014; Houle and Light 2016), and may have stoked populist movements and mistrust against elites (Aslanidis 2016; Ross and Squires 2011). Scholars have long hypothesized that growing inequality is socially corrosive in that it undermines trust (Fairbrother and Martin 2013; Wilkinson and Pickett 2009), limits social mobility (Bradbury and Triest 2016), creates dissatisfaction with one’s economic position (Hastings 2019), and damages mental and physical well-being (Diez-Roux, Link, and Northridge 2000; Pickett and Wilkinson 2010, 2015). Although research on this topic has been mixed and generated debate (Beckfield 2004; Gelman, Kenworthy, and Su 2010; Henderson et al. 2004), one question that animates and underlies this work is how individuals respond and react to high and rising levels of income inequality.
Despite the evidence documenting the harmful consequences of extreme inequality and the seeming preference for redistribution in experimental settings (Gimpelson and Treisman 2015; Norton and Ariely 2011), surveys indicate that the U.S. public remains divided over inequality and what should be done about it. Prior research has largely focused on the individual-level correlates of perceptions about inequality. One of the most consistent findings within this body of research is support for what is known as the “underdog thesis,” or the idea that people who are disadvantaged in systems of inequality tend to perceive it more and support greater remediation (Cech 2017; Davis and Robinson 1991). People in lower social class positions, women, and people of color are more likely to express critical views of inequality and are more likely to favor redistributive government programs (McCall 2013). In an era of growing partisan polarization and heightened sorting of policy preferences by party identification (McCarty, Poole, and Rosenthal 2016; Mason 2018; Sides, Tesler, and Vavreck 2018), the two parties and their adherents have adopted highly divergent stances regarding inequality remediation. Democrats overwhelmingly favor government action to address inequality, while the majority of Republicans oppose it (Horowitz, Igielnik, and Kochhar 2020). Meanwhile, research has shown that perceptions and attitudes about social inequality have remained steady even in the face of rising income inequality at the national level (Breznau and Hommerich 2019; Kenworthy and McCall 2008; McCall and Kenworthy 2009; VanHeuvelen 2017; Wright 2018), raising questions about how and whether the broader social context influences individual’s attitudes toward social inequality.
How might social conditions in communities affect individual perspectives on inequality? Past psychological research has shown that people engage in “social-sampling processes” in their immediate social environments to draw inferences about how others are doing financially (Galesic, Olsson, and Rieskamp 2012; Dawtry, Sutton, and Sibley 2015). Using the heuristic of how people in their own social circles are doing, people tend to draw more sweeping conclusions about the level of inequality and the need for redistribution in society. Because people tend to be sorted by social class both socially and residentially, the social-sampling heuristic contributes to biased assessments of others’ economic circumstances and the extent of inequality. Wealthy people, for example, who reported higher levels of wealth in their social circles tended to overestimate the mean level of wealth in the United States and be more opposed to redistributive policies (Dawtry et al. 2015).
In recent decades, Americans are increasingly sorted into more racially, economically, and ideologically homogeneous communities (Bischoff and Reardon 2014; Intrator, Tannen, and Massey 2016; Sussell 2013). This “big sort” has occurred both through structural mechanisms that inhibit greater integration (e.g., discriminatory home-lending practices) and through simple homophily within social networks. As Keister (2018) wrote, “we tend to sort ourselves into smaller groups or cliques of similar others. As a result, we encounter a small slice of the population on most days and rarely see evidence of inequality” (p. 7). Sampling a small, homogeneous segment of society has potential consequences for inferences individuals draw about the need for inequality remediation.
Following this logic, living in a place with greater inequality and more signs of economic distress may increase the chances that respondents “sample” conditions from everyday life that might heighten their perception of the extent of inequality. Hastings (2019) found that individuals in U.S. states with greater inequality had lower satisfaction with their current financial situations, suggesting that people may formulate relative comparisons on the basis of local environments. Whether it is riding the subway with people across the class spectrum or having the oldest car at school drop-off in the morning, encountering the cultural manifestations of economic inequality ought to make people perceive it more. At a minimum, local contexts ought to add to a long list of considerations about inequality that individuals derive from a wide variety of sources.
Other research lends support to the theory of social sampling by showing that people’s perceptions of inequality and redistribution preferences are quite elastic in the face of exposure to information about inequality and economic mobility, changing economic conditions, and changes in individual material conditions. Several experiments suggest that exposure to inequality may shape individuals’ beliefs about inequality and what should be done about it (Chavanne 2018; Heiserman and Simpson 2017; Heiserman, Simpson, and Willer 2020; Kuziemko et al. 2015; McCall et al. 2017; Sands 2017). McCall et al. (2017), for example, found that introducing people to information about growing inequality made them more likely to attribute success and failure to structural explanations and motivated support for redistributive policies. By contrast, in a field experiment, Sands (2017) found that exposure to visibly poverty-stricken confederates decreased affluent participants’ support for redistribution. Other studies, using cross-national survey data, have shown that higher levels of income inequality harden individuals’ meritocratic beliefs (Mijs 2019) and increases tolerance for inequality (Schröder 2017). Changes in individuals’ economic circumstances, such as unemployment or a loss of income, can increase support for inequality remediation (Owens and Pedulla 2014). The elasticity of views in the face of changing circumstances and new information may be due in part to the fact that many Americans hold “weak nonattitudes” about how redistributive policies might benefit their own economic class group (MacDonald 2020). If many individuals do not hold strong, entrenched attitudes about inequality remediation, it would be unsurprising that when presented with either new information or changes in material conditions, they may change their minds.
These studies indicate that attitudes about inequality are not merely baked into to our identities and political commitments. Rather, they tend to suggest that the experiences we accumulate as we move through social environments contribute to our perceptions of inequality and support for redistribution. However, we still know little about how local conditions in communities affect attitudes about inequality. Recent research has shown that higher state-level inequality is associated with greater financial dissatisfaction (Hastings 2019) and greater social comparison in terms of happiness (Liao 2021), but many states may be too geographically expansive and residentially segregated for residents to notice the inequality within them. To the best of our knowledge, no study to date has explored the effects of local inequality on attitudes regarding inequality remediation using survey data.
Drawing on past work indicating that people draw inferences on the basis of social sampling of immediate environments (Dawtry et al. 2015; Galesic et al. 2012) and findings showing that exposure to inequality is associated with support for redistributive policies (Kuziemko et al. 2015; McCall et al. 2017), we hypothesize that among people in counties with higher levels of inequality (as measured by the Gini coefficient) and with more signs of economic distress (as measured by median income, unemployment rates, the percentage with college degrees, and rates of home foreclosures), there will be more support for government policies to address inequality (hypothesis 1). We expect that where inequality and economic distress are more visible, people will be more likely to perceive a need for redistribution. Despite our expectation, the work of Hastings (2019), in which state-level income inequality was negatively associated with financial satisfaction primarily for middle-income earners, might point toward a more nuanced outcome. It is possible that the effect of a county’s inequality on an individual’s support for redistribution is moderated by the individual’s own income. Thus, we conduct a supplemental analysis allowing for this possibility.
Apart from the economic conditions of a county, it is possible that the local political context could also affect one’s considerations regarding inequality. Democratic and Republican partisans tend to share their parties’ respective views on inequality and redistributive policies, with Democrats tending to favor greater redistribution of income. Likewise, net of party identification, more liberal people tend to more strongly favor government intervention to address inequality (Keister and Lee 2014; McCall 2013). But beyond individual political leanings, local political conditions may stir additional support for or opposition to redistributive policies. Given that Americans now live in more ideologically sorted communities (Bishop and Cushing 2008; Sussell 2013), it may be that being surrounded by more likeminded individuals reinforces political policy commitments. Over informal conversations at the coffee klatch or at family gatherings, living in a more Democratic-leaning community ought to provide individuals with more proredistribution considerations. Additionally, in communities where one party is more dominant, we would expect more issue advocacy by the local party and civil society groups as well as stronger party operations that draw attention to partisan considerations regarding inequality. Thus, we hypothesize that in counties with higher support for the Democratic presidential candidate, there will be more support for government policies to address inequality (hypothesis 2).
Finally, local racial composition may affect considerations regarding inequality. Nationally, political rhetoric regarding economic redistribution and welfare state spending is often racialized (Edsall and Edsall 1991; Logan 2011; McCall 2013; Mettler 2011; Piston 2018; Winter 2006). Republicans, at least as far back as the Reagan administration, have campaigned in strict opposition to the expansion of the welfare state and redistributive policies, often deploying racially coded language that identifies the non-White beneficiaries of redistribution as “the undeserving poor” (Edsall and Edsall 1991; Mettler 2011; Piston 2018). Unsurprisingly then, at the individual level, White people are less supportive of welfare state spending and economic redistribution than Black people and other non-White people (McCall 2013; Piston 2018).
But how does the racial composition and the level of racial segregation of one’s community affect attitudes about government intervention to address income inequality? As the United States has sorted into more ideologically homogeneous communities, racial segregation has largely persisted in much of the country because of housing preferences, disparities in access to credit, and discriminatory real estate practices (Billingham and Hunt 2016; Emerson, Chai, and Yancey 2001; Intrator et al. 2016; Massey and Tannen 2017). Following our previous logic, we suspect that in more segregated communities, people with have fewer contacts with members of other racial groups and, therefore, tend to view the poor more sympathetically, an attitude that is less likely to be extended to members of racial out-groups (Piston 2018; Reeskens and van Oorschot 2012; Nosek, Banaji, and Greenwald 2002). Ironically then, increased racial segregation may have the effect of increasing support for redistribution as people see those around them as more deserving of government intervention. In other words, the homogeneity in racially segregated communities creates more opportunities for people to gather proredistribution considerations. Consequently, we hypothesize that in counties with higher levels of racial segregation (as measured by the dissimilarity index), there will be more support for government policies to address inequality (hypothesis 3). As with our first hypothesis, there is a strong possibility that the individuals’ race moderates the relationship between county segregation and support for inequality remediation. We include interaction models to test for this possibility.
The Present Study
In this study we explore how county-level economic inequality, political composition, and racial segregation are associated with individual attitudes about inequality remediation. We do so by examining between-county differences, pooled from multiple years of the GSS from 2006 to 2012. We also examine the profound consequences of the Great Recession by examining the effects of within-county changes of several key variables on inequality remediation. The Great Recession was a period of sweeping economic changes. Given past research documenting the elasticity of Americans’ views on inequality remediation, perhaps it is not the absolute levels of inequality and segregation in a community that matter but the relative change over time that shapes individuals’ thinking about inequality remediation. To assess this possibility, we also examine the extent to which changes in economic conditions, racial segregation, and political composition from 2006 to 2012 are associated with support for individual remediation. To assess potential moderated relationships between individual characteristics and county-level conditions, we include in an online supplement the results of several interaction models. Taken together, these results contribute to the existing literature by offering the first survey evidence regarding whether social and economic conditions in local contexts inform individuals’ considerations about inequality remediation.
Data and Methods
Data
Data from this study are drawn from three main individual and county-level data sources. Individual-level data are from the GSS. The GSS is a nationally representative repeated cross-section of U.S. adults (Smith et al. 2016). We use restricted data with geographic-level identifiers and pool data from the 2006 (n = 4,510), 2008 (n = 2,023), 2010 (n = 2,044), and 2012 (n = 1,974) survey waves (total n = 10,551). We excluded panel respondents who had repeated observations throughout this period of the GSS. We also limit our sample to respondents who were asked questions about their perceptions of social inequality (respondents who were randomly assigned GSS ballot B or C) in 2006 (n = 1,989), 2008 (n = 1,365), 2010 (n = 1,377), and 2012 (n = 1,338), for a total sample size of 5,988. 2 After accounting for missing data on all study variables, our final sample size is 5,733 respondents. 3
Contextual data are primarily from the five-year American Community Survey (ACS) county-level files. These data were extracted via Social Explorer (www.socialexplorer.com). The ACS county-level estimates are aggregated from an annual nationally representative survey of approximately 3 million U.S. households, conducted by the U.S. Census Bureau. Response to the ACS is required by law, thus ensuring very high response rates (approximately 98 percent) (U.S. Census Bureau 2013). To increase reliability of the measures, county-level indicators are averaged over five years by the ACS. To capture local county-level social and economic conditions experienced by GSS respondents from 2006 to 2012, we average county-level variables from the ACS across four five-year periods: 2005 to 2009, 2006 to 2010, 2007 to 2011, and 2008 to 2012. We also draw on county-level presidential election data from 2012 and 2016 that were published by The Guardian and Townhall.com and are available on GitHub (McGovern 2018).
Variables
Support for Inequality Remediation
The dependent measure for this study is the GSS variable eqwlth, which prompts respondents with the following question: Some people think that the government in Washington ought to reduce the income differences between the rich and the poor, perhaps by raising the taxes of wealthy families or by giving income assistance to the poor. Others think that the government should not concern itself with reducing this income difference between the rich and the poor. Here is a card with a scale from 1 to 7. Think of a score of 1 as meaning that the government ought to reduce the income differences between rich and poor, and a score of 7 meaning that the government should not concern itself with reducing income differences. What score between 1 and 7 comes closest to the way you feel?
We reverse-coded the measure such that 1 indicates the least support for inequality remediation and 7 represents the greatest support.
Local (County) Economic and Social Conditions
We measure local social and economic conditions with an array of variables that are theoretically germane for respondents’ perceptions of social inequality. Economic inequality is measured using a rescaled version of the Gini coefficient, which broadly indicates the level of income inequality in a county (where 0 indicates perfect equality of income and 100 indicates perfect inequality of income). Racial and ethnic segregation and composition is measured with the index of dissimilarity, which indicates the separation of racial groups within a county (Iceland 2009). This measure was calculated for the respective proportions of Black people and White people at the census tract level (relative to the county as a whole) and then aggregated to the county level. We also measure racial and ethnic diversity with two additional measures: the percentage of the population that is non-Hispanic Black and the percentage of the population that is foreign born. We measure local socioeconomic context with three measures: the percentage of the population that is unemployed in the county, the median household income (in $10,000), and the percentage of the population that has a college degree or more. Political context is measured by the (average) percentage of the population that voted for Obama in 2008 and 2012. We also adjust for population density and region (1 = county is in the South, 0 = not) in all models.
Individual-Level Covariates
We account for a variety of individual-level factors that previous research indicates are strongly predictive of perceptions of inequality and may confound the association between local context and inequality perceptions (Cech 2017; Davis and Robinson 1991; Kenworthy and McCall 2008; Kluegel and Smith 1986; McCall 2013; McCall and Kenworthy 2009). These include gender (1 = woman, 0 = man), race (White [referent], Black, other race), age in years, total household income, employment status (employed full-time [referent], part-time employed, unemployed, not in labor force), and educational attainment (less than high school [referent], high school degree, some college, four-year college or more). Following McCall (2013), we measure political ideology and affiliation with two measures. Political ideology indicates whether individuals think of themselves as liberal, moderate [referent], or conservative. Political affiliation is measured via party identification (Republican, Democratic [referent], independent, or other party). Finally, all models include year dummies for the year respondents were interviewed for the GSS (2006 [referent], 2008, 2010, or 2012). These year fixed effects essentially capture all national between-county time trends.
Analytic Strategy
We use hierarchical linear models (HLMs) to estimate the association between the local context and individual’s perceptions about inequality. Hierarchical modeling techniques are preferred to ordinary least squares when dealing with multilevel (e.g., nested) data because they can better deal with shared variance and nonindependence with grouped data (Raudenbush and Bryk 2012). In our specific case, HLMs can correct for the fact that individuals (level 1) clustered within counties (level 2) are more similar than individuals in different counties than we would expect because of random chance. HLMs also allow us to decompose the variance in Y (inequality perceptions) into county-level (level 2) and individual-level (level 1) components. The multilevel model can be reduced to the following equation:
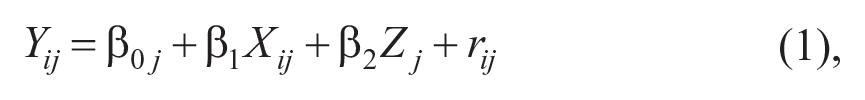
where Y is the predicted outcome variable (inequality perceptions for individual i in county j, β0j is the model intercept in county j, Xij is an individual-level characteristic (such as age or employment status) for individual i in county j, and Zj is a county-level (level 2) predictor, such as economic inequality. rij is the random error associated with respondent i in county j. All models also include year fixed effects (dummy variables for each year), which account for all national-level time trends that are stable across counties. We estimate random intercept models and adjust our standard errors for intracluster correlation within counties. For the full model, the maximum variance inflation factor is 5.01, and the average variance inflation factor is 1.91, well below the conventional benchmark for multicollinearity concerns of 10. All models are estimated in Stata 15.0 (StataCorp, College Station, TX) using the “mixed” command.
Results
We begin by presenting descriptive statistics for all study variables in Table 1. The first column displays univariate descriptive statistics for the full sample, while the second and third columns show descriptive statistics stratified by whether individuals reported fully supporting government intervention to reduce inequality or fully opposing it. A few key patterns are worth highlighting. First, replicating prior research (Davis and Robinson 1991; Kenworthy and McCall 2008; Kluegel and Smith 1986; McCall 2013; McCall and Kenworthy 2009), we find that individual-level characteristics are associated with inequality attitudes, including race, political party and beliefs, socioeconomic status, sex, and age. Second, at a national level, respondents were least supportive of government intervention in 2010, at the height of the Great Recession, a finding that aligns with prior research (Brooks and Manza 2013; McCall 2013; Weakliem 2018). Finally, we find that there is significant variation in inequality remediation attitudes across different types of counties, as measured by the variables in this study. Respondents who believe that the government should take action to reduce inequality live, on average, in counties that have lower median incomes, are slightly more unequal, have more unemployment, have larger proportions of Black people, are more segregated, are more liberal (as measured by percentage of the population that voted for Obama), are more urban, and are less educated. This suggests that there is at least some variation in inequality attitudes across U.S. counties, though it is not clear whether this variation reflects differences in the composition of the individuals who live in these counties, or contextual differences that may sway the attitudes of those who live in these counties. To test whether county-level characteristics are associated with inequality attitudes net of individual-level characteristics, we turn to the results from multivariate hierarchical linear models.
Descriptive Statistics.

Note: n = 5,733 individuals nested in 336 counties. Standard errors are in parentheses.
p < .05. **p < .01. ***p < .001.
Before asking the extent to which county-level social and economic conditions are associated with inequality attitudes, we first must ask how much variation in inequality attitudes exist at the county level. On the basis of the variance components from a null multilevel model that includes only the dependent variable, we find that approximately 2.6 percent of the total variance in inequality attitudes is at the county level. Thus, although the majority of the variance in inequality attitudes is likely to be explained by individual-level characteristics, there is significant variation across counties.
In Table 2, we show results from hierarchical linear models that estimate the association between inequality attitudes, county-level social and economic conditions, and individual-level characteristics. In model 1, we include only county-level characteristics. In model 2, we add individual-level characteristics. In model 3, we add year fixed effects, to account for all between-county national time trends that may be associated with attitudes about inequality remediation. Finally, in model 4, we add a county-level measure of the average percentage vote share for Obama in 2008 and 2012. We also reference models that test for moderation, which are available in an online supplement.
Hierarchical Linear Modeling Estimates Predicting Inequality Remediation Attitudes, 2006 to 2012.

Note: n = 5,733 individuals nested in 336 counties. Standard errors are in parentheses.
p < .10. *p < .05. **p < .01. ***p < .001.
Across all models, we find little support for the notion that county social and economic conditions are associated with inequality remediation attitudes. Neither county-level inequality (as measured by the Gini coefficient) nor the extent of racial segregation (as measured by dissimilarity index) nor income and racial composition measures affect attitudes about inequality remediation, net of individual-level characteristics. Regardless of whether we include controls for individual-level characteristics or year fixed effects, only two county-level characteristics are significantly associated at standard α levels with inequality remediation attitudes: the rate of home foreclosures and the percentage of county residents that voted for Obama in 2008 and 2012. In model 4, a 1 percentage point increase in county support for Obama is associated with a .008-point increase in inequality remediation attitudes. That is, controlling for individual-level characteristics, individuals who live in more liberal counties are more likely to support government intervention to reduce inequality than those who live in less liberal counties. Although statistically significant, this is a substantively small association. All else equal, we would predict that a respondent who lived in a county where 25 percent of the residents voted for Obama would score about .2 points lower on a 7-point scale of inequality remediation than a respondent who lives in a county with a 50 percent Obama vote share.
Across all four models, the county rate of home foreclosures is negatively associated with support for inequality remediation, the opposite of the hypothesized direction. In model 4, for each 1 percentage point increase in the county foreclosure rate, there is a .065 decrease in support for inequality remediation. However, we would caution that this is a relatively small association. All else equal, the model predicts that individuals who reside in counties with no foreclosures (0 percent) report, on average, a 4.3 on the measure of inequality remediation, while those who reside in counties with the highest foreclosure rates (5 percent) report a 4.03, a difference of about one third of a point on a 7-point scale.
If county-level social and economic conditions are not highly predictive of remediation attitudes, than what is? Broadly, we find that individuals’ racial identification, sex, socioeconomic status, and age are predictive of remediation attitudes, net of county-level characteristics and year fixed effects. Similar to prior research (Davis and Robinson 1991; Kluegel and Smith 1986), we find broad support for the “underdog thesis,” such that those groups who have direct experience with social disadvantage—because of their position in the racial, gender, or class hierarchy—are more likely to support intervention to reduce inequality than those in more advantaged positions. As McCall and her colleagues have found (Kenworthy and McCall 2008; McCall 2013; McCall and Kenworthy 2009), we find particularly strong effects of individuals’ political ideology and partisan identity on remediation attitudes, net of county-level characteristics and year fixed effects.
We do find that differences across survey years are relatively large, suggesting that national-level factors may play an important role in shaping attitudes toward inequality remediation. For example, respondents who were interviewed in 2010 were substantially less likely to support government intervention to reduce inequality, even after adjusting for all individual and contextual level variables. The difference in inequality remediation attitudes between 2006 and 2010 is about as large as the difference in remediation attitudes between liberals and moderates and substantially larger than the difference between men and women.
Thus far we find that county-level social and economic conditions are not generally associated with individuals’ desire to remediate social inequality. But there are some unanswered questions that merit further investigation. The first is about changes in local conditions: whether people tend to feel differently about inequality if they live in counties that experienced rapid changes in social and economic conditions over the study period, that is, if the county became more or less unequal or more or less economically distressed. This is particularly important to consider given that our respondents were observed during the Great Recession, a period of immense social and economic upheaval that was experienced unequally across counties. Unfortunately, we cannot examine annual or yearly changes in local conditions because county-level estimates from the ACS are averaged over five-year intervals.
What we can do, however, is examine whether changes in county conditions from the first five-year interval (2005–2009) to the last five-year interval (2008–2012) are associated with attitudes about inequality remediation. 4 In Table 3, we show results from hierarchical linear models, which incorporate the percentage-change variables. Model 1 includes only county-level variables, while model 2 incorporates individual-level characteristics, Model 3 adds year dummy variables, and Model 4 adds the percentage Obama vote measure. Across all of these models, the main effects are largely unchanged from Table 2. Neither the percentage change in county income inequality nor percentage change in dissimilarity index are significantly associated with inequality remediation attitudes. Although the county foreclosure rate was significantly associated with inequality remediation attitudes in previous models, the percentage change in foreclosure rate is nonsignificant in all models. Moreover, in model 4, when accounting for all factors, including the percentage changes, the foreclosure rate is no longer significantly associated with support inequality remediation. As in the previous models, individual-level characteristics account for much more of variation in inequality remediation attitudes. In sum, we find no support for the notion that individuals who lived in counties that experienced more social and economic change were any more likely to support government intervention for reducing inequality.
Hierarchical Linear Modeling Estimates Predicting Inequality Remediation Attitudes with Percentage Change Measures, 2006 to 2012.

Note: n = 5,733 individuals nested in 336 counties. Standard errors in parentheses.
p < .10. *p < .05. **p < .01. ***p < .001.
Another potential shortcoming of our analysis is that it may not adequately capture the association between local conditions and inequality perceptions if there is heterogeneity in the association across different social groups. For example, if racial segregation was associated with more desire for redistribution among Black people, but less desire for redistribution among White people, these countervailing effects may cancel each other out in the aggregate. To examine this possibility, in an online appendix (see Online Supplement Tables 1–3), we include the results of models with three different interaction terms: respondent’s income × Gini coefficient, respondent’s race × Gini coefficient, and respondent’s race × index of dissimilarity (the measure of segregation). Regardless of whether we include individual-level controls or year fixed effects, none of the interactions were statistically significant at conventional levels, and the coefficients are close to zero. These findings suggest that not only were the main effects of county inequality and segregation on inequality remediation support nonsignificant, but there was also no evidence of a moderated relationship, in which one racial group or income category was uniquely affected by county-level conditions in their views on inequality remediation.
Discussion
As Figure 1 illustrates, over the past 40 years, despite rising inequality in the United States, public opinion for greater government intervention to address it has not grown consistently. Likewise, in this study, contrary to our hypotheses, we find no evidence that individuals in counties with greater inequality or particularly rapidly increasing inequality are more likely to favor action. Although with effects of minuscule magnitude, the only county-level conditions associated with greater support for inequality remediation are the rate of foreclosures and the average vote share for Obama in 2008 and 2012. Rather, individual-level factors, particularly political ideology and partisan identity, are far more strongly associated with inequality remediation attitudes.
On the face of it, these findings run contrary to some research indicating that exposure to inequality in vignettes (Chavanne 2018; Heiserman and Simpson 2017; McCall et al. 2017) or field experiments (Sands 2017) increases structural explanations for inequality and support for redistribution. But there is a difference between brief exposure to a novel experimental condition and observing inequality within the natural setting of one’s own community. The better parallel to the current research is Hastings’s (2019) survey research showing that higher state-level inequality is linked with greater financial dissatisfaction. One reason for seeming disparity between those findings and ours is that the mechanisms that contribute to the formation of abstract policy opinions may be different from those for sizing up one’s financial situation. In other words, it is possible that although local inequalities inform an individual’s sense of their current financial well-being, more enduring characteristics (e.g., race, gender, and social class) as well as mass media and political discourse inform attitudes about policy to address inequality.
The largely null findings of this study also raise a deeper puzzle of how forms of inequality become visible to people. Most people are not regularly monitoring their county’s Gini coefficient or even looking at one another’s paychecks with any frequency. The findings here suggest that county-level inequality and segregation are not, in and of themselves, enough to move the needle on attitudes regarding inequality remediation. Contrary to expectations, county rates of foreclosures were negatively, albeit weakly, associated with support for inequality remediation.
One potential explanation for the very limited local effects in this study may be that the dependent variable specifically asks about “the government in Washington.” This question wording, which emphasizes the role of the federal government, may well have lead respondents to focus on national conditions rather than local circumstances. Drawing attention to the federal government may also help explain the large turn against inequality remediation in 2010 as the public grew frustrated an inadequate national response to the Great Recession.
Future research might compare visible and invisible forms of inequality within communities. Additionally, the very question of what constitutes a “community” is worthy of further study. This research examined counties, but perhaps metropolitan areas, towns, or even neighborhoods are the places where inequalities are most visible to people. Indeed, the basic geographic unit at which individuals can observe inequality may vary widely across various parts of the United States with distinct degrees of density and mobility. With a measure that specifically asked about local governments, respondents’ might have turned their attention to their social sampling of local conditions to a greater extent.
Another possibility is that individuals do not formulate policy positions purely on the basis of their sampling of local conditions but by drawing a comparison between the local social and economic context and their perception of the national one. Measuring the relative difference between county and larger geographic units is beyond the scope of this article, but it is possible that people consider how their county is doing relative to the state, region, or nation.
Still, this research does not directly measure whether people notice inequality. Instead, we examine their policy preferences regarding government intervention to address inequality. The findings of this study do offer some indication that local political context may shape individual attitudes about inequality remediation. Our findings did reveal a small but consistent effect of being in a more liberal county on inequality remediation attitudes, net of individual factors. That could be because being a “strong Democrat” in New York City means something a tad more progressive than being a “strong Democrat” in rural Alabama. But it may also reflect local organizing efforts, more union mobilization, or other factors otherwise unmeasured in the model.
Although local contextual effects are the primary focus of this article, the best predictors of inequality remediation are individual-level political ideology and partisanship. A great deal of research has documented the growing partisan divide in the United States and the increasingly tidy sorting of policy preferences by political party (McCarty et al. 2016; Mason 2018; Sides et al. 2018). Government action to address inequality is not exception to this general rule, with Democrats and Republicans quite divided (Horowitz et al. 2020). One reasonable interpretation of the findings of this study is that nationalized politics may swamp many other considerations. That is, even if people observe inequality locally, they may formulate their policy prescriptions nationally, drawing on the talking points of cable news pundits and online news stories from national outlets.
In closing, it is worth further contextualizing our findings in light of the rapidly evolving coronavirus crisis. This research is a study of inequality remediation attitudes in the era of the Great Recession. As we write, we are in the midst of a pandemic, in which inequality is fast increasing nationwide (Scheidel 2020; Quart and Serkez 2020). Ironically, physical distancing means many people are not seeing anything of their own communities but are drawing cues from the media. Initial survey evidence indicates a growing sense of solidarity alongside increased tolerance for inequality (Cappelen et al. 2020). Depending on how reopenings occur, people will, at some point, have the chance to observe the consequences of the pandemic firsthand. But the results of this study suggest that how individuals view government intervention to address inequality is more strongly associated with their individual characteristics than what they are seeing in their communities.
Supplemental Material
sj-docx-1-srd-10.1177_23780231211009990 – Supplemental material for Are All Politics National? County-Level Social Contexts and Inequality Remediation Attitudes, 2006 to 2012
Supplemental material, sj-docx-1-srd-10.1177_23780231211009990 for Are All Politics National? County-Level Social Contexts and Inequality Remediation Attitudes, 2006 to 2012 by Andrew M. Lindner and Jason N. Houle in Socius
Footnotes
Supplemental Material
Supplemental material for this article is available online.
Notes
Author Biographies
References
Supplementary Material
Please find the following supplemental material available below.
For Open Access articles published under a Creative Commons License, all supplemental material carries the same license as the article it is associated with.
For non-Open Access articles published, all supplemental material carries a non-exclusive license, and permission requests for re-use of supplemental material or any part of supplemental material shall be sent directly to the copyright owner as specified in the copyright notice associated with the article.