
Abstract
The coronavirus pandemic precipitated an economic crisis disproportionately affecting renter households. Attempting to prevent a surge in evictions, policy makers at the federal, state, and local levels extended emergency protections to renters. The authors describe eviction filing patterns in 2020 and analyze the efficacy of eviction moratoria. New filings were reduced dramatically since the start of the pandemic. Between March 15 and December 31, 2020, across sites for which data are available, 65 percent fewer eviction cases were filed than would be expected in a typical year. Extrapolating nationwide, the authors estimate that at least 1.55 million fewer eviction cases were filed in 2020 than in a normal year. The pace at which cases were filed increased in late 2020, however, and the amount of back rent claimed grew considerably. Filing rates exceeded historical averages when protections lapsed. Black and female renters received a disproportionate share of eviction cases filed during the pandemic.
The coronavirus (COVID-19) pandemic precipitated an economic crisis in the United States that, as a function of the sectors most severely affected, has had a disproportionate impact on renter households (Airgood-Obrycki and Hermann 2021; Kneebone and Murray 2020). As concern grew that job losses might put a growing number of families at risk for eviction, and recognizing that a spike in evictions would likely exacerbate the spread of COVID-19 (Benfer et al. 2021; Leifheit et al. 2020; Nande et al. 2021), policy makers at the federal, state, and local levels initiated an unprecedented array of interventions intended to support residential stability, including temporary eviction moratoria. These policies varied considerably in terms of what protections were afforded, to whom, and for what duration (Benfer et al. 2021), but at least initially, they shared a common goal: to prevent housing instability during the public health emergency.
This article offers a snapshot of eviction filing patterns in 2020 and a first description of the efficacy of these interventions. We show that new eviction filings were reduced dramatically since the start of the pandemic. Between March 15 and December 31, 2020, across the sites for which we have data, 65 percent fewer eviction cases were filed than would be expected in a typical year. Extrapolating across the country, we estimate that at least 1.55 million fewer eviction cases were filed in 2020 than in a normal year. However, the pace at which eviction cases were filed increased over the second half of 2020, and the amount of back rent claimed by landlords grew considerably. Consistent with prepandemic trends, Black and female renters received a disproportionate share of these filings.
Data
Our analysis relies on the records of eviction cases filed in civil courts across the United States, as well as data on eviction moratoria at the state, county, and municipal levels (Benfer, Koehler et al. 2020). Court record data were collected through the Eviction Tracking System (ETS), a tool we developed in response to the COVID-19 pandemic (Hepburn, Louis, and Desmond 2020a). Until the ETS was launched in June 2020, the United States had no data infrastructure that allowed policy makers, journalists, social service providers, community members, and researchers to track eviction filings in real time. Household mobility data are typically available only with a one- to two-year lag; the federal government does not collect eviction data; and no state reports eviction statistics on a regular, ongoing basis.
The ETS was designed to address this critical gap by collecting case-level data on eviction filings from courts’ online record systems. Through the ETS, we observe case numbers, filing dates, plaintiff and defendant names, and addresses associated with eviction filings. 1 In a number of sites we collect additional data, including the amounts of back rent claimed by landlords in their filings. We clean the data, removing duplicate cases and filings against commercial defendants, geocode addresses and associate them with census tracts, and produce weekly counts that feed into the ETS Web site (https://evictionlab.org/eviction-tracking/), where we also make aggregate data publicly available for download.
As of the end of 2020, the ETS had collected data from 32 court systems: 5 at the state level (covering 305 counties or county equivalents), 26 at the county level, and 1 at the municipal level. This represents a purposive sample of court systems that met two inclusion criteria. First, the court must make the necessary data available. In most sites, these data were collected from public court Web sites, though in several cases courts share data with us directly (e.g., Maricopa County, Arizona). Not all courts have online records systems that allowed us to scrape the necessary data. Many have no online presence whatsoever, paywalls and other forms of restricted access are common, and few courts proactively shared data. Second, we must have historical data on eviction filings in the site. Historical data allowed us to establish a baseline of what eviction filings in a given week or month look like in a typical year. These data were either taken from the Eviction Lab’s national database (Desmond et al. 2018) or collected directly from the court systems. 2 We selected sites to maximize variation across geographic regions, historical eviction patterns, and policy responses to the pandemic. To allow controls on state-level housing policies, we favored adding court systems within the same state. To maximize coverage, we targeted data collection to the largest county or counties in a given metropolitan area.
Table 1 provides a detailed description of ETS coverage. Starting from the state level, we identify the jurisdictions from which we collected data, indicating region of the country, whether ETS coverage was complete or partial for the given state, and whether there was a consistent state-level response to the pandemic. If state-level ETS coverage was incomplete or pandemic response inconsistent, we list key municipal or county jurisdictions. We provide, either for the complete state or the smaller jurisdiction, the historical baseline eviction filing rate, the renter population, the filing fee for an eviction case, and the notice period (if any) that landlords are required to provide tenants prior to filing a case with the court. Using data gathered by Benfer, Koehler et al. (2020), we indicate the earliest state of the eviction process that was halted under the most restrictive state- or county-level eviction moratorium put in place in the jurisdiction, the dates during which these protections were in place, and a listing of any additional protections afforded. We provide additional information in Appendix Table A1.
ETS Sample Characteristics.

Note: ETS = Eviction Tracking System; MW = Midwest; NE = Northeast; S = South; W = West.
As Table 1 demonstrates, the ETS provides coverage of a wide variety of jurisdictions. Charleston County, South Carolina, is southern, relatively small, and, thanks to a low filing fee and limited notice requirements, a site of many eviction filings under normal circumstances (historical filing rate of 24.5 percent). By contrast, Boston is northern, is larger, makes eviction relatively more onerous for property managers, and has a much lower baseline filing rate (2.6 percent). We caution that our sample is not designed to provide robust generalizability to the rest of the country. Notably, coverage of western jurisdictions is limited to Maricopa, Arizona, and we do not have coverage of a major jurisdiction that failed to implement any eviction moratorium.
With that being said, the ETS does resemble the nation as a whole in terms of sociodemographic composition and housing market characteristics (Table 2). The United States has 43.5 million renter households; 9 million of those households—approximately one in every five—are in areas covered by the ETS. Median rent in ETS sites is nearly identical to the national average ($1,131 vs. $1,122), and the poverty rates in covered areas are slightly above average. ETS sites include more Black and Latinx renting household heads, and fewer who are white or of some other race/ethnicity. Prepandemic eviction filing rates—the number of eviction filings in a given area divided by its number of renter households—in ETS sites are slightly below the national average.
ETS Sites in Comparison with the United States.

Note: With the exception of the first row, all estimates are means weighted by the number of renting households at the county level. Standard errors were calculated using the margin of error provided by the Census Bureau for the American Community Survey. The estimate of U.S. eviction filing rate is based on a national estimate of 3.7 million total eviction filings in 2016 (Desmond 2020), divided by the count of U.S. renter households. ETS = Eviction Tracking System; HH = household.
Findings
Do Eviction Moratoria Work?
Federal, state, and local eviction moratoria were designed to reduce residential instability during the COVID-19 pandemic. However, many laws, particularly housing laws, are notoriously difficult to administer or are underenforced (Kushner 1988; Massey 2015; Sabbeth 2019). Few of the emergency eviction-related policies enacted in 2020 had clear enforcement mechanisms, and all were applied during a period of policy confusion, when entrenched procedures often prevail (Stark 2014). Policies also varied considerably in the protections they afforded renters (Benfer, Alexander, et al. 2020; Benfer et al. 2021). Data drawn from the ETS allow us to begin to evaluate the efficacy of various approaches to moratoria and the consequences of policy design decisions.
Between March 15 and December 31 of a typical year, we would expect to see 594,731 eviction filings across the ETS sites. In 2020, we observed 208,563 filings, or roughly 65 percent fewer than normal. In Figure 1, we plot total weekly eviction filings as a percentage of historical average over the course of the year. For nearly every week since the pandemic began, filings were far below average.
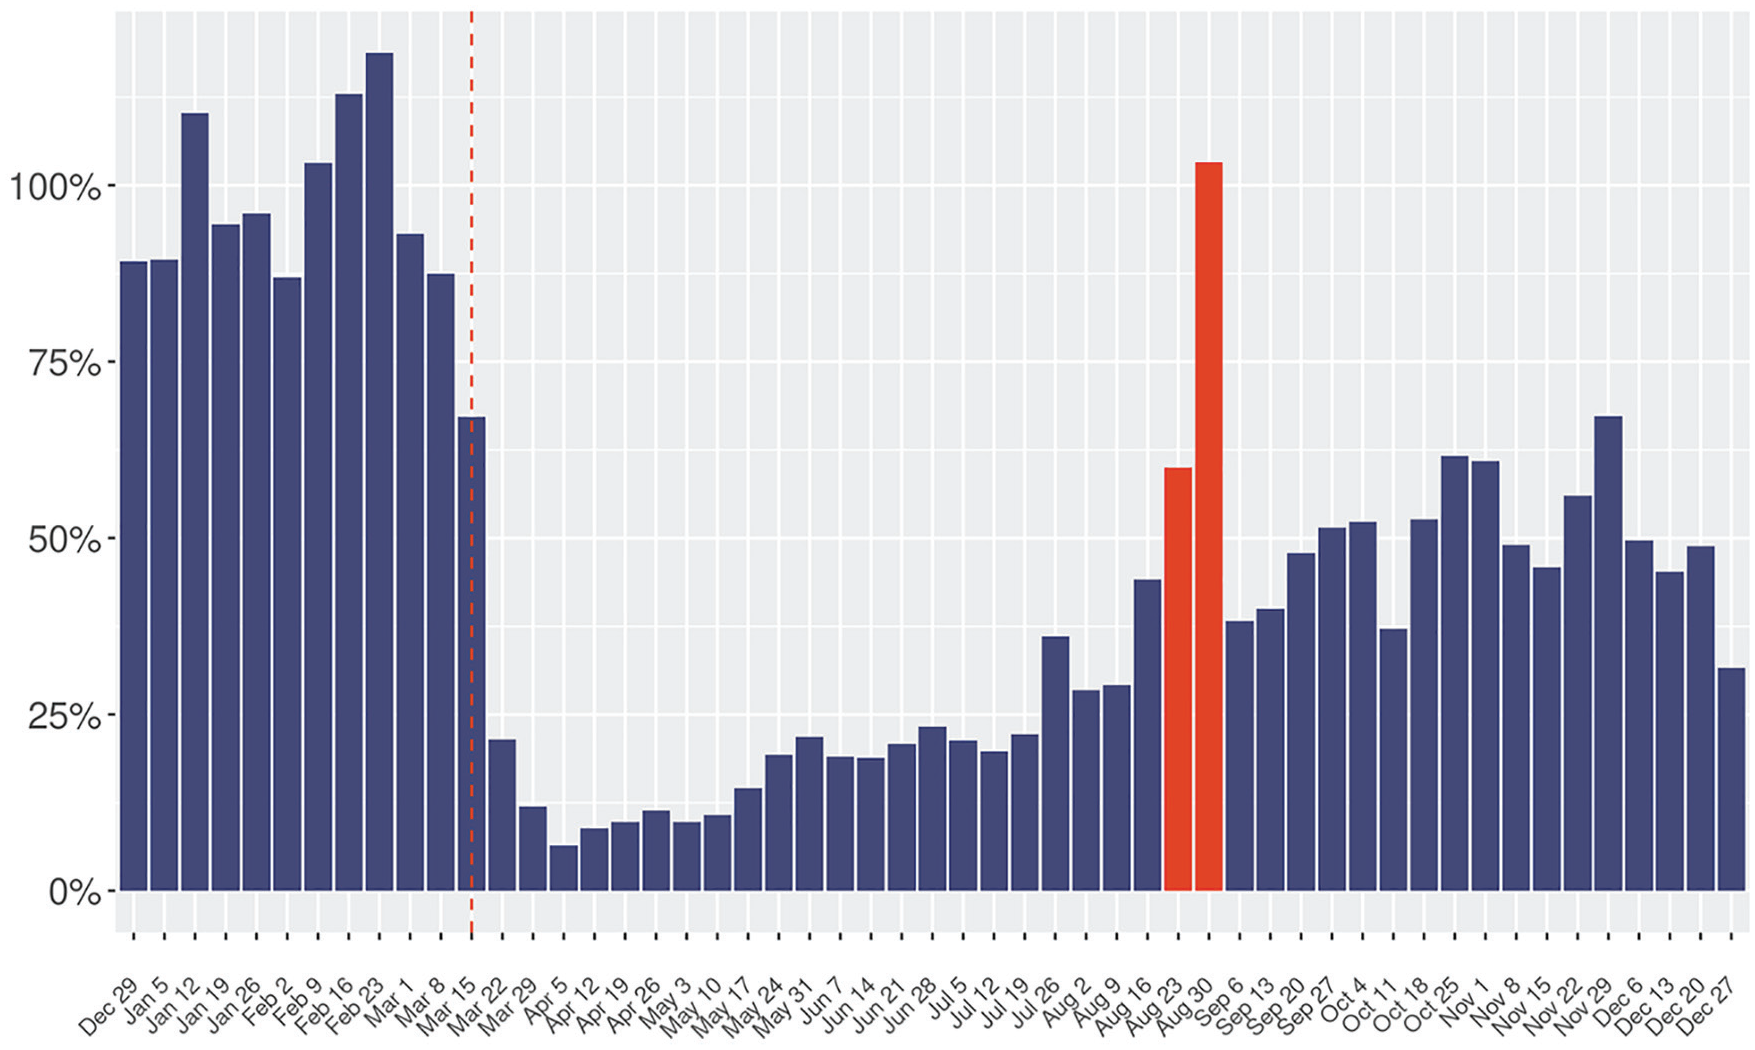
Weekly eviction filings in Eviction Tracking System sites relative to historical average.
The reduction in eviction filings can be understood as a measure of the overall effect of eviction moratoria at the local, state, and federal levels, as well as Coronavirus Aid, Relief, and Economic Security (CARES) Act stimulus payments, limited supportive measures (e.g., rental assistance), the expansion of unemployment benefits, and, in several cases, closures of the courts that created effective halts on all eviction proceedings. Although we cannot assess the relative importance of each of these items independently, ETS data offer several suggestive pieces of evidence.
First, federal eviction moratoria appear important in reducing eviction filings. Over the course of the year, two such moratoria were implemented: the first as part of the CARES Act and the second ordered by the Centers for Disease Control and Prevention (CDC). The former restricted eviction filings against renters in properties that had federally backed mortgages or some form of federal assistance. This limited protections to approximately one third of all renter households (Stein and Sutaria 2020) and, in practice, required tenants to identify eligibility for protection unless states required affidavits of compliance from landlords prior to initiating an eviction. By contrast, the CDC moratorium restricted the execution of evictions—though not the filing of nonpayment of rent eviction cases—against tenants who provided a declaration in order to qualify for protections. These two moratoria were nonoverlapping, and state interpretation, adoption, and implementation varied widely (Benfer et al. 2021; Ernsthausen, Simani, and Elliott 2020). CARES Act protections were written such that landlords at covered properties could begin to file against tenants starting the week of August 23, while the CDC eviction moratorium did not go into effect until September 4, 2020.
In Figure 1, we see the effect of this gap in coverage in the two weeks marked in orange: a dramatic increase in case filings during the weeks of August 23 and August 30. In no other week since the start of the pandemic did we observe filings above 68 percent of the historical average. For the week of August 30, case filings returned to prepandemic levels. These numbers were, in fact, skewed downward by sites with state or local eviction moratoria still in effect during the gap in federal protections. When we limit to sites without such measures in place at the time, filings for the week of August 30 were 12 percent above historical average. 3 This increase suggests a substantial pent-up “demand” for eviction filings among landlords.
State and local eviction moratoria have also reduced eviction filings. At the outset of the pandemic, many cities, counties, and states across the country adopted moratoria, some of which exceeded protections offered by the federal government. These policies varied in which tenants were protected, what types of evictions were forestalled, what steps of the eviction process were halted, under what conditions, and for how long (Benfer, Alexander, et al. 2020; Benfer et al. 2021). The formal eviction process can generally be categorized in five stages:
The landlord provides notice to the tenant of the intention to evict, 4
the landlord files an eviction case in court,
the court holds a hearing,
the judge issues a judgment and orders a writ of possession, and
the sheriff or a third party executes the writ of possession and removes the tenant.
In some jurisdictions, only the final stage of the eviction process was halted: courts held hearings and even handed down eviction orders but did not allow sheriffs to enforce the orders of eviction. The most protective moratoria suspended all stages of eviction, followed by those that stopped the initiation of the eviction process (i.e., notice and filing). Nationwide, only four states froze all stages of eviction at some point; the notice and filing stages of eviction were frozen in 40.9 percent and 54.5 percent of moratoria, respectively (Benfer et al. 2021). Halting the earliest stages of the eviction process is particularly important in minimizing displacement because many tenants never make it to court, electing to move when they are filed against (Desmond 2016; Hartman and Robinson 2003). Halting filings also helps tenants avoid the durable negative consequences that court records have on credit reports and the ability to find future housing (Garboden and Rosen 2019; Kimble 2020; Leung, Hepburn, and Desmond 2020; Swenson 2021)
When state and local moratoria were in place, eviction filings were well below historical average. In Figure 2, we compare eviction filings during the effective dates of moratoria in a subset of cities covered by the ETS with eviction filings for the same dates and locations in previous years. We restrict our sample to cities for which we have confirmed data about state and local measures. 5 We split the figure into four panels, grouping cities according to the earliest stage of the eviction process that was suspended under the most restrictive applicable state, county, or city moratorium. All of these moratoria coincided with CARES Act protections, and we mark with an asterisk those jurisdictions in which moratoria overlapped with the CDC order (see Table 1 for additional detail).

Eviction filings during the local moratorium period, relative to historical average for the same period.
In many cities, state or local moratoria temporarily cut eviction filings to zero (or near zero). This is especially true of sites that suspended the first and second stages of the eviction process: notice and filings. In these cities, new eviction filings were at or below 12.6 percent of the historical average while their moratoria were in place. In Cleveland, for instance, the courts accepted only “emergency action” eviction filings when the local moratorium was in place. 6 They handled 148 new eviction filings between March 16 and June 15, compared with 1,192 on average during this period between 2012 and 2016. Connecticut’s statewide eviction moratorium froze notice and filing starting on April 10; it remained in effect through the end of the year. 7 Neither Bridgeport nor Hartford saw more than 10 percent of typical filings after April 23. By contrast, cities that allowed filings but suspended hearings were less successful in reducing new eviction filings. On average across the eight cities that fell in this category, new filings were at 22.6 percent of historical average. In Phoenix, which allowed eviction filings and hearings but froze enforcement of eviction orders, total filings rose to 47.8 percent of average.
As the pandemic progressed, policy makers added restrictions to the moratoria that limited protections to nonpayment of rent cases only and/or to tenants who could prove that their hardship was due to COVID-19 job or wage loss or health outcomes. This shifted the intervention from a strict moratorium to an affirmative defense that tenants had to raise in court—a considerably more onerous requirement. The vast majority of state and local moratoria expired by the summer of 2020 (Benfer et al. 2021). As more state and local moratoria lifted, and as emergency measures established by the CARES Act expired, the pace of eviction filings increased. In Figure 3, we plot the cumulative number of eviction filings across all ETS sites over the course of 2020, as well as the historical baseline.

Cumulative eviction filings across Eviction Tracking System sites in 2020 and in historical average.
Prior to the start of the pandemic, the pace of eviction filings in 2020 almost exactly matched the historical average: roughly 50,000 cases filed each month. Between March and the end of July, only 2,100 new cases were filed per month on average, or 4.2 percent of the normal rate. From September onward—with the CDC eviction moratorium in place, but with the majority of state and local eviction moratoria expired—this rose to more than 7,000 cases filed per month. Although this rate remains significantly below historical average, it is nonetheless more than triple the rate of new filings observed when the CARES Act was in place and local and state moratoria were at their strongest. Strict moratoria reduced eviction filings dramatically. As protections have been weakened, more cases have been filed.
This increase in eviction filings over the last four months of 2020 is also indicative of flaws with the CDC moratorium. As noted previously, interpretation and implementation of both federal moratoria varied widely across jurisdictions (Ernsthausen and Simani 2020; Ernsthausen et al. 2020). ETS data allow us to observe heterogeneity in local implementation of the CDC order reflected in eviction filing data. In Figure 4 we plot eviction filings relative to historical average between when the order went into effect (September 4) and the end of the year. Each bar is one of the cities listed in Figure 2, excluding cities or city-months in which state or local eviction moratoria were also in place.

Eviction filings relative to historical average during the Centers for Disease Control and Prevention eviction moratorium across Eviction Tracking System sites with no overlapping state or local moratoria.
Local interpretation led to wildly divergent conditions for renters. Filings were below 40 percent of historical average in Philadelphia, Richmond, Virginia, and New York City, whereas they exceeded 80 percent of historical average in Columbus, Ohio, and the three sites we monitor in Florida (Gainesville, Tampa, and Jacksonville). Across all sites, filings were at 49.7 percent of historical average. Filings also generally increased between the start of the CDC moratorium and the end of the year. Averaging across sites, filings fell at 48.7 percent of historical average in September and 65.7 percent in December. Only two cities saw notable declines in filings over this period.
Nationwide, how many fewer eviction cases were filed in 2020 than we would have expected? Because the majority of renting households do not live in areas covered by the ETS, we cannot provide a precise tally. We can, however, extrapolate what we observed in the ETS to counties for which we have historical eviction filing data. This allows us to cover an additional 30.3 million renter households, bringing overall coverage to 39.5 million (90.1 percent of all renter households). To do so, we fit a Poisson regression model in ETS sites predicting county-week eviction filings in 2020 as a function of historical eviction filing patterns, sociodemographic factors, and pandemic-related policy interventions. 8 We used the trained model to predict the number of filings that likely occurred in out-of-sample counties for which we had valid baseline data. Once we generated these county-week predictions, we aggregated by county and compared the cumulative number of predicted filings with the historical baseline. Finally, we aggregate across counties to estimate the total number of “missing” filings across all counties.
We estimate that there were likely 927,000 eviction filings across all non-ETS counties for which we have historical data between March 15 and December 31 (95 percent confidence interval: 703,000–1,170,000). In a typical year over this period, these counties would have experienced more than 2.1 million eviction filings, thus leaving 1.17 million fewer filings than expected. When combined with numbers from the ETS, this results in at least 1.55 million fewer eviction cases filed in 2020 than would be filed in a typical year.
Who Was at Risk for Eviction in 2020?
Fewer eviction cases than normal were filed after the pandemic began, but the demographic characteristics of those facing these cases did not change. Previous research has demonstrated that Black and Latinx renters, particularly female renters, are disproportionately at risk for being filed against for eviction and being evicted (Desmond 2012; Hepburn, Louis, and Desmond 2020b; Thomas et al. 2019). Eviction filings after March 15 targeted the same communities and individuals who were at risk for eviction prior to the pandemic.
Eviction court records do not identify the race, ethnicity, or gender of tenants who face removal. As such, we use well-validated statistical techniques to impute, on the basis of names and addresses listed on the court records, defendants’ race/ethnicity and gender (Hepburn et al. 2020b). (The imputation methodology is described in the Appendix.) We do this for both historical data and records collected in 2020, which allows us to compare patterns before and during the pandemic. In Figure 5 we plot the share of eviction filings against Asian, Black, Latinx, and white individuals before and during the pandemic, as well as the share of all renters in those racial/ethnic groups. 9

Share of all renters and eviction filing defendants, before and during the pandemic, by race/ethnicity.
Prior to the pandemic, Black renters received a disproportionate share of all eviction filings. They made up 22.8 percent of all renters in ETS sites but received 37.9 percent of eviction filings. Black renters continued to be overrepresented during the pandemic, receiving 35.2 percent of filings between March 15 and December 31. Prepandemic, Asian, Latinx, and white renters were underrepresented in eviction filings relative to their share of the renting population. That remained true during the pandemic as well, although the share of filings against Latinx and white renters increased slightly. For example, the share of filings against white individuals increased from 42.0 percent to 43.6 percent, still well below their share of the renting population in this sample (50.2 percent).
The majority of eviction filings were against women. In a typical prepandemic year, 52.4 percent (95 percent confidence interval: 52.40 percent to 52.45 percent) of individuals filed against for eviction in our sample were women. Since the pandemic began, much the same held true: 49.2 percent (95 percent confidence interval: 49.06 percent to 49.23 percent) of individuals filed against for eviction after March 15th were women. 10 Gender disparities in filing patterns were reduced to a greater degree for some racial/ethnic groups than for others. Under normal circumstances, between March 15 and December 31 we would expect to observe approximately 114,900 eviction filings (95 percent confidence interval: 114,709 to 115,125) against Black women in our sample. That amounts to more than 45 percent more filings than the expected 79,400 filings (95 percent confidence interval: 79,190 to 79,564) against Black men. Since the start of the pandemic, that gap has narrowed but remains large: we have observed 24.2 percent more filings against Black women than against Black men. 11 Among Latinx renters, we would expect to see 8.0 percent more filings against women than men. The pattern inverted for this group, and we saw 1.9 percent more filings against men than women from March 15 onward. Normally, we see 9.2 percent more filings against white female renters than against white male renters. After March 15, filings were nearly equal, with only 1 percent more filings against men than women in this group.
How Much Rent Is Owed?
In five ETS sites—Cincinnati, Houston, New York, Philadelphia, and Phoenix 12 —we are able to observe claim amounts in eviction filings: the back rent, late fees, and damages landlords claim when filing an eviction case. In Figure 6, we plot monthly median eviction claim amounts as a ratio of median rent over the course of 2020. We omit months for which we do not have data or in which very few cases were filed.

Monthly median eviction claim amount as a ratio of median rent.
We observe much higher claim amounts late in 2020 than were typical of early months of the year. For example, in Houston, median eviction claim amounts in January ($1,099), February ($1,050), and March ($1,064) hovered just above the median rent in Harris County ($1,031), suggesting that the typical tenant facing eviction at the beginning of 2020 was roughly a month behind in rent. In December, by contrast, the median eviction claim was for $1,928, 187 percent of median rent in Harris County. In New York City, the typical prepandemic eviction claim was for $2,645, or just under double the median rent. Since August, landlords have been claiming upward of $4,650—more than three times median rent. It bears noting that the sites that instituted more restrictive moratoria (New York and Philadelphia) saw more dramatic increases in claim amounts.
Several hypothetical mechanisms may underlie this pattern of rising claim amounts. One hypothesis is that landlords were choosing to file against only those furthest behind on rent, thus artificially raising median claim amounts. The number of eviction filings and the claim amounts of those filings are rising in lockstep, however, which runs contrary to a simple selection explanation.
A second hypothesis is that increases in claim amounts were driven by landlords’ filing against more affluent households with higher rents—households previously at low risk for being evicted. To investigate this possibility, we assigned every filing in Houston in 2020 to its census block group. We found that eviction filings were and continue to be limited to a small set of low-income neighborhoods. In January and February 2020, more than half of all eviction filings in Houston concerned tenants who lived within just 9 percent of block groups. The median claim amount in these areas was $1,018. In December 2020, the median claim amount for cases in these neighborhoods was $2,013. The distribution of neighborhood median rents associated with eviction filings is almost identical before and after March of this year. Landlords are filing evictions in the same neighborhoods as prior to the pandemic, but for much more money.
This leads us to favor a third hypothesis, in many ways the simplest: the pandemic-related economic crisis is causing more renters to fall further behind on rent, and most of those renters live in low-income neighborhoods (Airgood-Obrycki and Hermann 2021; Kazis 2020; Kneebone and Murray 2020). Under normal circumstances, many landlords file to evict tenants after their first month of partial or missed rent. Where they were able to exercise rights, eviction moratoria, including the CDC moratorium, allowed tenants to stay in their homes without making full rent payments but did not obviate the obligation to pay. As moratoria lifted, more eviction cases were filed against households that had fallen several months behind on rent.
Discussion
This article offers a first picture of eviction filing patterns during the COVID-19 pandemic of 2020, a preliminary analysis of displacement risk for a year in which policy makers instituted a broad set of protections improving residential stability. Our findings suggest that these measures, in tandem with expansions to the social safety net, prevented at least 1.55 million eviction filings across the country. After March 15, fewer than half as many eviction cases were filed as we would normally expect.
This reduction in eviction filings is significant and demonstrates the potential of moratoria as an effective mechanism for halting evictions. Despite wide variability, restrictions on application, problems of implementation and interpretation, and demands placed on renters, eviction moratoria resulted in fewer cases than normal being filed from the start of the pandemic onward, a period of severe economic hardship among renters. Still, our analysis suggested several troubling trends. First, the pace at which eviction cases were filed increased over the course of 2020. Second, the populations facing eviction filings remained relatively static, a pattern that put Black and female renters at disproportionate risk for eviction. Third, the amounts claimed in eviction cases rose dramatically in the later months of 2020.
As the pandemic wore on, more state and local actors either prematurely repealed or limited protections to smaller segments of the renter population. By the time the CDC moratorium went into effect, the majority of state and local eviction moratoria had lapsed, and many of those that remained required tenants to assert COVID-19 hardship (Benfer et al. 2021). This required tenants to have the knowledge of and ability to raise their rights with the court. The vast majority of tenants lack access to counsel (Desmond 2015), and only a few U.S. cities have adopted a civil right to counsel. Because the CDC moratorium required the tenant to understand and exercise rights, and allowed landlords to file evictions and challenge tenant declarations of eligibility, it left substantial gaps in protection. These gaps were widened by agency guidance that allowed landlords to challenge tenant declarations of eligibility, courts to adjudicate cases, and widespread inconsistency in interpretation, adoption, and enforcement at the state and local levels. Thus, as the year progressed, a growing number of households faced the risk for eviction.
Taken jointly, these trends represent cause for concern. As of the time of publication the CDC eviction moratorium was set to expire on June 30, 2021. At that time, renters will have the fewest protections available to them since the start of the pandemic. Many of the eviction cases that were averted in 2020 may be filed, and with significant amounts of back rent due. The Consolidated Appropriations Act of 2021 (signed into law December 27, 2020) included $25 billion for rental assistance and the American Rescue Plan included an additional $21.6 billion, money that should help settle some of these claims and to keep families housed. Distribution of those funds remains challenging, and the total may fall far short of the balance of unpaid rent owed. 13 This emergency aid also does not address the underlying affordable housing crisis or economic hardships faced by a renters, especially low-income Black and Latinx households (JCHS 2020). One of the major tests for 2021 will be whether policy makers prove willing and able to address long-term needs, including investment in affordable housing, while also instituting effective short-term solutions: eviction moratoria that halt all stages of the eviction process, especially the initiation stages, as opposed to allowing existing protections to lapse or relying on affirmative defenses of limited practical utility to most tenants. If not, who will bear the costs and the associated long-term harm?
Footnotes
Appendix
Acknowledgements
This article compiles and extends a set of analyses the authors produced and published on the Eviction Lab’s Web site over the course of 2020 (see ![]() ). We thank Alieza Durana for her tireless editorial oversight and James Minton, Lane Olson, Sasha Zyryaev, and colleagues at hyperobjekt for their advice and assistance on data visualization. The ETS would not be possible without the sustained collaboration of Jeff Reichman and David McClendon of January Advisors; Carlos Manjarrez, Daniel Bernstein, and the team at Legal Services Corporation; the Alachua County Labor Coalition; Anne Wright of the Carnegie Mellon University CREATE Lab; BASTA Austin; the Connecticut Fair Housing Center; the Court Services Division of the Minnesota Judicial Branch; Drew Nolan; the Housing Data Coalition; Jonathan Pyle of Philadelphia Legal Assistance; the Maricopa County Justice Courts; and Open Austin. FundingThe author disclosed receipt of the following financial support for the research, authorship, and/or publication of this article: Support for the ETS is provided by the C3.ai Digital Transformation Institute and the Pew Charitable Trusts. The Eviction Lab is supported by the JPB Foundation and the Gates Foundation and by the Chan Zuckerberg Initiative. Research reported in this publication was supported by the Eunice Kennedy Shriver National Institute of Child Health and Human Development of the National Institutes of Health under award P2CHD047879.
). We thank Alieza Durana for her tireless editorial oversight and James Minton, Lane Olson, Sasha Zyryaev, and colleagues at hyperobjekt for their advice and assistance on data visualization. The ETS would not be possible without the sustained collaboration of Jeff Reichman and David McClendon of January Advisors; Carlos Manjarrez, Daniel Bernstein, and the team at Legal Services Corporation; the Alachua County Labor Coalition; Anne Wright of the Carnegie Mellon University CREATE Lab; BASTA Austin; the Connecticut Fair Housing Center; the Court Services Division of the Minnesota Judicial Branch; Drew Nolan; the Housing Data Coalition; Jonathan Pyle of Philadelphia Legal Assistance; the Maricopa County Justice Courts; and Open Austin. FundingThe author disclosed receipt of the following financial support for the research, authorship, and/or publication of this article: Support for the ETS is provided by the C3.ai Digital Transformation Institute and the Pew Charitable Trusts. The Eviction Lab is supported by the JPB Foundation and the Gates Foundation and by the Chan Zuckerberg Initiative. Research reported in this publication was supported by the Eunice Kennedy Shriver National Institute of Child Health and Human Development of the National Institutes of Health under award P2CHD047879.