
Abstract
Donald Trump presented immigration and trade as the cause of the diminished prospects of white working-class voters, the core of his political base. The authors’ research—the first that examines actual immigration and trade exposure with attitudes and Trump voting—demonstrates that white voting for Trump was unrelated to immigration levels and, paradoxically, strongest in counties with low levels of trade. Anti-immigrant and antitrade attitudes more consistently and strongly explain voting for Trump and Republicans in 2016 and 2018 than actual immigration and trade. The authors also find descriptive support that over four years, Trump’s false narrative unraveled as his support declined in those counties most exposed to immigration and trade. Although Trump elaborated a white nationalist narrative on the basis of anti-immigrant and antitrade politics that was widely accepted as truth, the authors show that virtually no aspects of Trump’s simple narrative have any factual basis in actual reality.
From the launch of his campaign in June 2015, Donald Trump adeptly created a media narrative that America ceased being great because of border-raiding “illegal” immigrants (“murderers and rapists”) and trade agreements such as the North American Free Trade Agreement (the new version is called the USMCA or United States–Mexico–Canada Agreement) and the Trans-Pacific Partnership (TPP) that ship U.S. jobs overseas (Green 2017). In particular, immigration from Latin America (Chavez 2013; Huntington 2004) and trade with China (Autor, Dorn, and Hanson 2016) and Mexico (Yúnez-Naude, Mora-Rivera, and Govea-Vargas 2020) have been portrayed as particularly threatening for at least the past two decades, but such depictions have been especially menacing under Trump’s political narrative. In Trump’s narrative, “real” American working people are hurt because America’s border is being overrun by Mexico sending its worst people and “unfair” trade deals made by our “bad” leaders. This diagnosis leads to the Trump solution that he can “make America great again” by building a “big, beautiful wall,” deporting millions, and renegotiating trade agreements with greater tariffs and protections for American workers. “We have no choice.” “Without borders, we don’t have a country” (Thrush 2020).
With this narrative, Trump mobilized many supporters to this position, and many Republican legislative candidates staked out similar positions in 2016, 2018, and 2020 (Diamond 2019; Kamarck and Podkul 2018). Journalists accepted preliminary scholarship suggesting that voters’ economic insecurity about immigration and trade was the basis for Trump’s appeal and his electoral victory in key swing states (Davis and Hilsenrath 2016; Waldow 2018). They inferred that voter attitudes about immigration and trade were the result of actual immigration and trade, conflating these attitudes with the idea that Trump supporters had experienced negative impacts from both migration and U.S. trade in a global economy. Surprisingly, the actual economic and social impacts of immigration and trade on voters have not been considered.
In one of the rare studies of actual trade impacts on Trump voting, economists found temporary effects between the “China shock” of increased imports in the early 2000s and voting that swung for Trump in 2016 (Autor, Dorn, and Hanson 2016; Autor Dorn, Hanson, and Majlesi 2016). Chinese import penetration was also found to be a predictor of the rise of right-wing candidates and nationalism in Europe (Colantone and Stanig 2018). Other economists found a correlation between a decline in manufacturing employment, the sector that can be vulnerable to international trade, and the counties that voted for Trump (Altick, Atkeson, and Hansen 2018). Although there may be an impact on attitudes from the initial encounters of trade or immigration, this should not be confused with lasting actual negative impacts. Although regions that were exposed to a “China shock” through trade or an influx of new-destination migrations may have voted for Trump in 2016, many of these regions are now more exposed to higher levels of trade and migration.
The U.S.-Mexico Narrative and Economic Self-Interest
The dog whistle of Trump’s dangerously fictitious cross-border narrative, not to mention the full-throated denunciations of Mexicans and Central Americans, should not be underestimated, especially given Trump’s openly racist demonizing, unprecedented among modern presidential campaigns (Bobo 2017). His narrative of nostalgia, forged as it is by white racial identity politics, invokes a long historical legacy of privileged supremacy but with a twist. In this telling of the story, it is an “embattled” white citizenry that must make a stand or be swallowed up by a demographic transformation to a non-white-dominant multiracial America (Abrajano and Hajnal 2015). That is even though immigrants are a boon to the U.S. economy in many ways, such as providing needed labor for an aging population (Blau and Mackie 2017; Myers 2007).
The power of Trump’s antitrade and anti-immigrant political and policy message is that, as some journalists have assumed, voters supported him because he promised to reduce trade and immigration to the benefit of those who felt vulnerable to them. This assumed that his support was greatest where there was more immigration and trade and that voters were economically self-interested. Voting on economic or material interests is consistent with basic economic and class theory. However, it is not known whether Trump voting was related to actual exposure to immigration and trade. As far as we know, there is a surprising lack of research evidence on the actual impact of immigration and trade on immigrant and trade attitudes and Trump support.
Anti-immigrant Attitudes and Racial Resentments
An alternative to the economic interests explanation for Trump’s support is arguments for the importance of attitudes. Well before Trump, political scientists and sociologists examined how conservative political campaigns exploit racist attitudes to garner votes (Mendelberg 2001; Valentino, Hutchings, and White 2002). Work in group position theory posits that increases in the size of a given racial minority group can be seen as a group threat to political and social resources by the majority, triggering the fear that immigrants pose a potential challenge to white majority dominance and generating hostility and negative stereotyping of minorities (Blalock 1967; Hood and Morris 1997; Quillian 1995). Because of the growing size of the Latino population across the United States (Krogstad and Lopez 2015), Latinos and particularly Mexicans may be perceived as a major threat to the white majority, especially when those fears are activated by political candidates (Chavez 2013).
Similarly, growing overall trade may appear to threaten whites by challenging their sense of not only racial but global supremacy. In this way, white Americans situate themselves as the “real” Americans in a world where “America’s” global leadership is at stake. White anxieties or negative attitudes about immigration and trade may also be stirred up by political actors. These actors activate latent racial hostilities (Hopkins 2010; Valentino et al. 2002) as well as a preference for like-minded candidates (Mendelberg 2001), independently of actual immigration and trade.
Regarding Trump’s election, political scientist Diana Mutz (2018b) used data from election panel surveys to infer that attitudes concerning white status, rather than white economic interests, better explained Trump’s victory. She concluded that white voters’ anxiety about globalization and diversity and concerns about job displacement predicted greater support for Trump than actual threats to the economic security of American workers. In a reanalysis of Mutz’s data, Stephen Morgan (2018) concluded that she overstated the status threat explanation. Rather, Morgan claimed, voters’ perceptions of economic interests were at least as important, and their economic interests were intertwined with status issues, which Mutz (2018a) rebutted. Hainmueller and Hiscox (2010) used a survey experiment to find that voter attitudes toward immigration are not explained by economic self-interest, arguing that instead they are probably related to ethnocentrism or considerations about how the local economy as a whole may be affected by immigration. Other political scientists (Sides, Tesler, and Vavreck 2018) have noted a disconnect between the activation of identities and attitudes and “economic anxiety,” which they noted “had been decreasing, not increasing, in the eight years before 2016” (p. 14). “Racial anxiety was arguably driving economic anxiety,” which is measured by the broad if shallow variable of “the index of consumer sentiment” (p. 14), rather than actual economic variables. Still others (Green and McElwee 2018; Hooghe and Dassonneville 2018) have also found that anti-immigrant attitudes and racial resentments explained much of the Trump vote, though neither they nor any of the other mentioned authors explored the impact of actual sectoral and geographic exposure to immigration or trade.
Research Hypotheses
In our view, actual material exposure to immigration and trade is confused in much of the literature with attitudes about immigration and trade. The relationships between actual material interests with respect to attitudes and voting behavior are left unclear and underspecified. We thus specify three general pathways in these relations, which we illustrate in Figure 1. Pathway C represents the relationship between antitrade and anti-immigrant attitudes and Trump support that has been the topic of much research, showing a positive relation between them. However, there is surprisingly little research on the other two pathways: the relationship between actual trade and immigration and voting (pathway A) and between actual trade and immigration and attitudes (pathway B).

Hypothesized correlations between actual trade and immigration, anti-immigrant and antitrade attitudes, and Trump and Republican voting.
Thus, we hypothesize a Trump paradox in which Trump’s demonizing of immigration and trade generates support for a “false narrative bubble” that is increasingly separated from, yet in fragile conflict, with the reality of immigration and trade. Moreover, we hypothesize that support for this false narrative began to unravel after the 2016 election in places with more immigration and trade.
Building on our review of the economic interest and attitudinal explanations to Trump’s political support, we present the following hypotheses that guide our analyses:
Hypothesis 1: Trump paradox, county level.
Hypothesis 1A: Trump paradox A: actual trade and immigration are negatively related to Trump and Republican voting across counties.
Hypothesis 1B: Trump paradox B: actual trade and immigration are negatively related to anti-immigrant and antitrade attitudes across counties.
Hypothesis 1C: Expected relation on the basis of much research: antitrade and anti-immigrant attitudes are positively related to Trump and Republican voting across counties.
Hypothesis 2: Unraveling Trump paradox, country level: support for Trump and Republicans weakened from 2016 to 2018 and from 2016 to 2020 in those counties most exposed to actual immigration and trade, and grew in those less exposed to immigration and trade.
Hypotheses 3A to 3C: Trump paradox: white voters.
Hypothesis 3A: Trump paradox A: actual trade and immigration are negatively related to white Trump and Republican voting across counties.
Hypothesis 3B: Trump paradox B: actual trade and immigration are negatively related to white antitrade and anti-immigrant attitudes across counties.
Hypothesis 3C: Expected relation on the basis of much research: white antitrade and anti-immigrant attitudes are positively related to Trump and Republican voting across counties.
Hypothesis 4: Unraveling Trump paradox: white voters switched from voting for Trump in 2016 to Democratic House candidates in 2018 in those counties most exposed to actual immigration and trade and among those with more positive attitudes on trade and immigration.
Data and Methods
We use county-level data for our macro-analysis and, in the micro-analysis, for our contextual variables of immigration and trade. At the county level, we use various sources. For total county voting outcomes, we use Dave Leip’s Atlas of U.S. Presidential Elections. Data on actual immigration come from the 2016 American Community Survey. Trade data come from the U.S. Census Bureau; Peter K. Schott’s (2018) International Trade Database for 2016; and Eckert et al.’s (2020) County Business Patterns Database for 2016.
For our micro-analysis, we sample non-Hispanic white voters from the 2016 and 2018 Cooperative Congressional Election Study (CCES), which is a >50,000-person nationally (representative) stratified sample survey of the adult U.S. population administered by YouGov.com (https://cces.gov.harvard.edu). Although we have results of the 2020 presidential election at the county level, which we analyze in Table 1 and Figure 2, we do not yet have the corresponding individual-level data.
Zero-Order (Bivariate) Correlation between Voting, Immigration, Trade, and Anti-immigrant and Antitrade Attitudes, County Level.

Sources: Dave Leip’s Atlas of U.S. Presidential Elections, Politico, 2016 American Community Survey 5-year estimates, 2016 and 2018 Cooperative Congressional Election Study.
Ratio of Mexican and Chinese imports (in $100 billion) to percentage employed in the manufacturing sector; applies to all tables and figures.
p < .01
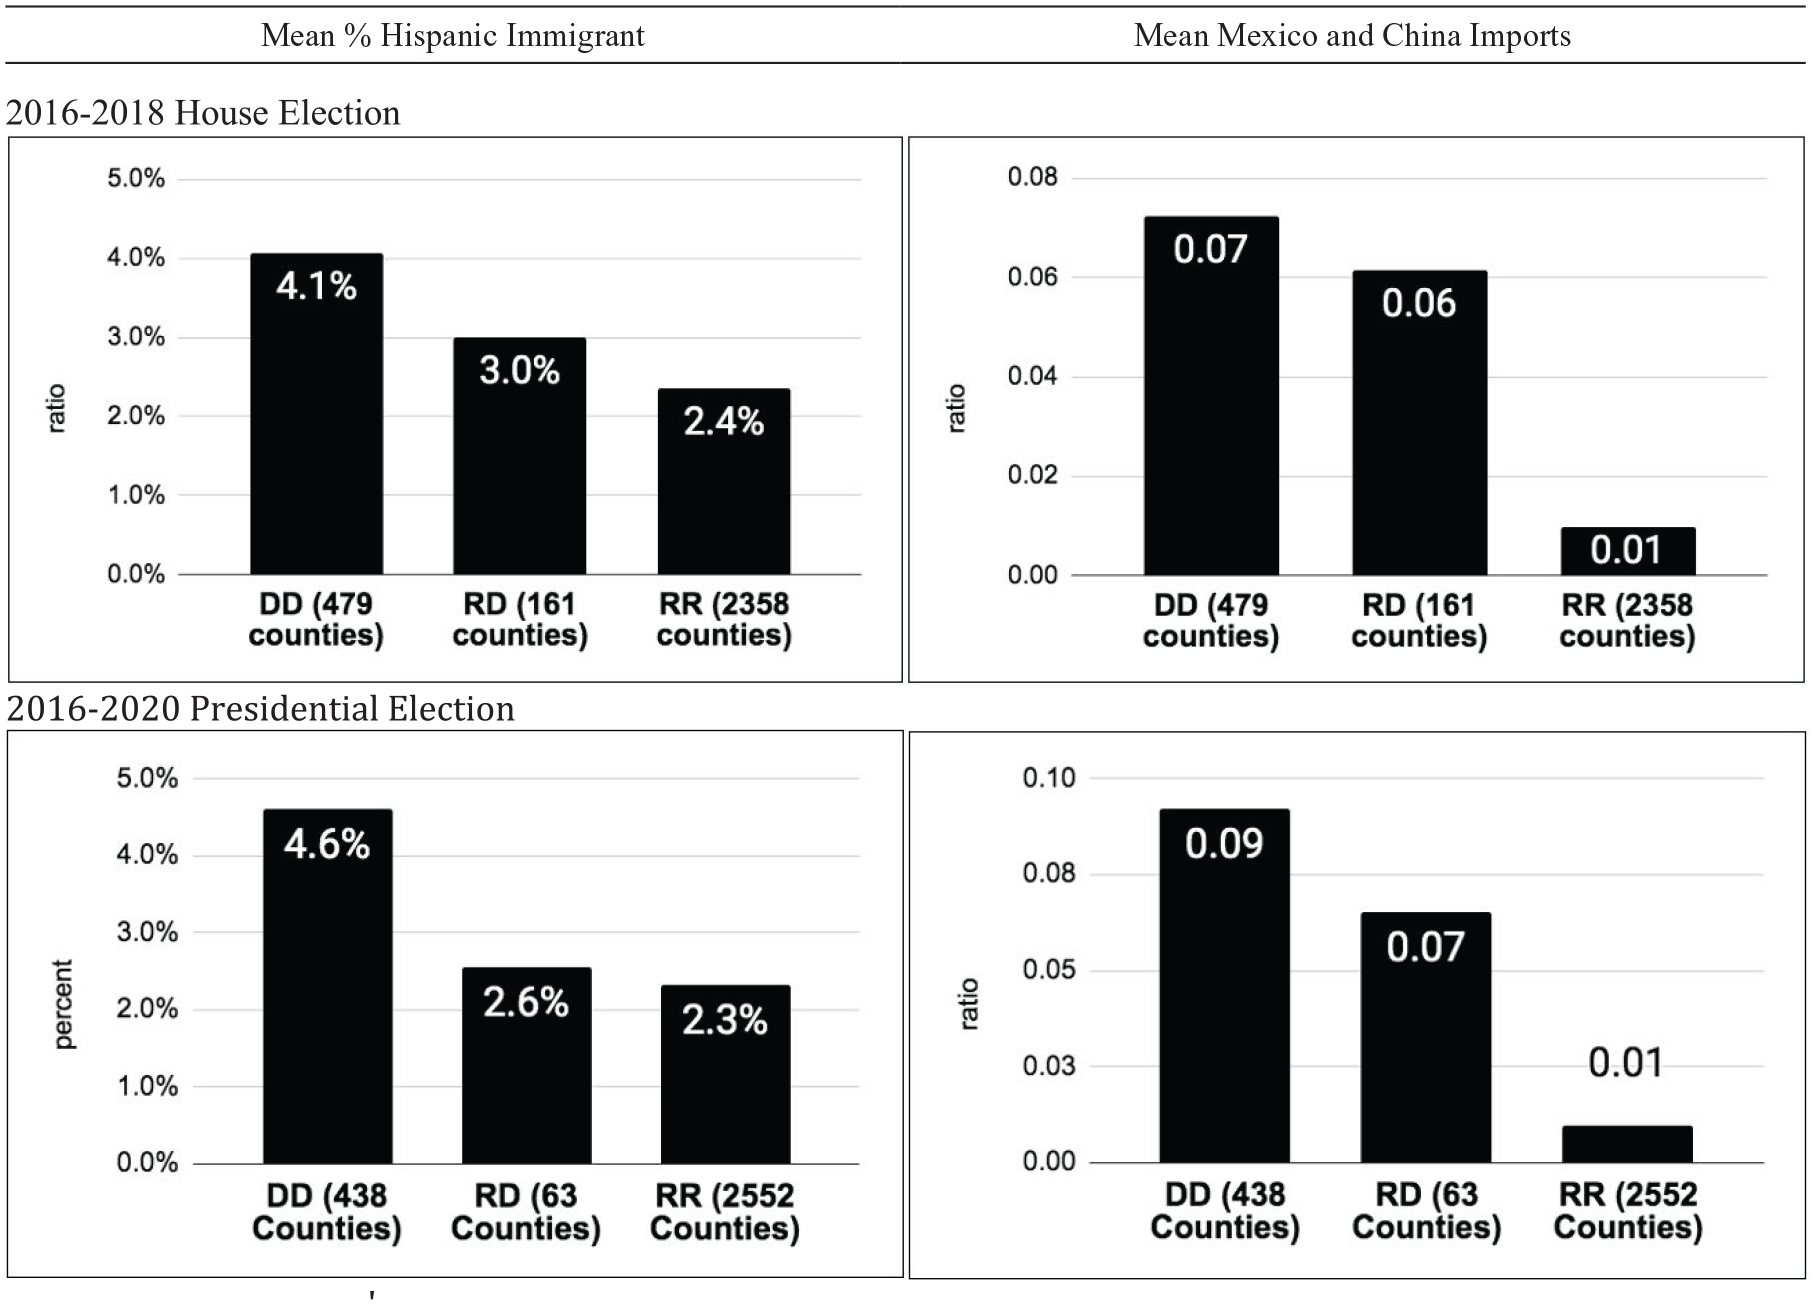
Mean percentage Hispanic immigrant and mean Mexican and Chinese imports in counties that remained Democratic (DD) or Republican (RR) and those that flipped from Republican to Democratic (RD).
To examine our hypothesized relations at the county level, we report zero-order correlations for hypotheses 1A to 1C in Table 1. For our analysis of changing county outcomes by levels of immigration and trade (hypothesis 2), we present histograms in Figure 2. For our multivariate analysis of white voters, we use logit regressions. We are particularly interested in parsing out the county-level effects of exposure to actual trade and immigration versus white individual-level attitudes about them, independent of voters’ personal economic situations and social characteristics (hypotheses 3A–3C). To combine the county and individual effects, in the same analysis we use hierarchical linear regression models (Raudenbush and Bryk 2002). To do this, we link the individuals in the CCES data to the immigration and trade variables for the counties in which they reside.
Our dependent variables are whether non-Hispanic whites voted for candidate Trump in 2016, among all voters and among those who voted for Mitt Romney in 2012 (Table 2), and whether they voted for Democratic candidates in the 2018 House elections, among all voters and among those who voted for Trump in 2016 (Table 3). In Table 4, our dependent variables are immigration and trade attitudes. The primary independent variables for voting in Tables 2 and 3 are actual immigration and trade and immigration and trade attitudes. Other independent variables refer to the demographic, partisan, and socioeconomic characteristics of white voters. In Table 3, we control for the party of the incumbent. The independent variables in the Table 4 analysis of attitudes are the remaining independent variables (except incumbency). Our primary immigration variable is the 2016 stock of immigrants in each county, used in our macro- and micro-analyses.
Coefficients (and Standard Errors) for Hierarchical Regressions Predicting 2016 Trump Voting among Non-Hispanic White Voters (Models 1 and 2) and 2016 Trump Vote among Non-Hispanic Whites Who Voted for Romney in 2012 (Models 3 and 4).

Sources: 2016 American Community Survey 5-year estimates, U.S. Census Bureau, 2016 Cooperative Congressional Election Study, Peter K. Schott’s (2018) International Trade Data, and 2012 Economic Census.
Note: Robust standard errors are in parentheses.
p < .10. **p < .05. ***p < .01
Coefficients (and Standard Errors) for Hierarchical Logit Regression Predicting Voting for Democratic House Candidate in 2018 among Non-Hispanic White Voters.

Sources: 2016 American Community Survey 5-year estimates, U.S. Census Bureau, 2016 Cooperative Congressional Election Study, Peter K. Schott’s (2018) International Trade Data, and 2012 Economic Census.
Note: Robust standard errors are in parentheses.
p < .10. **p < .05. ***p < .01
Coefficients (and Standard Errors) for Hierarchical Logit Regression Predicting Negative Attitudes about Immigration and Trade in 2016 and 2018 among Non-Hispanic White Voters.

Sources: 2016 American Community Survey 5-year estimates, U.S. Census Bureau, 2016 Cooperative Congressional Election Study, Peter K. Schott’s (2018) International Trade Data, and 2012 Economic Census.
Note: Robust standard errors are in parentheses. TPP = Trans-Pacific Partnership.
p < .10. **p < .05. ***p < .01
We create a trade variable for the level of imports from Mexico and China using data on imports by sector (e.g., agricultural products, textiles). To estimate the distribution of imports at the county level, we created a ratio of county to national employment by sector and then distributed national imports according to this ratio. The aim of our analysis was to replicate core aspects of the methodology used by Autor, Dorn, and Hanson (2016) to measure regional trade exposures in U.S. trade with China. Their analysis of U.S.-China trade was based on “the share of each industry in region (e.g. county’s) i’s total sales on the U.S. market”; they summarized differences across U.S. regions in industry specialization patterns (e.g., for the distribution of labor, goods, and services in particular industries). Thus, their methodology captured variation in regional exposure to China’s supply-driven export growth. For our analysis of U.S. trade with Mexico, we also extended and, we believe, improved the specificity of this measurement by including imports from China and Mexico for counties. Finally, we divide this measure of variation in regional exposure by total manufacturing employment to get a per-worker measure of trade. Because we do not have full data on very small counties, we end up with data on 2,892 of the 3,030 counties in the United States, which represent 99.53 percent of the national population.
For our attitude variables, we use the CCES items on immigration and trade. For immigration, the items were agreement or disagreement on whether the U.S government should deport undocumented immigrants (2016) or whether we should build the border wall (2018); for trade, the items were whether voters supported the TPP in both 2016 and 2018. Although the immigration questions were quite distinct, the trade questions were similar but slightly different. The 2016 item queried simply whether respondents were for or against the TPP, while the 2018 question referred to whether the United States should withdraw from the TPP. In 2016, the specific questions were whether respondents agreed that “illegal aliens should be identified and deported” and whether they “would vote for or against Trans-Pacific Partnership Act Free trade agreement among 12 Pacific nations (Australia, Brunei, Canada, Chile, Japan, Malaysia, Mexico, New Zealand, Peru, Singapore, and the US) if in Congress.” In 2018, the survey items are based on whether respondents agree that “the U.S. should increase spending on border security by $25 billion, including build a wall between the U.S. and Mexico” and whether they agree that the United States “should withdraw from the Transpacific-Partnership trade agreement that included the U.S., Japan, Australia, Vietnam, Canada, Chile, others” (2016 and 2018 CCES).
Besides the immigration and trade variables, other independent variables are partisanship, education, gender, age, income, and employment status, which we mostly think of as important demographic, political, and economic controls. For education and age, we use college educated (BA or higher) and older than 65 years, as commonly operationalized in studies of voter behaviors (Altick et al. 2018). Family income, temporarily laid off, unemployed, and whether working in the manufacturing sector represent socioeconomic conditions.
We have also made a replication package available with our data and coding.
Findings
Bivariate Analysis of Counties
Table 1 shows the county-level relation of Trump and Republican voting in 2016, 2018, and 2020 with actual immigration and trade and with anti-immigrant and antitrade attitudes. The Table 1 attitude data are from the CCES data, aggregated for all sampled persons in the county, not just white voters. 1 For the election outcomes, we show the Trump vote share in 2016 and 2020 (columns 1 and 2), the Trump vote share in relation to the 2012 Romney vote share (columns 3 and 4), and the Republican vote share for House candidates in 2016 (column 5), 2018 (column 6), and 2020 (column 7). We calculate Trump minus Romney voting as a strict test of how much immigration and trade were related to Trump voting, beyond the earlier Republican base of support.
In all cases, we find positive and significant correlations between Trump and Republican voting and anti-immigrant and antitrade attitudes as well as negative and significant correlations with actual levels of trade and immigration. In other words, voting for Trump and Republicans tends to be greater where there are fewer immigrants and less trade with Mexico and China and in places with greater anti-immigrant and antitrade attitudes. Thus, hypotheses 1A to 1C are supported for all eight election outcomes.
The top row of Figure 2 examines the mean immigration and trade characteristics of U.S. counties according to voting in House elections, specifically whether they switched from Republican to Democratic (RD) between 2016 and 2018, remained Democratic (DD), or remained Republican (RR). The bottom row similarly examines immigration and trade characteristics of counties by their voting for president in 2020 compared with 2016. Overall, counties that remained Democratic in 2018 and 2020 had about twice as many immigrants as Republican-voting counties and more imports from Mexico and China. Notably, counties that switched from Republican to Democratic had greater levels of immigration and trade compared with those that remained Republican, thus supporting hypothesis 2. In general, the midterm and general elections of 2016 and 2020 as well as the 2018 midterms heightened a Trump paradox at the bivariate level, whereby counties that switched had more immigrants and trade, leaving the remaining counties voting Republican in 2018 and Trump in 2020 even less exposed to immigration and imports than Republican-voting districts in 2016.
Analysis of White Voters
We have verified the hypothesized relations at the county level, but to provide more robust results, we focus on individuals. In particular, we examine white voters, who are the basis of Trump and Republican support, while controlling for their immigration and trade attitudes as well as their demographic, partisan, and economic characteristics. Our analysis of county-level data is merely descriptive (Table 1), and we do not analyze county-level variation, because of widely different population sizes and problems of ecological fallacies (King 2013), including the fact that counties with more Hispanic immigrants may also have more Latino voters. Tables 2 and 3 analyze pathways A and C in 2016 and 2018, respectively, and Table 4 analyzes pathway B for the same two years (Figure 1).
Table 2 shows coefficients and standard errors for four hierarchical logit regression models predicting the extent to which whites voted for Trump. Model 1 represents the baseline model controlling partisanship, demographic, and socioeconomic characteristics of individuals and levels of immigration and trade in the counties in which they reside. We then enter anti-immigrant and antitrade attitudes in model 2. We present models 1 and 2 for former Romney voters and models 3 and 4, which repeat the same pair of models but for all white voters. Specifically, we restrict the sample to only whites who voted for Romney in 2012 to examine changes in voting among persons who previously voted for a Republican presidential candidate, and results are similar in the sample of all white voters.
The results in the top rows of Table 2 show our results for actual levels of immigration and trade. The proportion of Hispanic immigrants is unrelated to Trump voting, in all four models. This is strong evidence that white voting for Trump had nothing to do with the presence of Hispanics, even though he pontificated that they were taking whites’ jobs and bringing crime. Rather, anti-immigrant attitudes accounted for Trump voting.
Results for trade show that Trump voting also tended to be negatively correlated with greater imports from Mexico and China and with antitrade attitudes in all models. When attitudes are introduced, models 2 and 4 reveal that anti-immigration and antitrade attitudes were strongly and positively related to Trump voting in both samples. Thus, our results suggest that candidate Trump was able to mobilize anti-immigrant and antitrade sentiments among white voters through his narratives, particularly (and paradoxically) in those counties where there was little immigration or trade.
As much of the literature reveals, and which our Table 2 also shows in all four models, white voters who tended to vote for Trump are predominately Republican, independent, non-college-educated, and senior. Not surprisingly, being Republican has by far the strongest effect on voting for Trump, as Republicans were about four times as likely to vote for Trump as Democrats (models 3 and 4), though among those who voted for Romney, Republicans were twice as likely (models 1 and 2), as many Democrats voted for Trump in 2016. Seniors were also more likely to favor Trump compared with Romney and overall. Both models 1 and 3 show that men and those in manufacturing jobs were more likely to vote for Trump, until we introduced controls for attitudes in models 2 and 4, suggesting that manufacturing and male workers had particularly strong anti-immigration and antitrade attitudes because they particularly felt economically vulnerable in 2016. Although not always significant, results for education, unemployment, being laid off, and income (i.e., income undeclared, which tends to select higher incomes) suggest that Trump’s candidacy appealed to less fortunate whites. Our analysis of Trump voting was fairly consistent across the two samples, at the individual level. These results are also consistent with previous research about the demographic and economic characteristics of Trump voters.
Table 3 presents results for the midterm House elections in 2018, in which 40 congressional seats switched from Republican to Democratic, representing a voter backlash against the Trump presidency. As in Table 2, we model voting among white voters who had voted for Romney in 2012 (models 1 and 2) 2018) and among all white voters (models 3 and 4). Thus, our sample in the first two columns consists of persons who voted for Trump in 2016, and the dependent variable represents whether they flipped to vote for a Democratic candidate for the House in 2018. 2 Table 3 is thus set up to mirror Table 2, except that the signs for coefficients are expected to be reversed because the dependent variable represents voting for a Democrat rather than a Republican. As in 2016, the presence of immigrants from Latin America was unrelated to voting in the 2018 midterms, but we did find trade effects. White Trump voters in counties with more trade were especially likely to switch their votes to Democrats in 2018.
Rather, models 2 and 4 show that negative attitudes about both immigration and trade continued to drive voters against Democrats, and the effects appear to be stronger in 2018. Thus, for immigration, the presence of immigrants had no effect in either 2016 or 2018, but Democrats appeared to gain white voters with less virulent anti-immigrant attitudes, a finding that finds more direct support in Table 5.
Anti-immigrant and Antitrade Attitudes by Party and Trump Support among Non-Hispanic White Voters, 2016 and 2018.

Source: 2016 and 2018 Cooperative Congressional Election Study.
Findings on demographic and economic characteristics besides immigration and trade show some groups flipping, while others remained committed to Republican candidates. We find consistent support in all four models that income was negatively related to voting for Democrats in 2016, while income had almost no effect on Trump voting in 2016. Results for the other variables are mixed among the four models, especially when attitudes are controlled. Being unemployed had no effect for white voters generally (models 3 and 4), but when it came to flipping, employed white voters were more likely to switch to vote for Democrats (models 1 and 2). Women, nonseniors, and more educated voters tended to vote more Democratic, but that effect was muted by introducing trade and immigration attitudes (models 2 and 4), reflecting softer anti-immigrant and antitrade attitudes. Read together, the results in Tables 2 and 3 show that although whites in manufacturing jobs and those with lower incomes were more likely to vote for Trump in 2016, in 2018 they tended to switch their votes to Democratic House candidates.
In Table 4, we analyze pathway B in our hypotheses (hypothesis 3B). We regress the anti-immigrant and antitrade attitudes of white voters in 2016 and 2018 on actual immigration and trade, while controlling the other variables. Table 4 reveals that there is no relation between actual immigration, either currently or in the 1990s, and anti-immigrant attitudes in 2016 and 2018 (columns 1 and 3).
Statistically significant coefficients show in all four models that independents and especially Republican voters were more likely than Democrats to be anti-immigrant and antitrade, though the magnitude of the coefficients suggest that the intensity of these attitudes increased, which we show in Table 5 with more direct evidence. Among the white voters we examine, men, those without college degrees, seniors, and those working in manufacturing were consistently more likely to have anti-immigrant and antitrade attitudes. Interestingly, the unemployed tended to have more negative immigration and trade attitudes than the employed in 2016, but in 2018 they developed more positive attitudes about immigration, and their attitudes on trade were the same as the employed. Income had a similar trajectory, whereby lower income voters were more anti-immigrant in 2016 but became less anti-immigrant and antitrade in 2018. Rather, higher income whites tended to be more anti-immigrant and antitrade in 2018.
Table 5 uses the CCES data to show changes in anti-immigrant and antitrade attitudes in 2016 and 2018. The top panel of Table 5 presents antitrade and anti-immigration attitudes by party for both years, while the bottom panel shows 2018 attitudes among Trump voters and whether they also voted for Republican candidates in the 2018 midterms or flipped to vote for Democrats.
The top panel shows that although the anti-immigrant attitudes being measured differ in 2016 and 2018, the direction of the change in both immigrant and trade attitudes by party reveals a contrasting shift in voter attitudes by party. Regarding immigration, 68.7 percent of Republicans agreed with deporting undocumented immigrants in 2016 compared with 87.5 percent agreeing with building the border wall in 2018, a large change, although these represent distinct measures of immigrant attitudes. However, the contrast in changing attitudes by party is striking. Although anti-immigrant sentiment among Republicans increased for Republicans, anti-immigrant attitudes declined from 22.5 percent to 7.4 percent among Democrats, a threefold decline. Similarly, for trade attitudes, the share of Republicans against the TPP increased from 62.7 percent to 76.8 percent, whereas for Democrats it declined sharply from 44.6 percent to 10.7 percent, a 417 percent decline. Our results thus reveal a dramatic polarization of attitudes by party between 2016 and 2018.
The bottom panel of Table 5 shows that the growing polarization is apparent among white Trump voters, some of whom (7.6 percent) switched to vote for Democratic House candidates. Fully 92.8 percent of those who voted Republican in 2016 and 2018 held anti-immigrant attitudes compared with 64.1 percent of Trump voters who switched their votes to Democrats in the 2018 midterms. Similarly, 82.9 percent of consistent Republican voters were opposed to trade in 2018, compared with 48.4 percent of those who flipped to Democratic candidates in 2018. Overall, Table 5 shows that Republicans, especially those who remained Republican, became more virulently anti-immigrant and antitrade in 2018, while Democrats became much less so.
Summary
Our analytical strategy began with disentangling actual immigration and trade from anti-immigrant and antitrade attitudes, which observers seem to have muddled together in explaining Trump voting. At best, analysts have focused on the effect of attitudes on voting, while surprisingly overlooking the effects of actual immigration on voting and on the attitudes themselves. We illustrated these relations with three pathways in Figure 1. Regarding actual immigration and trade, our findings strongly reject the economic interest theory of Trump voting, which has been proposed or assumed at least by journalists (Davis and Hilsenrath 2016; Waldow 2018). Rather, our research shows the existence of a Trump paradox that exposes dual yet systematic contradictions between Trump voter behavior and actual economic exposure to trade and immigration (pathway A in Figure 1). Second, our research also reveals contradictions between the attitudinally perceived economic and social impacts compared with actual economic and social exposure to trade and immigration (pathway B in Figure 1). Third, we affirm that the attitudinally based findings of past studies that anti-immigrant and antitrade attitudes are strongly associated with Trump and Republican voting (pathway C in Figure 1). Finally, our research affirms that places that voted for Trump are more economically challenged by unemployment and failing incomes than others, but these challenging economic conditions are unrelated to exposure to trade and immigration.
We show that virtually no aspects of Trump’s simple narrative to his voters about immigration and trade have any factual basis in the actual reality of immigration and trade. Ironically, although Trump demonized Hispanic immigration and trade with Mexico and China, our results for U.S. counties show that Trump voters in 2016 and 2020 and voters for Republican House candidates in 2016, 2018, and 2020 tend to live in places with relatively little immigration and trade. Unlike actual trade and immigration, we show that anti-immigrant and antitrade attitudes are clearly associated with voting for Trump and Republicans across U.S. counties.
When examining white voters specifically, we find that Trump support in 2016 was unrelated to immigrant exposure. Yet in the 2018 midterm elections, the presence of immigrants became important, as Trump voters who switched to vote for Democrats tended to reside in counties with more Latino immigrants. On trade, white voters who went for Trump in 2016 and switched to Democrats in 2018 were more likely to live in counties with greater rates of imports from Mexico and China. These results for immigration and trade held up with controls for voters’ demographic, partisan, and employment characteristics that numerous prior studies attributed to Trump support.
Like our results for counties, our findings show that anti-immigrant and antitrade attitudes, rather than actual immigration and trade, more consistently and more strongly explain white voting for Trump in 2016 and the loss of 40 Republican House seats two years later. Voters with these attitudes doubled down on Republican House candidates, while some with more moderate anti-immigration and antitrade attitudes flipped to Democrats.
Discussion
The collective failure by media and political leaders to immediately counter not only the blatant bigotry of his initial position but also its distortion of reality allowed Trump to elaborate a twenty-first century white nationalist narrative on the basis of anti-immigrant and antitrade politics, reminiscent of past waves of nativism in American history (Young 2017). Trump’s nativist narrative insulted immigrants, particularly Mexicans, with calls for deporting all undocumented immigrants and their U.S.-born children and making Mexico pay for a border wall by seizing family remittances sent to Mexico (Ordoñez and Kumar 2018). The narrative was augmented by vilifying international trade, especially imports from Mexico and China. His nationalist rhetoric to tie the poor economic conditions of his base with globalization and diversity (Monnat 2016; Rothwell and Diego-Rosell 2016), successfully mobilizing voters on the underlying sentiments that trade and immigration have hurt them. However, his rhetoric obfuscates the deeper underlying dynamics of high unemployment and low income by falsely blaming trade and immigration for the economic challenges of unemployment and poverty. The challenging economic conditions in much of Trump country are real but are unrelated to local exposure to international trade and immigration. In the wake of Trump’s political ascension, the worst thing America’s policy makers could do is to treat Trump supporters’ misdirected anger as a set of legitimate grievances in need of redress through anti-immigrant and antitrade policies.
Our overall results further suggest that Trump rallied white voters to support him by stoking xenophobic and racist sentiments. Indeed, Trump’s strategy was likely based on corralling voters by enhancing these feelings rather than any real concerns over the economic interests of voters. However, the backlash against Republican candidates in the House midterms seems to reflect a growing rejection of that strategy as Republicans with more moderate immigration and trade attitudes flipped to Democratic candidates. Party polarization also increased as Republicans overall became more stridently anti-immigrant and antitrade, while the percentage of Democrats holding those attitudes greatly diminished.
Trump’s ability to successfully tap into anxieties about immigration and trade rather than the presence or threat of actual immigration and trade is consistent with social science research showing that economic self-interest generally has relatively little effect on sociopolitical attitudes, especially when they concern issues of race and immigration (Citrin et al. 1997; Green and McElwee 2018; Sears and Funk 1991). Instead attitudes about immigrants or racialized others may be based on factors such as media exposure (Héricourt and Spielvogel 2014), religious identity (Margolis 2018), racial anxieties (Sears and Funk 1991), or stereotypes about Latinos (Chavez 2013), all of which have been further stimulated during Trump’s campaign and administration. They may see people of color growing in political power and changing the meaning of American culture because of immigration. Whites may perceive that globalization, largely represented by international trade, also threatens American power (Mutz 2018b). Our evidence suggests that Trump’s support is based on such racialized beliefs, even though leading scientific evidence suggests that diversity and globalization may be beneficial to (or at least does not harm) even white working-class voters (Blau and Mackie 2017).
The need to provide solid data and critical analysis is now more important than ever, particularly with respect to an understanding of the real forces driving the Trump phenomenon, which includes legislative candidates beholden to him. An examination of the evidence provides a strong rejection of an economic interest argument for attitudes associated with Trump voting support. The evidence rather points to a Trump paradox of attitudinal and voting support based on a false narrative, a weak, unstable, and unraveling basis for a sustainable political and policy project. This calls into question the common false assumptions of the role of trade and immigration for the rise of Trump and his policy narrative.
Footnotes
Acknowledgements
We thank Jiahui Zhang for research assistance.