
Abstract
Many infectious diseases such as coronavirus disease 2019 spread through preexisting social networks. Although network models consider the implications of micro-level interaction patterns for disease transmission, epidemiologists and social scientists know little about the meso-structure of disease transmission. Meso-structure refers to the pattern of disease spread at a higher level of aggregation, that is, among infection clusters corresponding to organizations, locales, and events. The authors visualizes this meso-structure using publicly available contact tracing data from Singapore. Visualization shows that one highly central infection cluster appears to have generated on the order of seven or eight infection chains, amounting to 60 percent of nonimported cases during the period considered. However, no other cluster generated more than two infection chains. This heterogeneity suggests that network meso-structure is highly consequential for epidemic dynamics.
Many infectious diseases spread through preexisting social networks (Bearman, Moody, and Stovel 2004; Salathé et al. 2010). Similarly, coronavirus disease 2019 (COVID-19), caused by severe acute respiratory syndrome coronavirus 2 (SARS-CoV-2) infection, propagates in families, workplaces, social gatherings, and other localized settings. Epidemiological models incorporate estimates of the degree distribution and homophily of social contacts in order to evaluate the impact of networks on disease spread (Pellis et al. 2015). Similarly, research suggests that a small number of infected individuals result in a majority of subsequent SARS-CoV-2 infections, generating infection clusters known as superspreading events (Adam et al. 2020). These findings begin to illustrate the impact of network micro-structure, or the local patterns of social interaction that affect viral spread. However, we still know little about what we might call the network meso-structure of viral disease transmission.
Network meso-structure refers here to connections among individuals and clusters that affect transmission across bounded social settings. (In contrast, macro-structure encompasses the spread of disease among cities and nations.) Hypothetically, just as individuals may transmit the virus to a heterogeneous number of subsequent individuals, a cluster could give rise to a varied number of infection chains and subsequent clusters. A superspreading event in a social setting connected to many other settings could potentially produce many more infections than an event occurring in a less well connected setting. Infection meso-structure likely depends on social, cultural, and policy aspects of the social settings generating clusters, including sociospatial segregation, mobility, employment patterns, public health measures, and many other factors.
I visualize the network meso-structure of SARS-CoV-2 infection in Singapore using publicly available contact-tracing data. Singapore is an interesting and perhaps unique case; public health authorities were unusually successful in controlling the virus through stringent measures, but a substantial outbreak emerged in dormitories housing the city’s guest worker population in March 2020. Disease transmission was thus heavily affected by the particular inequalities of Singaporean society (Teo 2018). An important question is therefore how the virus spread to many different socially bounded settings (dormitories) with limited impact on the nonmigrant population.
Figure 1 represents the six largest network components (see supplement for data details). Square nodes represent infected individuals, while circles represent clusters of multiple infections. For visual clarity, individuals whose only tie is to one cluster are omitted as nodes and represented by scaling cluster diameter to the number of associated individuals. Ties represent personal contact between individuals or associations of individuals with clusters. Collectively these five components account for 77 percent of nonimported COVID-19 cases detected between March 25 and April 19, 2020.
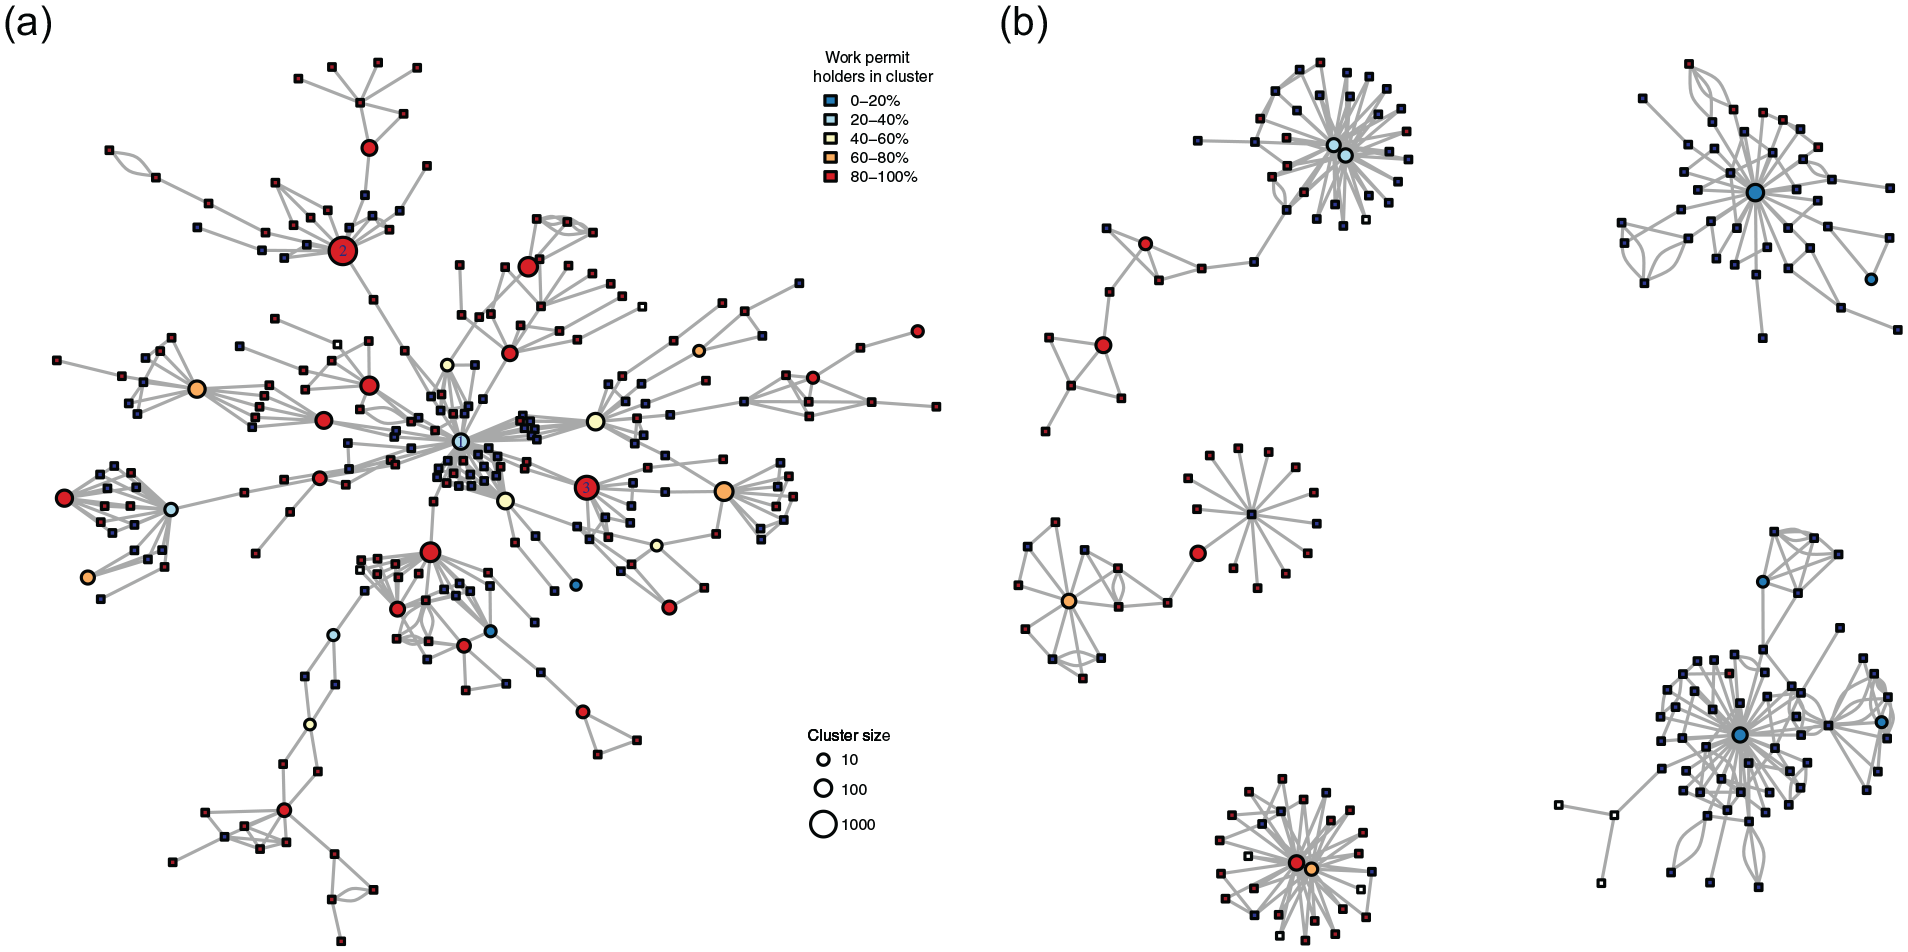
SARS-CoV-2 infection network in Singapore. The figure shows the pattern of contact between individual COVID-19 patients and clusters of infected individuals. Panel A represents the largest connected component and panel B all other components with more than 20 nodes. Circles represent clusters and squares represent individuals; cluster size is scaled to the number of associated individuals. Because the outbreak disproportionately affected the migrant worker population, the figure shades nodes by work permit status. Red squares represent work permit holders, blue squares represent other individuals, and cluster shade is scaled to the proportion of work permit holders. The figure shows that cluster 1 (which included few work permit holders) appears highly central to the outbreak, spreading to clusters composed predominantly of work permit holders. Figure 1 also suggests that only cluster 1 produced on the order of 7-8 infection chains, with most other clusters forming part of 1-2 infection chains.
Figure 1A shows the largest connected component, which accounts for 60 percent of nonimported cases, while Figure 1B shows additional components with ≥20 nodes. The largest component consists of a highly central cluster (cluster 1) surrounded by seven or eight contagion chains. Cluster 1 is a major construction site cited by health authorities as an important hub of transmission. On the basis of the dates of cluster origination, it appears that all but one of these chains postdate cluster 1 (the remaining chain is ambiguous); thus this cluster appears to be a critical pathway of virus transmission. Notably, although the overwhelming majority of patients with COVID-19 were guest workers, this cluster was composed primarily of non–guest workers.
An interesting feature of this structure is that the branching of infection chains appears limited, even during a period of rapid spread. Only cluster 1 generated on the order of seven or eight infection chains; most other clusters form part of one or two infection chains. Cluster 1 appears to be a kind of “super-superspreading” event that not only produced many infections but produced many infection chains. Other clusters are “only” superspreading events, producing many infections but few infection chains. The two largest clusters (clusters 2 and 3), both dormitories, did not produce multiple subsequent infection chains. This may reflect the effects of public health interventions. An implication is that patterns of connection between social settings (e.g., between a construction site and dormitories) are consequential for viral diffusion. Public health interventions to remove interactions between cluster 1 and other sites might have been effective in preventing an outbreak. In summary, this visualization suggests that the spread of a virus such as SARS-CoV-2 is structured by meso-level interaction patterns in addition to micro-social dynamics.
Supplemental Material
sj-pdf-1-srd-10.1177_23780231211000171 – Supplemental material for Visualizing the Network Structure of COVID-19 in Singapore
Supplemental material, sj-pdf-1-srd-10.1177_23780231211000171 for Visualizing the Network Structure of COVID-19 in Singapore by Tod Van Gunten in Socius
Footnotes
Acknowledgements
Cecilia Fewster assisted with data collection and cleaning. The journal editors and one anonymous reviewer provided helpful suggestions.
Funding
The author(s) disclosed receipt of the following financial support for the research, authorship, and/or publication of this article: This research was supported by funding provided by the School of Social and Political Science of the University of Edinburgh.
Supplemental Material
Supplemental material for this article is available online.
Author Biography
References
Supplementary Material
Please find the following supplemental material available below.
For Open Access articles published under a Creative Commons License, all supplemental material carries the same license as the article it is associated with.
For non-Open Access articles published, all supplemental material carries a non-exclusive license, and permission requests for re-use of supplemental material or any part of supplemental material shall be sent directly to the copyright owner as specified in the copyright notice associated with the article.