
Abstract
Balancing finances is a complicated and precarious act for many U.S. households, with constant concerns that income will not be enough. What happens when households are no longer able to keep up this balancing act? This research draws on 2019 Survey of Consumer Finances data to examine varying experiences of economic insecurity, measured as whether a household’s expenses exceeded its income in the previous year, and households’ strategies for managing economic insecurity. The author explores the ties among economic security, household debt burdens, and credit market access. By comparing the actual strategies that insecure households used to weather insecurity with the hypothetical strategies proposed by more secure households, the findings show that the resources that protect against insecurity also influence how households manage it. Although most insecure households relied on borrowing when their spending exceeded their incomes, secure households most often recommended spending from savings or finding additional income.
Households in the United States regularly engage in balancing acts. Each month, they try to figure out how to cover their bills on often limited incomes, while worrying what might happen if an unexpected expense arises. This situation is not uncommon. In 2016, only 40 percent of U.S. households had enough savings to cover at least three months of expenses, and 16 percent of households held less than $400 in their savings accounts, according to Survey of Consumer Finances (SCF) data (Bhutta and Dettling 2018). Additionally, 21 percent of families could be classified as credit constrained, with limited access to credit and lending institutions (Bricker et al. 2017). Data from the Survey of Household Economics and Decisionmaking show an even more dire situation, estimating that 40 percent of households would not be able cover an unexpected $400 expense (Board of Governors of the Federal Reserve System 2018).
These numbers present evidence for the growing economic insecurity that many U.S. households face on a daily basis, which has worsened since the coronavirus disease 2019 pandemic began. As a fundamental component of economic well-being, economic insecurity goes beyond basic measures of income and employment to incorporate aspects of risk and protection against loss (Hacker et al. 2014; Western et al. 2012). Most research points to rising economic insecurity in the United States since the 1970s, which is clearly evident in declining social safety nets combined with weakening labor market protections and the growth of temporary contingent employment (Hacker 2006; McCloud and Dwyer 2011). These trends are also apparent in the limited resources households are able to put aside to deal with financial hardship.
Considering the relationship with resources, it is important to understand how both debt burdens and credit market standing are associated with economic insecurity. Unlike income and assets, which are almost always associated with greater security, debt can function to both increase and decrease insecurity among households, depending on how it is used. It is also connected to credit market access and standing. For many households, the ability to access credit and take on debt acts as a safety net, providing a cushion in times of financial instability (Dwyer 2018). For other households, high debt levels can make it much harder to balance finances when dealing with economic insecurity (Dwyer 2018; Leicht 2012; Maroto 2015; Tach and Greene 2014), creating further credit constraints. In many cases, insecurity can also lead to increased debt levels when households borrow to make up the difference, continuing a cycle of debt and insecurity.
Defining economic insecurity in relation to both expenses and income, in this article I address the following research questions: Are debt burdens and credit market standing associated with economic insecurity? How do households respond to economic insecurity? More specifically, what actual strategies do insecure households implement when their spending exceeds their income for unexpected reasons? And how do these compare with the hypothetical strategies more secure households propose taking to deal with such situations?
Researchers have proposed multiple measures of economic insecurity that consider income volatility (Gorbachev 2011; Gottschalk and Moffitt, 2009; Jacobs and Hacker 2008); experiences of adverse events, such as job loss, illness, and divorce (DiPrete 2002; Maroto 2015); employment in precarious work (Kalleberg 2011); and resource adequacy more generally (Chai and Maroto 2020; Lusardi, Schneider, and Tufano 2011). Several studies estimating broader economic risk across the population have also relied on weighted indices that include multiple measures, such as income losses, financial wealth and debt, out-of-pocket medical costs, and perceptions of economic risk (Hacker et al. 2014; Osberg and Sharpe 2005). This study incorporates a different measure of economic insecurity based on situations when household expenses exceed income, tipping their balance sheets and placing them in precarious circumstances.
I use 2019 SCF data to examine household experiences of and responses to economic insecurity. Specifically, I assess whether a household’s spending exceeded, met, or fell below its monthly income for the previous year as a measure of economic insecurity. This helps address the important balance between spending and income that households must negotiate on a regular basis. I first use a series of multinomial logit models to highlight the relationship between economic insecurity, debt burdens, and credit market standing. I then divide my sample into insecure and secure households and compare the strategies insecure households actually used when faced with insecurity against the hypothetical strategies proposed by secure households for dealing with insecurity. Insecurity strategies that help households “make up the difference” include borrowing money, spending from savings or investments, postponing or falling behind on payments, cutting back on spending, finding new income, and simply doing nothing.
My findings present a broader picture of precarity through economic insecurity, measured as the balance between income and expenses. On average, 13 percent of households reported spending that exceeded income in 2019, making them insecure by this measure, with credit-constrained and debt-burdened households experiencing the greatest levels of insecurity. The close connection to credit and debt demonstrates that insecurity is not evident only in precarious employment and declining safety nets. It permeates households’ financial situations and well-being.
Expanding on this relationship, I also show that the resources that protect against insecurity influence how households deal with insecurity. Insecure households were much more likely to borrow as an insecurity strategy, but more secure households reported that they would spend from their savings or find alternative income sources if they had to accommodate unexpected expenses. The differences between what insecure households actually do when faced with financial hardship and what secure households think they might do highlight a lack of understanding about situations of financial insecurity by those who are more secure. The implications of this likely spill over into public opinion regarding policies aimed at limiting insecurity and helping those experiencing hardship.
Precarity and Economic Insecurity
Precarity, precariousness, insecurity, vulnerability—these terms commonly refer to uncertain and risky situations in which individuals and households are left to deal with tough situations on their own (Standing 2011). Most often, precarity research has focused on labor market experiences and “employment that is uncertain, unpredictable, and risky from the point of view of the worker” (Kalleberg 2009:2). However, growing precarity is evident in multiple areas of life, including housing (Desmond 2016; Dwyer and Phillips Lassus 2015), mobility (Bricker and Bucks 2016), income volatility (Morduch and Schneider 2017), and financial hardship (McCloud and Dwyer 2011) more generally.
Tied to precarity, economic insecurity is a broader concept that incorporates risk, loss, and adverse events. Economic insecurity is the “degree to which individuals experience and are protected against large economic losses” (Hacker et al. 2014:S6) or the “risk of economic loss faced by workers and households as they encounter the unpredictable events of social life” (Western et al. 2012:342). Economic insecurity further entails aspects of resource adequacy and factors that affect a household’s ability to weather different hardships and survive economic shocks (Hacker et al. 2014). Importantly, resources come in many forms that range from wage and salary income to government-provided social safety nets to emergency savings funds (Osberg and Sharpe 2014).
This study brings together the key economic insecurity components of resource adequacy and experiences of adverse events through a focus on the balance between income and expenses. Do households have enough money coming in to pay for their expenses? The relationship between spending, income, and wealth is a central aspect of economic insecurity. Indexes, such as the Economic Security Index and the IEWB Economic Security Index, include measures for income, employment, wealth, financial assets, involuntary expenditures, and government benefits (Bossert and D’Ambrosio 2013; Hacker et al. 2014; Osberg and Sharpe 2005). Although helpful in gauging economic insecurity in the aggregate, such indexes do not always provide a good understanding of how individuals households experience insecurity. By examining situations in which expenses exceed income, I explore instances when households fail to keep up the great balancing act and study how such situations could be related to debt and credit market standing.
Credit Market Standing, Debt Burden, and Economic Insecurity
Income losses, adverse events, or unexpected expenses often tip the balance in household finances toward insecurity. Access to lending and other resources can act as a buffer, limiting exposure toward insecurity, but the presence of debt or liabilities can also increase vulnerability to insecurity. Debt is what households owe. It includes secured debt backed by assets, which most often takes the form of mortgages, and unsecured debt in the form of student loans, credit card payments, and other installment debt. With these multiple forms, all debt does not function in the same way. It provides different potential benefits and burdens, hence the common discussions of “good debt” and “bad debt.”
Debt can function to both increase and decrease insecurity among households, depending on how it is used. For many households, the ability to access credit and take on debt acts as a safety net, providing a cushion in times of financial instability (Dwyer 2018). Debt can actually promote asset growth, but it also requires access to credit and lending institutions, which many households, especially racial minorities, do not have (Conley 1999, 2001; Fourcade and Healy 2013; Hodson, Dwyer, and Neilson 2014; Keister 2000a; Oliver and Shapiro 2006). As a result, debt generally rises with education and earnings (Bricker et al. 2017; Keister 2000b), wherein the most indebted households tend to also have the greatest assets.
For other households, high debt levels can make it much harder to balance finances when dealing with economic insecurity, leading to a variety of negative consequences (Dwyer 2018; Maroto 2015; Tach and Greene 2014). Cross-nationally, aggregate household debt burden is associated with poor health outcomes and lower life expectancy (Clayton, Liñares-Zegarra, and Wilson 2015). Longitudinal studies show that increases in unsecured debt are associated with higher stress levels and an increased risk for depression in adults (Hodson et al. 2014), as well as declines in children’s socioemotional well-being (Berger and Houle 2016). High debt levels also have consequences for other life-course transitions, including marriage, parenthood, and transitions out of the parental home, among young adults (Addo 2014; Bleemer et al. 2014; Bozick and Estacion 2014; Nau, Dwyer, and Hodson 2015). Thus, depending on how it is used and the broader economic situations of households, debt has the potential to affect experiences of economic insecurity in various ways.
Debt, therefore, must always be considered in relation to other income, assets, and resources, as well as households’ access to credit markets. This requires examining debt burden and payments, not just total debt levels, and considering larger credit constraints. I therefore focus on debt burden, measured as the total monthly debt-to-income ratio, and credit market standing, measured in relation to homeownership, financial behavior, savings, credit card access, and credit constraints across analyses of economic security. In addition to assessing relationships between debt burden, credit market standing, and economic insecurity, I also extend the analyses to examine what households do when faced with economic insecurity.
Household Strategies for Dealing with Economic Insecurity
Rising economic insecurity leads to many questions regarding household economic well-being. What happens when households are unable to balance their expenses? How do households deal with economic insecurity? Although research on the causes of economic insecurity and its implications for various outcomes has been growing, fewer studies have specifically addressed how households weather instances of economic insecurity.
Bankruptcy studies show what happens when households are unable to manage when faced with adverse events, such as illness, job loss, or divorce (Himmelstein et al. 2009; Maroto 2015; Sullivan, Warren, and Westbrook 2000). Bankruptcy is often a last resort for households, however, and many do not have the means to file for bankruptcy, which is why it is often described as a “middle class phenomenon” (McCloud and Dwyer 2011; Warren and Thorne 2012). Before considering bankruptcy, households engage in various strategies to manage economic insecurity that include spending down savings, taking on loans, relying on credit cards, searching out additional income, and depending on community groups and social networks (Morduch and Schneider 2017). For many households, this often means juggling bills and debt by rotating monthly payments (Tach and Greene 2014)
Ethnographic studies provide further detail about the strategies households might use. For instance, Edin and Lein (1997) showed how low-income single mothers worked additional jobs and relied on family members and community groups for assistance. Newman and Chen (2007) found that “near poor” families, those just above the poverty line, often relied on social networks and credit cards while coping with financial hardship. More recently, Morduch and Schneider (2017) highlighted how households at different income levels relied on small amounts of savings, negotiated with creditors, and borrowed money from friends when faced with a dip in earnings in the U.S. Financial Diaries project.
Findings from bankruptcy research and low-income households provide some insight into potential insecurity strategies available to households, while also alluding to relationships among debt, credit market standing, and economic insecurity. However, these studies do not indicate how strategies taken to combat instances of insecurity vary across households, nor do they show what secure households would propose to do in these situations. Assessing both actual and hypothetical insecurity strategies is important given the likely differences between secure and insecure households and the implications for policy. Perceptions of insecurity and encounters with economic shocks are correlated with support for policies that aim to buffer risks to insecurity across employment, health, and family domains (Hacker, Rehm, and Schlesinger 2013; Rehm, Hacker, and Schlesinger 2012). Expectations for what households should do when faced with insecurity are also likely connected to policy preferences and views of less secure households.
Data
I examine aspects of economic insecurity using data from the 2019 SCF. The SCF is a triennial cross-sectional survey of U.S. households, conducted by the economic research and data branch of the U.S. Federal Reserve. With financial information for households related to income, asset ownership, and debt, the SCF provides the most detailed assets and debt data available (Board of Governors of the Federal Reserve System 2014). The survey also employs strategic sampling to include high-wealth and high-income households, which are often missed in less targeted surveys. I analyze five imputed samples of 5,777 households from the 2019 SCF. To account for sampling strategies and complex data, I incorporate replicate sampling weights in all analyses, and I apply Rubin’s (1996) techniques to combine multiple imputation samples. 1
Measures
I incorporate three outcome variables in the study to measure experiences of economic insecurity, actual strategies used by insecure households when faced with economic insecurity, and hypothetical strategies for dealing with insecurity proposed by secure households. The first outcome variable, economic insecurity, includes three categories: spending exceeded income (insecure), spending equaled income (somewhat secure), and spending less than income (more secure) in the previous year. 2 The question specifically asks respondents not to consider spending on household, vehicles, investments, or other large items to better capture the relationship between unexpected expenses and income.
The second and third outcome variables are actual and hypothetical insecurity strategies. Actual strategies are the steps insecure households actually took to make up the difference when their spending exceed their incomes. Hypothetical strategies are the actions that somewhat and more secure households said that they would take if faced with a financial emergency. Both sets of strategies include three categories: borrowed money, spent from savings or investments, and other. Other strategies include postponing (or falling behind on) payments, cutting back on spending, and working more. 3
Previous waves of the survey have been somewhat limited when examining household strategies for dealing with economic insecurity because this question was asked of only households whose expenses exceeded their incomes, generally a small subset of households. However, the SCF recently began asking secure households what they would do if they were in a situation in which their expenses exceed their incomes (Bricker et al. 2017). This allows a comparison of actual and hypothetical strategies used to deal with economic insecurity.
I focus on comparing economic insecurity and insecurity strategies across four sets of variables related to debt burden and credit market standing, group membership and demographics, family structure and gender, and income and employment. I measure debt burden as a household’s total monthly debt-to-income ratio. To allow for potential nonlinear relationships, I divide this variable into categories based on whether the household had any debt payments and quintiles of debt-to-income ratio levels for households with payments. This first resulted in a variable with six categories: no monthly debt payments, monthly debt payments 0 percent to 5 percent of income (first quintile), 6 percent to 12 percent of income (second quintile), 13 percent to 19 percent of income (third quintile), 20 percent to 29 percent of income (fourth quintile), and greater than 29 percent of income (fifth quintile). 4 After initial models showed few differences between households in the no debt category and in the 0 percent to 5 percent of income category, I combined these groups into a single category of 0 percent to 5 percent within models.
To assess aspects of financial attitudes and credit market standing, I include variables indicating whether a household saves regularly by putting aside money on (at least) a monthly basis. I also include a measure describing a household’s willingness to take financial risks. This variable indicates whether a respondent or spouse would take above average or substantial risks on investments. I include a variable that indicates whether a respondent or spouse thought it was a good idea to borrow with credit and a measure that indicates whether a household was credit constrained. A household is considered to be credit constrained if it was turned down for credit or received less credit than applied for in the past 12 months or if it did not apply for credit because of the possibility of being turned down. Finally, to control for credit market access and use, I include a categorical variable that considers credit card use and debt. This variable has three categories indicating that a household has a credit card but does not carry a monthly balance, has a credit card and carries a balance, and has no credit card. I also incorporate measures for whether a respondent or spouse owned a home or owned any stocks or bonds.
I also assess a set of demographic variables that include age, race and ethnicity, disability status, and education. I include age, along with a quadratic term to address any nonlinearity in the relationship. On the basis of the measures available in the public SCF data, I use four categories for race and ethnicity: non-Hispanic white, non-Hispanic Black, Hispanic, and non-Hispanic other racial identity. These large categories are less than ideal for comparisons across racialized groups; however, sample size and available survey data limit my ability to include more refined measures. I control for whether a respondent or spouse reported a work-related disability, which I constructed in relation to their responses to job and work status variables. I also examine differences across households in which at least one member (respondent or partner) has obtained a university degree and those with less than a university-level education.
Because wealth is measured at the household level, it is hard to separate gender dynamics from household structure in these data. I therefore compare outcomes on the basis of gender and household structure across three household types: two adult couple households, single male adult households, and single female adult households. I also include variables for household size, measured as the number of individuals in the household, and the presence of children younger than 18 years. Finally, as measures of the household labor market situation, I control for the total household wage and salary income, whether a respondent or spouse was retired, and the total hours worked per year within the household. Models therefore include a broad range of control variables that cover basic demographics, education, employment, and financial attitudes.
Methods
I begin with a descriptive overview of economic insecurity and actual and hypothetical insecurity strategies. I then incorporate three series of multinomial logistic regression models to examine the associations between sets of predictors and the following three outcome variables: (1) economic insecurity across all households, (2) actual insecurity strategies among insecure households, and (3) hypothetical insecurity strategies among less secure and more secure households. Multinomial models are ideal for this analysis because they allow the inclusion of outcome variables with multiple categories. Within these models, the probability of membership in each category is compared with the probability of membership in a designated reference category (Liao 1994; Menard 2002). Much of this research is exploratory, with the goal of providing a clearer picture of levels of insecurity and strategies used to deal with insecurity across households.
Findings
Economic Insecurity
Figure 1 shows levels of economic insecurity, measured in relation to situations in which spending exceeds income, from 1998 to 2019 in the United States. Although rates have been pretty stable over time, security has increased in recent years with fewer households spending less than their incomes after 2010. In 2019, 13 percent of households reported spending that exceeded income, making them insecure, 37 percent had spending equal to their incomes (somewhat secure), and 50 percent spent less than their incomes (more secure).

Levels of economic insecurity over time, 1998 to 2019.
Answering my first research question regarding the association between debt burdens and credit market standing with economic insecurity, Table 1 presents multinomial logistic regression results from models predicting whether a household’s spending was beyond its income (insecure), equal to its income (somewhat secure), or less than its income (more secure) for the previous year. Within the table, results are presented as average marginal effects, indicating the estimated difference in the probability of reporting the specified level of economic insecurity when considering all other options. Full model results comparing each option are presented in Appendix Table A2.
Results from Multinomial Logit Models Predicting Level of Economic Insecurity.
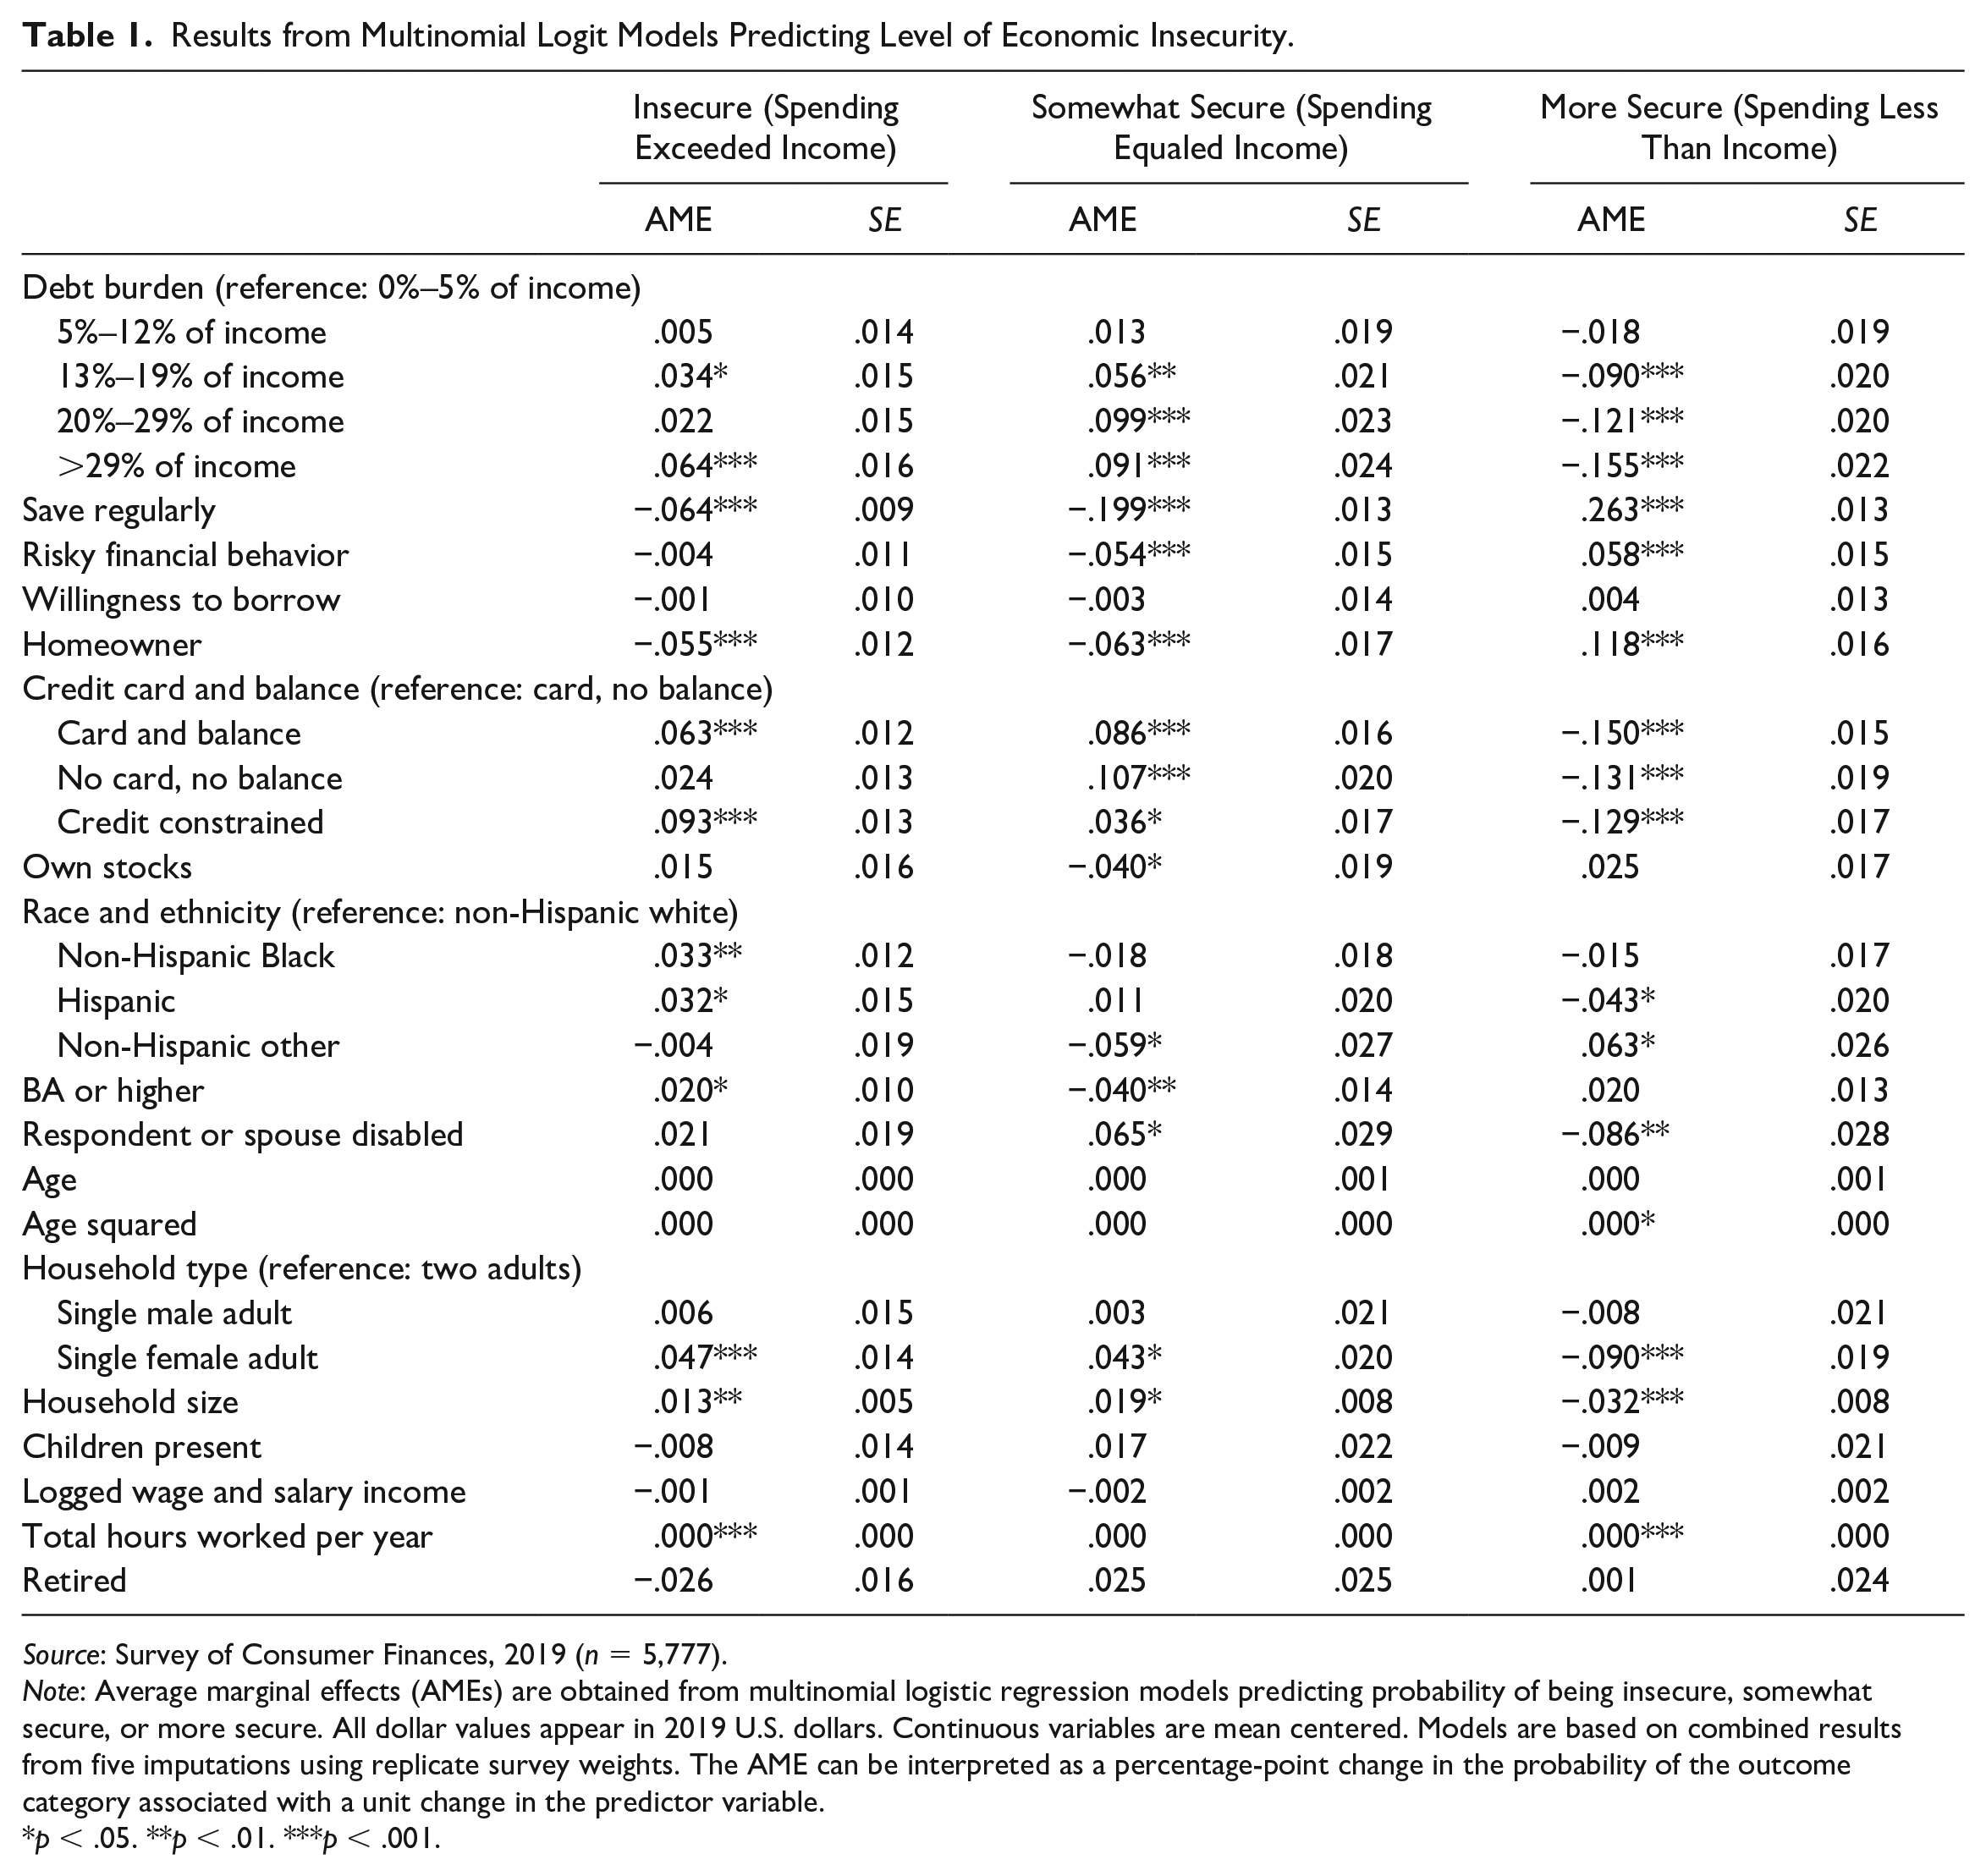
Source: Survey of Consumer Finances, 2019 (n = 5,777).
Note: Average marginal effects (AMEs) are obtained from multinomial logistic regression models predicting probability of being insecure, somewhat secure, or more secure. All dollar values appear in 2019 U.S. dollars. Continuous variables are mean centered. Models are based on combined results from five imputations using replicate survey weights. The AME can be interpreted as a percentage-point change in the probability of the outcome category associated with a unit change in the predictor variable.
p < .05. **p < .01. ***p < .001.
Across debt burden levels, differences were starkest for the most indebted households. Net of covariates, households with debt-to-income ratios that were 29 percent or more of their incomes were 6.4 percentage points more likely to be insecure than households with debt burdens of 0 percent to 5 percent of their incomes. They were also 9.1 percentage points less likely to be somewhat secure and 15.5 percentage points less likely to be more secure. Households in the next highest quintile, with debts at 20 percent to 29 percent of their income, were also 9.9 percentage points more likely to be somewhat secure than low–debt burden households and 12.1 percentage points less likely to be more secure.
In addition to debt, other credit market–related variables tended to present strong associations with security. Saving regularly was associated with a 6.4 percentage point decrease in insecurity, a 19.9 percentage point decrease in obtaining some security, and a 26.3 percentage point increase in being more secure. Homeownership was associated with a 5.5 percentage point decrease in insecurity, a 6.3 percentage point decreasing in being somewhat secure, and an 11.8 percentage point increase in being more secure. Credit-constrained households were 9.3 percentage points more likely to be insecure, 3.6 percentage points more likely to be somewhat secure, and 12.9 percentage points less likely to be more secure. Access to a credit card and carrying a credit balance were also associated with insecurity. Compared with households with credit cards that did not carry monthly balances, households that carried a monthly balance were 15 percentage points less likely to have expenses below their income levels, and those without access to credit cards were 13.1 percentage points less likely.
Differences were also present for certain groups. Single female adult households were more likely than two adult households to be insecure by 4.7 percentage points and less likely to be more secure by 9.0 percentage points. Households in which at least one spouse held a bachelor’s degree or higher were 5.9 percentage points less likely to be somewhat secure and 6.3 percentage points more likely to be more secure. Non-Hispanic Black and Hispanic households were more likely to be insecure than non-Hispanic white households by 3.3 and 3.2 percentage points. Additionally, households in which at least one spouse reported a disability were 6.5 percentage points more likely to be somewhat secure and 8.6 percentage points less likely to be more secure.
Like debt burdens, credit market access is also influenced by security. For instance, it is much easier for households to save regularly when their income does not exceed their expenses. Insecurity also likely contributes to high credit card balances and credit constraints. Regardless of the direction of the effects, this first set of results shows that debt burden and credit market standing are very much tied to economic insecurity, which is not felt equally across different households. The next set of analyses then examines how households deal with situations of insecurity.
Insecurity Strategies
Figure 2 addresses my second research question, regarding how households respond to economic insecurity. It presents information about the actual and hypothetical strategies used to deal with economic insecurity, which vary across insecure, somewhat secure, and more secure households. Among insecure households, almost equal percentages (44 percent to 45 percent) borrowed and spent from their savings when faced with situations in which their spending exceeded their incomes. Smaller percentages (10 percent) reported engaging in other strategies. For this group, the most common other strategies used included things like falling behind in payments (3 percent) or cutting back on spending (2 percent).

Insecurity strategies across insecure, somewhat secure, and more secure households.
The hypothetical strategies secure households proposed for dealing with economic insecurity differed from the strategies insecure households used. Approximately 18 percent of somewhat secure households said that they would spend from savings to make up for deficits, 32 percent would borrow, and half would use other strategies. In this other category, the most common response was to increase income by working more or getting an extra job, with 34 percent of households choosing this option.
Differences in strategies were most apparent among more secure households, with 58 percent reporting that they would use their savings to weather financial emergencies. Another 8 percent would borrow, and 34 percent would postpone payments, cut back, or find ways to earn additional income. This comparison shows that the most secure households generally rely on their savings to make up the difference when experiencing financial hardships. Other households must rely on a mixture of different strategies. It also indicates that the households who actually experience economic insecurity have very different strategies for managing their situations than those who are not as likely to be exposed to it.
Tables 2 and 3 address my third and fourth research questions, focused on variables associated with actual and insecurity strategies. Table 2 includes average marginal effects from multinomial models predicting actual strategies used by insecure households, and Table 3 includes average marginal effects from multinomial models predicting hypothetical strategies proposed by somewhat and more secure households. Models include all covariates. Full model results appear in Appendix Tables A3 and A4.
Results from Multinomial Logit Models Predicting Actual Insecurity Strategies Used by Insecure Households.

Source: Survey of Consumer Finances, 2019 (n = 680 insecure households).
Note: Average marginal effects (AMEs) are obtained from multinomial logistic regression models predicting probability of borrowing, spending from savings, or using other insecurity strategies. All dollar values appear in 2016 U.S. dollars. Continuous variables are mean centered. Models are based on combined results from five imputations using replicate survey weights. The AME can be interpreted as a percentage-point change in the probability of the outcome category associated with a unit change in the predictor variable. Full model results appear in Appendix Table A3.
p < .05. **p < .01. ***p < .001.
Results from Multinomial Logit Models Predicting Hypothetical Insecurity Strategies Proposed by Secure Households.

Source: Survey of Consumer Finances, 2019 (n = 5,097 secure households).
Note: Average marginal effects (AMEs) are obtained from multinomial logistic regression models predicting probability of borrowing, spending from savings, or using other insecurity strategies. All dollar values appear in 2016 U.S. dollars. Continuous variables are mean centered. Models are based on combined results from five imputations using replicate survey weights. The AME can be interpreted as a percentage-point change in the probability of the outcome category associated with a unit change in the predictor variable. Full model results in Appendix Table A4.
p < .05. **p < .01. ***p < .001.
Focusing first on actual strategies used by insecure households in times of insecurity, Table 2 shows that most differences occurred between choices of borrowing or spending from savings. Credit market standing was a large factor in this choice. Households that saved regularly were more likely to spend from their savings by 22.8 percentage points. Credit-constrained households were less likely to spend from savings by 10.9 percentage points and more likely to borrow by 12.7 percentage points. Net of other factors, debt burden was not associated with insecurity strategies used. However, compared with households that held credit cards but did not carry a balance, those that carried a balance were more likely to have borrowed to manage economic insecurity by 21.5 percentage points, which does indicate a potential relationship between debt and insecurity strategies.
The findings for hypothetical strategies among secure households in Table 3 tell a different story. Some relationships are still present, but the overall suggested hypothetical strategies vary considerably with most secure households reporting that they would spend from their savings when faced with economic insecurity. It is quite clear that the resources that limit insecurity also influence how households might deal with insecurity even among these more secure households. For instance, compared with somewhat secure households, more secure households were less likely to say they would borrow by 4.3 percentage points, more likely to say they would spend from savings by 10.5 percentage points, and less likely to suggest other strategies by 6.3 percentage points.
Responses regarding hypothetical situations also varied across credit market variables but minimally by debt burden. Households who saved regularly were more likely to suggest spending from their savings by 11.4 percentage points and less likely to suggest borrowing or other strategies by 5.6 and 5.8 percentages points, respectively. Unlike with actual insecurity strategies, the willingness to engage in risky financial behavior and borrow were associated with hypothetical strategies. Homeowners were also more likely to say they would spend from savings by 6.2 percentage points and less likely to suggest borrowing or other strategies by 3.4 and 2.8 percentages points, respectively.
Access to lending clearly factored into respondents’ proposed strategies as well. Compared with households that had access to credit cards but did not carry monthly balances, those that carried balances were less likely to propose spending from savings by 10.6 percentage points and more likely to borrow or use other strategies by 5.0 and 5.6 percentage points. Those households without access to a credit card were less likely to propose spending from savings by 16.2 percentage points and more likely to borrow or use other strategies by 3.6 and 12.6 percentage points. Finally, credit-constrained households were less likely to suggest using savings by 12.4 percentage points and more likely to suggest other strategies by 10.2 percentage points.
Discussion
In addition to increasing economic inequality, U.S. households must also deal with the consequences of rising economic insecurity, or the growing risk associated with economic losses and financial hardship (Hacker 2006; McCloud and Dwyer 2011). Declining social safety nets, market deregulation, financialization, and reductions of union strength have all shifted risk to households. Employees not only face increasingly irregular work arrangements, but they also experience greater threats of unemployment through layoffs or firing (Hollister 2011). The consequences of such trends are evident in job losses and increasing debt (Lin and Neely 2019; Seefeldt 2016), as well as within rising physical and mental health problems and drug abuse across groups (Bor, Cohen, and Galea 2017; Catalano 1991; Gorbachev 2011). The growing risk for insecurity is not uniform across groups; racial minorities, women, people with disabilities, and low-income households all experience higher rates of insecurity (Hacker et al. 2013; Maroto, Pettinicchio, and Patterson 2019; Maroto and Pettinicchio 2020; Western et al. 2016).
At the same time, differential access to credit and increasing debt burdens among certain households complicate household balancing acts even further. Aggregate household debt and consumer credit been risen dramatically since the 1980s (Bricker et al. 2017; Fligstein and Goldstein 2015; Lin and Neely 2019). In the process, the mix of debt held by households also changed, with steep increases in education debt and more households carrying credit card balances (Bricker et al. 2017). Rising unsecured credit card and student loan debt has also been tied to certain groups, especially younger cohorts (Houle 2014) and racial minorities (Houle and Addo 2019). The unequal distribution of credit across households means that although some households are able to use credit to limit insecurity, other households are experiencing negative consequences associated with high-interest loans and rising debt burdens.
My findings, which show that many families in the United States live in precarious financial positions, emphasize these relationships. Approximately 13 percent of households reported bills that exceeded their incomes in the previous year. Another 37 percent live paycheck to paycheck, spending everything they receive each month with little to no savings. This means that only half of U.S. households could be defined as more secure, with spending needs that did not exceed their incomes.
My results also indicate that the prevalence of economic insecurity is tied to growing household debt burdens, as well as vulnerable credit market positions. Households with the highest monthly debt burdens are much more likely than other groups to be insecure with spending that exceeds their incomes. These differences are reflected in Figure 3, which presents predicted probabilities of being insecure, somewhat secure, or more secure on the basis of models in Table 1. As shown in Figure 3, 17.6 percent of households with debt levels that were greater than 29 percent of their incomes were insecure, compared with 11 percent of households with the lowest debt burdens. Additionally, as debt burden increases, the probabilities of being somewhat versus more secure cross with fewer high debt burden households being more secure than somewhat secure.

Predicted probability of being insecure, somewhat secure, or more secure on the basis of results from Table 1.
Figure 3 also highlights the importance of other credit market variables for assessing economic insecurity. Saving regularly, homeownership, access to credit cards, and credit constraints stand out among these variables. Some of the highest rates of economic security were among households that saved regularly; 64.6 percent were more secure. Although having savings can create a buffer to increase security, the ability to save regularly is also likely a consequence of economic security, whereby insecure households simply have very little to put into savings each month. Both nonhomeowners and credit-constrained households were more likely to be somewhat secure than more secure. Rates of insecurity were also highest among credit-constrained households, with 20.3 percent reporting spending that exceeded their incomes in the past year.
Actual and hypothetical insecurity strategies also show connections with debt burden and credit market standing. These differences are reflected in Figures 4 and 5, which present predicted probabilities of borrowing, saving, or using other strategies to deal with economic insecurity on the basis of models in Tables 2 and 3. Households with high debt burdens were less likely to spend from their savings as an actual strategy for dealing with insecurity and less likely to propose spending as a hypothetical insecurity strategy. Large differences in strategies were also apparent across households that could and could not save regularly, those that did and did not own their homes, those that did and did not face credit constraints, and those that did and did not have access to credit cards.

Predicted probability of actual insecurity strategies (borrowing, spending from savings, and other) on the basis of results from Table 2.

Predicted probability of hypothetical insecurity strategies (borrowing, spending from savings, and other) on the basis of results from Table 3.
Figures 4 and 5 also show that what secure households say they will do in times of insecurity differs from what insecure households actually do when faced with situations in which their spending exceeds their incomes. The resources that limit insecurity also influence how households propose to deal with insecurity. Secure households do not expect to have to borrow when faced with economic insecurity, but this is often what insecure households must do. As highlighted by the Appendix tables, large differences also become apparent when comparing more secure households with others. This shows that somewhat secure households were still likely struggling. Just making ends meet is not enough to provide security and keep families from growing their debt burdens. Having the ability to simply have money left over at the end of the month has become a luxury for American families.
Conclusion
In this study I examined the relationship among debt, economic insecurity, and insecurity strategies using a series of multinomial logit models, which allowed me to include outcome variables with multiple categories. This is particularly important for retaining information that would that would be lost if the variables were reduced to binary outcomes. Despite the benefits of these methods, however, the cross-sectional structure of the data limited my ability to address what are likely multidirectional relationships among debt, credit market standing, economic insecurity, and insecurity strategies. As a result, this analysis leaves open questions as to how much economic insecurity also leads to increasing debt burdens and limits later credit market access. Additionally, the insecurity strategies recorded by the SCF are very broad and somewhat limited. They do not include options such as “borrow from family members” or “obtain a payday loan,” which would help expand our understanding of different strategies.
Future research would benefit from incorporating wealth and debt data from longitudinal surveys, such as the Panel Study of Income Dynamics and the National Longitudinal Survey of Youth 1979 and 1997 cohorts, which could provide better information about causal ordering in these relationships. The trade-off, however, is that these surveys do not offer as detailed information on debt, economic insecurity, and insecurity strategies as the SCF. Qualitative data collected from households with varying histories of debt and economic insecurity could also offer insights regarding the many different strategies available to help limit the consequences of insecurity.
Today, and especially since the beginning of the coronavirus disease 2019 pandemic, terms such as precarity, risk, and insecurity are now common in the sociological literature on inequality. They also dominate the feelings and anxieties across households as they try to balance their expenses every month, pay down debt burdens, and contemplate the consequences of growing insecurity. The relationships between debt, credit market standing, and economic security are clearly complicated. They are also likely cyclical. Higher debt burdens can make households more susceptible unexpected expenses and financial hardship. Greater insecurity can lead to taking on more debt and can make it harder to pay back current debt, potentially leading to credit constraints and less access to lending. Although this cross-sectional study cannot fully untangle these cyclical relationships, it helps shed light on the associations between debt burden, credit marking standing, economic insecurity, and household strategies for getting by in insecure times. Thus, my analyses provide a better understanding of the factors associated with economic insecurity, the strategies that households use when faced with insecurity, and the relationship between debt burden, credit market standing, and insecurity.
Supplemental Material
sj-docx-1-srd-10.1177_2378023120988199 – Supplemental material for The Great Balancing Act: Households, Debt, and Economic Insecurity
Supplemental material, sj-docx-1-srd-10.1177_2378023120988199 for The Great Balancing Act: Households, Debt, and Economic Insecurity by Michelle Maroto in Socius
Footnotes
Supplemental Material
Supplemental material for this article is available online.
Notes
Author Biography
References
Supplementary Material
Please find the following supplemental material available below.
For Open Access articles published under a Creative Commons License, all supplemental material carries the same license as the article it is associated with.
For non-Open Access articles published, all supplemental material carries a non-exclusive license, and permission requests for re-use of supplemental material or any part of supplemental material shall be sent directly to the copyright owner as specified in the copyright notice associated with the article.