
Abstract
Recent scholarship has examined how accelerated math trajectories leading to calculus take shape during middle school. The focus of this study is on advanced math course taking during the critical yet understudied period that follows: the transition to high school. Data from the High School Longitudinal Study of 2009 are used to examine advanced math course taking in ninth grade, including both track persistence among students who took advanced math in middle school and upward mobility among students who took standard math in middle school. Results reveal sizable racial gaps in the likelihood of staying on (and getting on) the accelerated math track, neither of which are fully explained by prior academic performance factors. Interactions with parents and teachers positively predict advanced math course taking. In some cases, interactions with teachers may also reduce inequality in track persistence, whereas interactions with counselors increase such inequality. Implications for research and policy are discussed.
Researchers, educators, and policy makers continue to express great interest in understanding math course-taking trajectories, and with good reason. Taking higher level math courses in high school has strong, positive effects on a host of postsecondary educational outcomes and is associated with higher wages in adulthood, both directly and indirectly through its impact on educational attainment (Long, Conger, and Iatarola 2012; Rose and Betts 2004). Moreover, students who take multiple higher level math courses are more likely to pursue careers in science, technology, engineering, and math (STEM) fields (Domina and Saldana 2012; Tyson et al. 2007), which is essential for building domestic talent, meeting STEM workforce demands, and addressing STEM racial equity concerns (NSB 2016, 2018). Yet despite marked growth in the share of students taking higher level math courses in high school, substantial racial gaps remain (Champion and Mesa 2016; Dalton et al. 2007; NSB 2014, 2018; Planty, Provasnik, and Daniel 2007; Smith 2004).
Racial gaps are also evident in accelerated algebra courses offered during middle school that place students “on track” for calculus by their senior year of high school (Cogan, Schmidt, and Wiley 2001; Gamoran and Hannigan 2000; McFarland 2006). Accordingly, several recent studies have examined factors that shape a student’s likelihood of taking algebra I in eighth grade (Domina 2014; Loveless 2008; Walston and McCarroll 2010). But in contrast to this growing body of research, there is much less research on patterns of racial inequality in advanced math trajectories between middle school and high school, which is a period of academic, structural, and social change that can adversely affect a student’s educational performance and well-being (Mizelle 2005; Neild 2009; Schiller 1999). To this point, despite evidence suggesting that minoritized youth are likely to experience greater disruption during the transition to high school (Benner 2011; Langenkamp 2010), there is limited national research on race and advanced math course taking between eighth and ninth grade.
In this study I use nationally representative data from a recent cohort of high school students to investigate differences in advanced math course taking in ninth grade for students who were on either the accelerated math track or the standard math track in eighth grade. Students who were on the accelerated track took algebra I or a higher level math course in eighth grade; students on the standard track took a math course below the level of algebra I. Therefore, I examine two distinct pathways to advanced math in ninth grade: one in which students stay on the accelerated track (track persistence) and another in which students get on the accelerated track (track formation). By distinguishing these two pathways, we can better understand where racial gaps in advanced math course taking come into play: are they accounted for primarily by previous course taking and performance, or do gaps remain even after both are taken into account? I also examine engagement with parents, teachers, and counselors, as reported by students, as potential mechanisms for understanding variation in advanced course taking patterns. Analyses for this study are motivated by three research questions:
Does the likelihood of taking advanced math in ninth grade vary by race for students who were on the accelerated track in eighth grade? What about for students on the standard track?
Are within-track differences by race fully accounted for by students’ prior course taking and performance?
If academic factors do not fully explain these differences, to what extent are remaining racial differences moderated by students’ interactions with their parents, teachers, and counselors?
Background
The standard math course sequence begins with algebra I (or an equivalent course, e.g., integrated math I) in 9th grade, followed by geometry in 10th grade and algebra II in 11th grade. In 12th grade, depending on state and local graduation requirements, students may have the option to take precalculus, an equivalent math course, or no course at all (Riegle-Crumb and Grodsky 2010; Stevenson, Schiller, and Schneider 1994; Tyson and Roksa 2017). 1 Adding calculus makes this a five-year sequence, which is why students interested in higher level math typically begin the sequence in middle school. Indeed, research shows that students who do not complete algebra I by eighth grade are unlikely to reach calculus in high school without extraordinary effort (Champion and Mesa 2016; Waterman 2010). Thus for students interested in advanced math, the timing of algebra I is critical (Lucas 1999; Stein et al. 2011).
Because most advanced math trajectories begin in middle school and continue in high school, the transition from middle to high school is crucial for students’ course-taking pathways. Promotion to ninth grade, widely regarded as the start of high school, signals a different stage in the life course defined by greater independence and a new set of academic expectations (Mizelle 2005; Neild 2009; Schiller 1999). For most students, this transition also includes a physical move from a middle school to a separate high school. Although the transition to high school is normative and predictable in the United States, it can present significant challenges for students, including those identified as gifted or high achieving, and these challenges can negatively affect their grades and school engagement (Alspaugh 1998; Barber and Olsen 2004; Benner 2011; Langenkamp 2010; Roeser, Eccles, and Freedman-Doan 1999; Schiller 1999). Students may also face distinct challenges shaped by their social characteristics and resources (Benner and Graham 2009). As a result, minoritized students are likely to experience greater disruption during school transitions than their white peers (Benner 2011; Langenkamp 2010; Sutton et al. 2018). Notably, when asked about their perceptions of the transition to high school, students identify math course placement as a distinct concern (Mizelle 2005).
Racial Differences in Advanced Math Course Taking
Racial gaps are well documented in the literature on advanced math course taking in middle school (e.g., Champion and Mesa 2016; Cogan et al. 2001; Gamoran and Hannigan 2000; Hallinan 1992; Walston and McCarroll 2010; Waterman 2010). For instance, Walston and McCarroll (2010) reported that 67 percent of Asian students take algebra I by eighth grade, compared with 45 percent of white students, 38 percent of Latinx students, and less than 20 percent of black students. These gaps widen as students move through high school, with the largest gaps in higher level math courses such as calculus (Champion and Mesa 2016).
There is considerable research on differences in advanced math course taking during middle school, but few studies have examined these patterns during the transition to high school. In one such study, Archbald and Farley-Ripple (2012) found that racial gaps in 10th grade advanced math placements are explained by course taking and achievement in 8th grade. However, these findings were based on a single school district and so are not generalizable. In short, there is a clear need for research on advanced math course taking and track persistence between 8th and 9th grades. Moreover, as school transitions are embedded in stratified communities (Benner 2011) and racialized organizational contexts (Ray 2019), this research should attend to possible racial variation in these experiences.
Tracking and Mobility: Pathways to an Accelerated Math Track
The focus of this study is on two distinct pathways to advanced math in ninth grade. Students who follow the first pathway take algebra I or a higher level course in eighth grade and thus must stay on track to continue on an accelerated math pathway in high school. As Loveless (2008) argued, this early start is likely to leave students on the accelerated math track vulnerable to curricular disruption unique to the transition to high school. For instance, many students end up repeating algebra I in ninth grade. Although we lack national, empirical research on algebra I retention during the transition to high school, we do have suggestive state-level data. For example, districts in North Carolina and California report high algebra I retention rates between middle and high school; in North Carolina, algebra I retention rates were higher in ninth grade than in subsequent grade promotions (Clotfelter, Ladd, and Vigdor 2013; Waterman 2010).
Retaking algebra I is a curricular disruption that reduces students’ positional advantage by affecting future course taking and achievement (Mulkey et al. 2005). Although some educators may favor this practice (possibly as a way for students to increase their comprehension or get a better grade), research suggests that repeating algebra I offers little benefit, especially for higher performing students (Finkelstein et al. 2012; Fong, Jaquet, and Finkelstein 2014; Waterman 2010). 2 And because course retention is commonly associated with academic failure (McFarland 2006), this practice is also likely to reduce students’ self-confidence and academic engagement (Lewis and Diamond 2015). The lack of benefit and likely harm produced by repeating algebra I make it particularly important to understand racial variation in algebra I course retention between eighth and ninth grades, particularly when unwarranted by previous academic performance.
Students who follow the second pathway to advanced math in ninth grade did not take an advanced math course in eighth grade and so must get on track if they are to access advanced math courses. Although these students lack the prerequisites for taking advanced math in ninth grade, the transition to high school sometimes gives them opportunities for upward mobility. For instance, some schools allow students to fast-track their math sequences by doubling up on courses, for example, enrolling in both algebra I and geometry in ninth grade (Kelly and Price 2011). Alternatively, students may be allowed to take geometry without the required prerequisite by either testing out of algebra I or, in rare cases, skipping the course altogether. The importance of accommodations such as these must not be understated, as they offer students additional opportunities to access advanced math courses. Yet despite their potential benefits, there is limited research examining alternative pathways to advanced math in high school and even less focused on the potential for racial differences in access to these accommodations.
Academic Preparation and Performance
Previous course taking and achievement are key predictors of high school math placements (Dauber, Alexander, and Entwisle 1996; Hallinan 1992; Kelly 2009; Schneider et al. 1998). Previous preparation largely explains racial gaps in advanced math course taking during both middle and high school (Kelly 2009; Newton 2010; Riegle-Crumb and Grodsky 2011; Waterman 2010). Although academic performance is also a strong predictor of both upward and downward track mobility in mathematics during high school, Hallinan (1996b) noted that access to the most advanced tracks is often limited because of strict prerequisites.
Why then might we find differences in previous preparation among students on the same curricular track? One potential explanation has to do with increased access to algebra I in middle school. Especially in places with algebra-for-all initiatives such as California, unprepared eighth graders now have greater access to algebra I than they did in the past (Domina et al. 2014; Loveless 2008; Stein et al. 2011). That these so-called misplaced students are predominantly black and Latinx (Loveless 2008) highlights one way previous preparation could contribute to racial gaps in persistence. Another potential explanation focuses on the most common measures of performance in the course-taking literature, grades and test scores, which capture the interplay of both student ability and opportunities to learn (Gamoran et al. 1997; Rowan, Correnti, and Miller 2002; Schiller et al. 2010; Schmidt et al. 2015). Unequal access to learning opportunities before high school, often due to differences in teacher quality or in course availability, content, and rigor, could lead to differences in academic preparation and performance among rising ninth graders, even if they are on the same track and have the same grades in previous courses (Gamoran 1987; Hallinan 1996a; Morton and Riegle-Crumb 2020).
Researchers have also identified specific instances in which prior achievement does not fully explain differences in advanced math placements. For example, Walston and McCarroll (2010) found racial gaps in algebra I course taking during middle school among otherwise high-scoring students. And Kelly (2009) found evidence of racial inequality in high school math course placements even when accounting for students’ socioeconomic status (SES) and academic achievement. Evidence from North Carolina schools suggests that even high-performing students (on the basis of standardized test scores) are at risk for repeating algebra I in ninth grade (Clotfelter et al. 2013). These findings are consistent with previous findings that both academic and nonacademic factors contribute to course placements (Dauber et al. 1996). Because staying on the accelerated math track in high school is typically determined by previous course taking and achievement (Hallinan 1992; Kelly 2009; Schneider et al. 1998), evidence of students’ repeating algebra I despite having previously performed well would support a claim of curricular disruption.
Potential Mechanisms: The Influence of Parents, Teachers, and Counselors
Students’ course placements are often decided in collaboration with parents, teachers, and counselors. Although most students benefit from parental support and encouragement, studies find differences in both how knowledgeable parents are about the inner workings of schools and how involved they are in managing their children’s academic careers (Calarco 2018; Lareau 1987, 2002, 2003). In some cases, parents may even try to actively intervene in or override school course placement decisions (Lewis-McCoy 2014; Lewis and Diamond 2015; Useem 1991, 1992a, 1992b), but school staff members are likely to resist these efforts (Useem 1991). Indeed, Kelly (2004) found almost no evidence that direct parental involvement affects track placement; his findings point instead to the parent-student relationship as a key contributor to track placement. However, race may still influence the educational access and opportunities afforded to students and their families (Lewis-McCoy 2014; Lewis and Diamond 2015). Accordingly, in this study I examine the effect of talking with a parent about math course options and heeding parents’ course suggestions.
Within schools, teacher and counselors play integral roles in student development and transition and serve as important sources of academic and social support (Dimmit and Carey 2007; Kunter et al. 2013; Shill 1987). For instance, teacher support can ease the transition to high school for students and embolden them to enroll in more rigorous courses (Langenkamp 2010; Lantz and Smith 1981). The impact of this support may be even greater among black students, for whom teachers, more than parents or friends, are a primary source of motivation (Casteel 1997; Ferguson 2002). Although students typically have less contact with counselors than with teachers, counselors also influence placement by describing and recommending particular courses (Shill 1987). In many districts, teachers and counselors are key decision makers in the course placement process, while in other districts, middle school teachers and counselors can influence course placements indirectly through, for example, their role in a vertical team (of teachers in high schools and feeder middle schools with vertically aligned programs) or letters of recommendation (Anderson 2005; Gamoran 1992; Mizelle 2005).
Advanced course placement decisions are typically based on a combination of both skill-based requirements, such as grades and test scores, and subjective requirements, such as student or parent requests and teacher recommendations (Kelly 2007; Kelly and Price 2011). Although different schools may weight these two sets of criteria differently (Hallinan 1992; Useem 1992a), if each school applies its placement criteria consistently, there should be no racial differences within schools for students with similar academic profiles. However, Ray (2019) maintained that in racialized organizations, the decoupling of formal rules from organizational practice is often racialized. So if there is a disconnect between how school placement policies are envisioned and how they are used in practice, as some have suggested (e.g., Lewis and Diamond 2015; Oakes and Guiton 1995; Riehl, Pallas, and Natriello 1999), then subjective factors could produce within-school differences in access to advanced math.
The question of teachers’ subjective bias remains a point of contention among scholars. Although Ferguson’s (2003) review of the literature unearthed little evidence of bias in teacher perceptions independent of students’ previous academic performance, scholars have also identified instances in which teachers’ perceptions and students’ empirical realities do not align. For instance, quite a few recent studies have demonstrated a significant relationship between students’ race and teachers’ ratings of academic behavior and performance; typically, Asian students are viewed more positively by teachers than white students with similar backgrounds and performance, while black students are perceived more negatively (e.g., Irizarry 2015a, 2015b; Irizarry and Cohen 2019; Bates and Glick 2013; McGrady and Reynolds 2013; Ready and Wright 2011). These patterns are likely due to stereotypes emanating from dominant racial schemas, such as those that characterize black and Latinx youth as uneducable, unmotivated, and oppositional (Harris 2011; Solorzano 1997; Tyson 2011) and Asian youth as intelligent, hardworking, and naturally good at math (Lee 2009; Lee and Zhou 2015; Wong 1980).
Lewis and Diamond’s (2015) research on tracking in a suburban high school documents how well-meaning teachers and counselors perpetuate racial and ethnic stereotypes in both their interactions with students and their actions related to course placements in ways that reinforce the unequal distribution of social and material resources. Thus, even in the absence of prejudice or racial animus, working in racialized organizations such as schools can reinforce the connection between racial schemas and material resources (Ray 2019). Importantly, the effects of racial stereotypes may be more pronounced during the transition to high school (Sutton et al. 2018). In consideration of these findings, in this study I examine how students’ interactions with parents, teachers, and counselors shape their course-taking pathways and whether these interactions mitigate racial differences in track mobility.
Data and Methods
I use data from the High School Longitudinal Study of 2009 (HSLS), sponsored by the National Center for Education Statistics. The HSLS is a nationally representative, longitudinal study of students who were enrolled in ninth grade during the fall of the 2009–2010 school year. Sampling for the HSLS was completed in two stages, with schools randomly selected at the first stage and students randomly selected from schools in stage 2. In total, more than 21,440 ninth graders completed the base-year questionnaire in fall of 2009 (wave 1). Students were asked about their backgrounds, attitudes, and schooling experiences, with many questions focusing on math-related experiences. This study relies primarily on students’ self-reports from the base-year questionnaire because of the inconsistent documentation of eighth grade course taking on high school transcripts. 3
Measures
Advanced Math Course Taking in Ninth Grade
The dependent variable for this study, a dichotomous measure of advanced math course taking, was created using students’ self-reported math course enrollment during the fall of ninth grade. 4 Following convention regarding the sequencing of courses leading to calculus by 12th grade, students were categorized as being in advanced math in ninth grade if they selected any of the following courses: geometry, algebra II, trigonometry, integrated math II through IV, or higher level math courses such as precalculus or calculus. Students who were not enrolled in one of the advanced math courses listed were categorized as not being in advanced math. This latter group included students who reported taking a standard ninth grade math course (e.g., algebra I, integrated math I, prealgebra), remedial math course (e.g., basic, business, consumer math, general math), some other unidentified math course, or no math course at all. 5
Eighth Grade Math Track
Students were also asked to identify the most advanced math course they had taken in eighth grade, which, given the timing of the wave 1 survey, would have been completed that same year. 6 Following the same convention as above, students were identified as having taken advanced math if they selected any of the following: algebra I, geometry, algebra II, trigonometry, or higher level courses such as precalculus or calculus. Students who did not take one of the advanced math courses listed were identified as not being in advanced math. This latter group included students who selected math 8, advanced or honors math 8 (not including algebra), prealgebra, integrated math, or some other unidentified math course. This information was then used to create a dichotomous measure of track placement. Students who had taken advanced math in eighth grade were categorized as being on the accelerated math track, and all others were categorized as being on a standard track. Students’ prior math track serves as my primary grouping variable.
Having access to full transcripts and course names facilitated the identification of two groups of students. The first group includes students who reported having taken algebra I in eighth grade but, according to their transcripts, had actually been enrolled in the first part of a two-year algebra sequence (e.g., algebra I-A and I-B). These students (fewer than 20 in total) were recoded as having been on the standard math track in eighth grade. The second group includes students who reported taking algebra I in ninth grade but, according to transcript data, also completed more advanced math courses, typically geometry, that same school year. This information was used to identify students who double-dosed in math for enrichment, often through block scheduling (e.g., taking algebra I in the fall and geometry in the spring) (Henry, Barrett, and Marder 2016) and thus were likely not yet enrolled in an advanced math class at the time of wave 1 data collection (fall of ninth grade). 7 These students (about 180 in total) were recoded as being enrolled in advanced math in ninth grade. 8
Student Background
HSLS variables for students’ racial background and Hispanic/Latinx ancestry, along with more detailed ancestry information for Asian students, were used to construct a comprehensive measure of race. Students with Hispanic or Latinx ancestry were categorized as either white Latinx if their sole racial identification was white or black Latinx if they identified as black or African American. All remaining students with Hispanic or Latinx ancestry were categorized as nonblack Latinx. Non-Latinx students who identified either exclusively as white or as white with American Indian ancestry were categorized as white. And those who identified as black or African American were categorized as black. From those who remained, students who identified as Asian or Pacific Islander were divided into one of three categories on the basis of regional ancestry: East Asian (i.e., Chinese, Japanese, Korean), South Asian (e.g., Indian, Sri Lankan), or Southeast Asian (e.g., Filipino, Thai, Vietnamese). Students who identified as Native Hawaiian or Pacific Islander were also included in the latter group. Non-Latinx students whose sole racial identification was American Indian or Alaskan Native were excluded from the study because of their small subgroup sample size.
Multivariate analyses include two additional student background characteristics as model controls. The first is SES, a standardized measure developed for the HSLS; this composite measure was constructed from data on the educational attainment, family income, and occupational prestige of students’ parents or guardians. A dichotomous variable for gender (male = 1) is also included as a model control.
Prior Academic Factors
In addition to prior math track, I focus on two additional variables of prior course taking and performance. The first is a dichotomous variable that identifies enrollment in more advanced eighth grade math courses within each track. For students on the accelerated track, this measure captures enrollment in geometry or a higher level math course in eighth grade. And for students on the standard track, this includes enrollment in advanced or honors math 8 (not including algebra). I also include a categorical measure of prior course performance. This variable is based on students’ self-reports of their final grades in their eighth grade math courses according to the following grade scale: A = 90 to 100, B = 80 to 89, C = 70 to 79, D = 60 to 69, F = below 60, or class was not graded. Because of the small proportion of students who earned grades below C (i.e., D and F) or no grade, these are combined into one category. 9
Parent, Teacher, and Counselor Involvement
This study includes six variables that capture parent, teacher, and counselor involvement in the course placement process. Students were asked, “Since the beginning of the last school year (2008-2009), which of the following people have you talked with about which math courses to take this year?” From the answer options provided, I created three dichotomous variables that indicate if students talked about their ninth grade math course options with (1) a parent, (2) a favorite teacher, and (3) a school counselor. Students were also asked why they took their particular ninth grade math courses. Responses were used to create three dichotomous variables that indicate if students took the courses because (1) a parent encouraged them, (2) a teacher encouraged them, and (3) the school counselor suggested they take their particular math courses (see Appendix Table A1 for variable weighted means and proportions).
Sample and Analytic Strategy
The focus of this study is on advanced math course taking patterns among first-time ninth graders enrolled in U.S. public high schools. Students who were not enrolled in eighth grade during the prior school year were excluded from analyses (5.9 percent of the initial sample). Because private schools are largely exempt from district and state oversight and curricular polices, the sample was further restricted to students enrolled in public high schools. Thus, in line with Domina (2014) and Loveless (2013), any students enrolled in private high schools were excluded from analyses. 10 Because private schools were an oversampled sector in the HSLS, these students represent approximately 17.9 percent of the initial sample. Cases with missing values for the dependent variable were also excluded from analyses (8.7 percent of the initial sample). Missing values for independent variables were replaced using multiple imputation with chained equations that included the dependent variable as a model covariate, as well as the base-year student survey weight, creating 10 imputed data sets (Royston 2005; von Hippel 2007). 11 The analytic sample for this study is 14,350 students. 12
Analyses were completed in two stages. First, I used contingency tables to examine patterns of advanced math course taking. Specifically, I estimated the weighted distribution of students who took advanced math in ninth grade by race for two distinct groups: students who were on the accelerated math track in eighth grade and students who were on the standard track. Next, I used logistic regression with school fixed effects to capture within-school differences in advanced math course taking in ninth grade while accounting for school-level factors (Allison 2009). 13 Because fixed-effects regression models require that schools have variation in the dependent variable, the analytical sample for within school analysis is reduced to 13,390 students in 700 schools (means and proportions for within school sample are available in Appendix Table A2).
Instead of running separate regression models for each eighth grade math track, I used factor variables in Stata to estimate fully interactive difference in differences models (i.e., models that include an interaction term for each covariate) on the pooled sample with eighth grade math track serving as the moderator. In fully interactive models, main effects provide within-group estimates for the moderator category equal to zero (i.e. the reference category), and interaction terms provide estimates of variation between groups identified by the moderator. The main advantage of this model form is that it allows for tests of significance both within and between eighth grade math tracks.
Multivariate results are presented across six models. Model 1 provides baseline estimates for race. Model 2 controls for gender and SES. Model 3 accounts for prior academic performance. Model 4 brings in variables capturing interactions with parents, teachers, and counselors. And models 5 and 6 add significant interactions (at p < .05) between race and potential mechanisms. To evaluate change across models, I calculated the proportionate change in the average marginal effects across the same series of models estimated using the Stata module aextlogit (results available upon request) (Silva and Kemp 2016). 14 Finally, all analyses were conducted using the mi estimate command in Stata, which combines results across the 10 imputed data sets according to Ruben’s rules.
Results
Descriptive Statistics
The first column in Table 1 presents weighted estimates of advanced math course taking in ninth grade for students who were on the accelerated track in eighth grade. These percentages represent how likely students are to stay on the accelerated track. Altogether, about 77 percent of students on the accelerated track stayed on track in ninth grade, but disaggregated estimates reveal differences by race. White students (77 percent) and Southeast Asian students (76 percent) are about as likely to persist as the average student. Groups with lower levels of persistence include white Latinx students at 71 percent and nonblack Latinx students at 66 percent. And with about 60 percent taking advanced math in ninth grade, black and black Latinx students are the least likely to persist. Conversely, East Asian and South Asian students are the most likely to persist. About 84 percent of East Asian and 97 percent of South Asian students stayed on the accelerated track in ninth grade.
Weighted Percentages of Accelerated Math Course Taking in Ninth Grade by Track.

Source: High School Longitudinal Study of 2009, n = 14,350 (about 35 percent in the accelerated track and 65 percent in the standard track).
The second column of Table 1 presents weighted estimates of advanced course taking for students who did not take advanced math in eighth grade and were thus on the standard track. These percentages represent how likely these students are to get on the accelerated track in ninth grade, which about 10 percent were able to do. However, disaggregated estimates reveal less racial variation in upward mobility for some groups than in downward mobility. Estimates of getting on the accelerated track for white, black, and nonblack Latinx students fall within 2 percentage points of the overall average. For, both white Latinx and black Latinx students, they were more than 3 percentage points lower. However, 18 percent of East Asian, 14 percent of Southeast Asian, and 21 percent of South Asian students were able to get on the accelerated track in ninth grade, making Asian students, particularly East Asian and South Asian students, the clear exception.
Predicting Differences in Track Persistence
Next, I set aside between-school differences in course taking and focus my attention on within-school differences in the likelihood of staying on track. According to within-school estimates from Table 2, model 1A, both white Latinx and nonblack Latinx students have significantly lower odds (about .69 and .59, respectively) of staying on track than their white peers. The odds of staying on track are even lower for students from black racial subgroups: .44 for black students and .26 for black Latinx students, to be exact. In contrast, the odds of persisting for East Asian students are significantly higher than those of their white peers (about 1.43 times). The odds of staying on track are particularly high for South Asian students, at about 5.60 times those of their white peers.
Fixed-Effects Logit Models Predicting Advanced Math Course Taking in Ninth Grade for Students on the Accelerated Track.

Source: High School Longitudinal Study of 2009, within-school sample, 13,390 students in 700 public schools.
Note: The table presents main effects estimates from fully interactive logistic regression models with accelerated track set as the moderator reference category. Variable reference categories include white race and a grade of A. SES = socioeconomic status.
Significant differences at the .05 level (on the basis of interaction terms) compared with model estimates for standard track.
p < .05, **p < .01, and ***p < .001 (two tailed).
Model 2A adds controls for student background, which significantly predicts staying on track. Odds ratios for white Latinx and nonblack Latinx students are almost entirely explained by background characteristics, particularly SES. However, background factors account for only about 29 percent of the difference in persistence for black Latinx students and about 18 percent of the difference for black students. And they have almost no impact on the odds ratios for East Asian and South Asian students.
Model 3A adds controls for prior course level and performance, both which are significant predictors of staying on track. These factors provide some context for understanding the mechanisms behind significant racial differences in track persistence For example, accounting for prior performance reduces the initial gap between East Asian students and their white peers by nearly half, a change that also renders it statistically insignificant. However, academic factors, which account for about 19 percent of the gap for South Asian students, and about 10 percent of gaps for black and black Latinx students, clearly fall short of fully explaining differences by race. Prior academic factors appear to have little bearing on the odds of track persistence for black and black Latinx students (.55 and .44, respectively), which remain significantly lower than their white peers with similar backgrounds and academic profiles. And at the other end of this spectrum, the odds of staying on the accelerated track for South Asian students are still 4.02 times the odds of similarly situated white peers.
Model 4A adds variables that measure the involvement of parents, teachers, and counselors, which have varying effects on track persistence. Students who talked with either parents or teachers are more likely to stay on track. Selecting a course because of parent or teacher encouragement has an even stronger effect on persistence, while interacting with a counselor has no effect at all. Yet these interactions account for about 5 percent of the remaining racial gap for black Latinx students and none of the remaining racial gap for black or South Asian students (compared with their white peers).
Predicting Differences in Track Formation
Table 3 presents estimates of advanced math course taking in ninth grade for students previously on the standard track. Consistent with descriptive results, East Asian students have 1.75 times the odds, South Asian students have 2.33 times the odds, and Southeast Asian students have 1.58 times the odds of getting on the accelerated track in ninth grade compared with their white peers (model 1S). This is not the case for other racial groups, which on the basis of the absence of significant coefficients are no more or less likely to get on the accelerated track in ninth grade compared with their white peers. In model 2S, SES is also a significant predictor of accelerated track formation in ninth grade. However, racial differences in SES accounts for none of the differences in getting on track for Asian students.
Fixed-Effects Logit Models Predicting Advanced Math Course Taking in Ninth Grade for Students on the Standard Track.
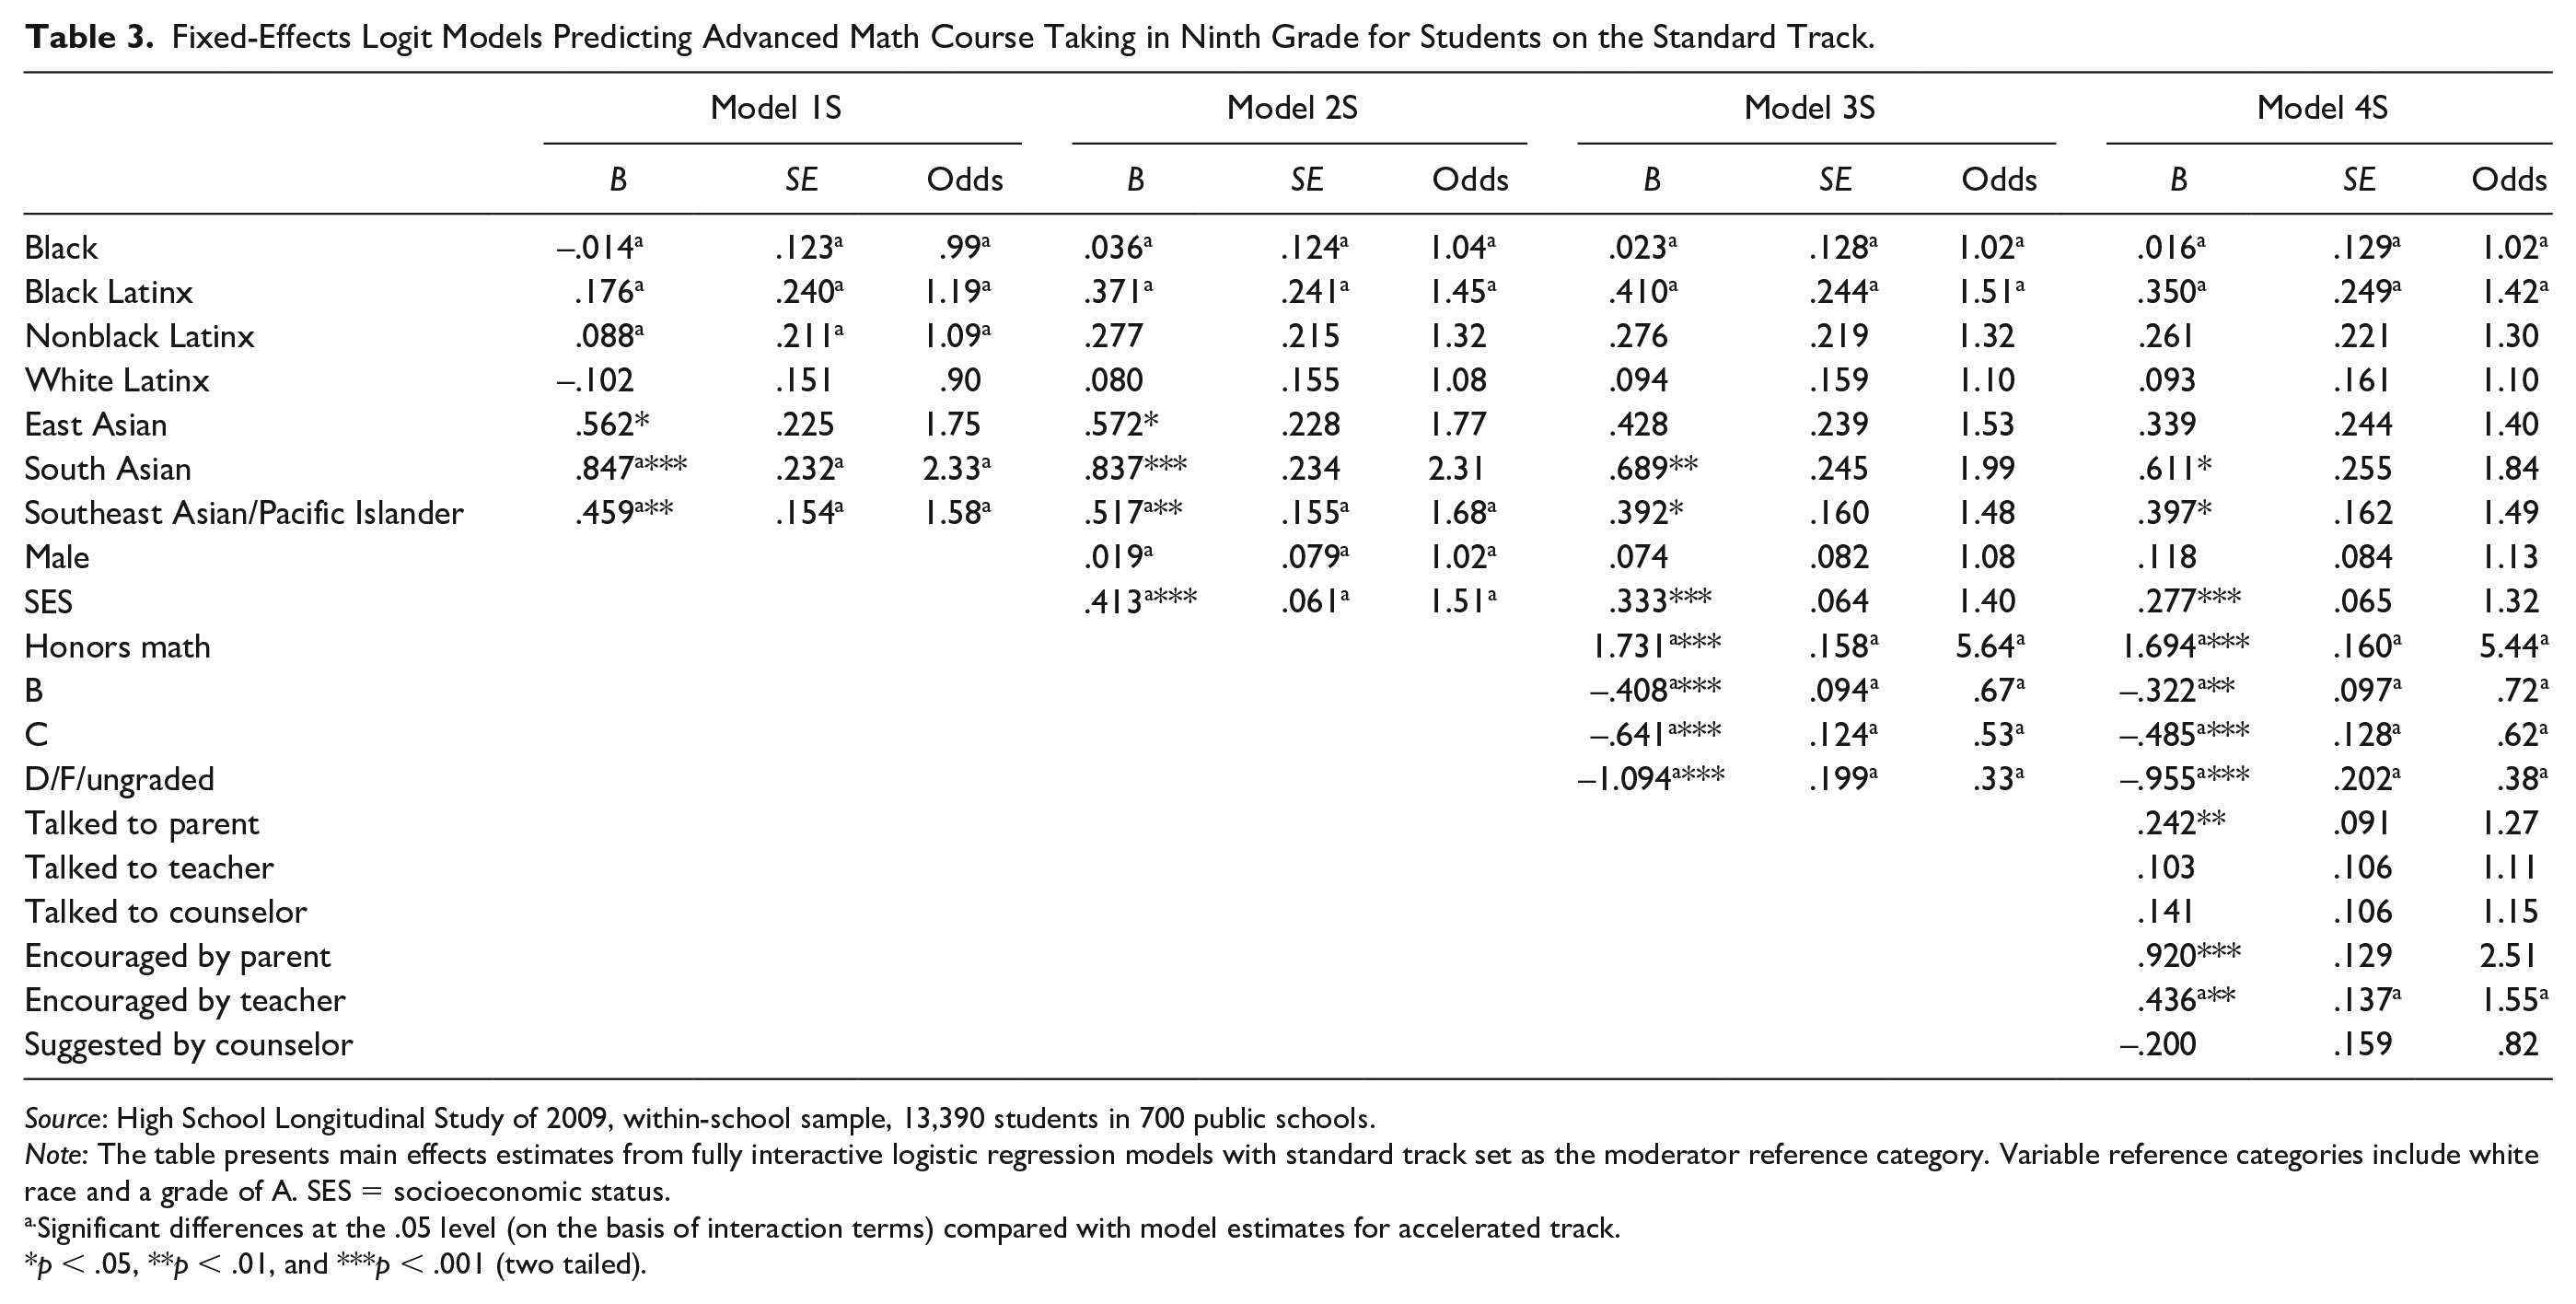
Source: High School Longitudinal Study of 2009, within-school sample, 13,390 students in 700 public schools.
Note: The table presents main effects estimates from fully interactive logistic regression models with standard track set as the moderator reference category. Variable reference categories include white race and a grade of A. SES = socioeconomic status.
Significant differences at the .05 level (on the basis of interaction terms) compared with model estimates for accelerated track.
p < .05, **p < .01, and ***p < .001 (two tailed).
In model 3S, both previous course level and grade are significant predictors of getting on the accelerated track in ninth grade. For example, students who took honors math in eighth grade had 5.64 times the odds of getting on to the accelerated math track in ninth grade. Yet controlling for previous academic factors yields only modest reductions in the gaps for East Asian, South Asian, and Southeast Asian students, who still have between 1.53 and 1.99 times the odds of taking advanced math in ninth grade than their white peers on the standard track. The reduction for East Asian students renders the coefficient insignificant; however, significant coefficients for South Asian and Southeast Asian students remain.
In model 4S, I turn my attention once again to the role of parents, teachers, and counselors. On the whole, these factors appear to be less important for predicting track formation than they were for track persistence. Nonetheless, both parent and teacher involvement emerge as significant predictors of getting on track. Of these, being encouraged by a parent, which is associated with 2.51 times the odds of getting on track, is by far the most substantively significant factor for whether a student on the standard track takes advanced math in ninth grade. Like models predicting track persistence, controlling for parent, teacher, and counselor involvement also explains a small portion of racial differences in track formation. For example, I find a 10 percent reduction in the likelihood of getting on track for South Asian students. However, South Asian students still have 1.49 times the odds, and Southeast Asian students have 1.84 times odds of getting on the accelerated track than their white peers.
Additional Considerations
An encouraging finding emerged from analyses of significant race interactions. Specifically, results from Table 4, model 5A, show that the small positive effect of talking with a favorite teacher on track persistence in Table 2 is actually a much larger effect experienced exclusively by black students. Specifically, black students on the accelerated track are the only group that benefits from talking with favorite teacher and have about 2.5 times the odds of staying on track when they did so. The interaction effect is also large enough to counter the black-white gap in persistence. This means that black students who talked with a favorite teacher have about the same odds of staying on track as their white peers, controlling for background, performance factors, and other interaction measures.
Significant Interactions from Fixed-Effects Logit Models Predicting Advanced Math Course Taking in Ninth Grade by Eighth Grade Math Track.

Source: High School Longitudinal Study of 2009, within-school sample, 13,390 students in 700 public schools.
Note: The table presents main and interactions effects estimates from fully interactive logistic regression models. Models also include controls for gender, socioeconomic status, advanced course, course grade, talked to parent, encouraged by parent, encouraged by teacher, and suggested by counselor.
Significant differences at the .05 level between eighth grade math tracks.
p < .05, **p < .01, and ***p < .001 (two tailed).
The effect of talking with a favorite teacher on advanced course taking for students on the standard math track is also moderated by race, though results from model 5S tell a different story. Although the small positive effect of talking with a favorite teacher on accelerated track formation remains, interaction terms show that white Latinx, black Latinx, and South Asian students actually experience negative returns to talking with a teacher. Indeed, talking with a teacher lowers their odds of getting on the accelerated track by 47 percent, 69 percent, and 76 percent, respectively.
Significant interaction effects related to school counselors add further complexity to this story. Up to this point, results for counselor variables have been both substantively and statistically insignificant. However, significant interactions for black Latinx students on the accelerated track highlight a specific instance in which counselors do have an effect on track persistence. As results from model 6A demonstrate, talking to a counselor about course options has a strong negative effect on track persistence for black Latinxs students. That is, black Latinx students who talked with counselors have more than 80 percent lower odds of staying on track than their white peers, whereas among black Latinxs who did not talk with counselors, the odds ratio is much smaller and statistically insignificant. 15
Discussion and Conclusion
This study is the first to use national-level data to investigate advanced math course-taking patterns by race during the transition to high school, contributing to a small but growing body of empirical research on the topic. I build upon and extend previous research on accelerated track formation in middle school by examining pathways to advanced math in ninth grade for two groups of students: those who took advanced math courses in eighth grade (accelerated track) and those who took standard math courses (standard track). The findings advance our understanding of advanced math trajectories in several important ways.
First, the results reveal a substantial amount of track mobility: fewer students stayed on the accelerated track during the transition to high school than their previous performance would lead us to expect. According to McFarland (2006), students typically retake classes when they earn failing grades, while downward moves (to lower level coursework) are associated with earning lower level passing grades. When disaggregated by eighth grade math track, I find that about 7 percent of students on the accelerated track earned below a C in their prior math courses, and just less than 14 percent earned a C. Yet nearly one in four students on this track either retook algebra I or took lower level math courses in ninth grade. This means that at best, one in six students who experienced downward mobility did so despite having earned good grades (A or B) in their prior math courses. Also, students on the standard track in eighth grade were much less likely than students on the accelerated track to take advanced math in ninth grade. However, about 10 percent of these students established accelerated math trajectories in ninth grade, which is in line with estimates of upward mobility in prior research (e.g., Hallinan 1996; Lucas 1999; McFarland 2006).
Second, the results show significant racial differences in the likelihood of both staying and getting on the accelerated track, some of which are not accounted for by prior course taking or performance. Specifically, I find that black and black Latinx students are less likely to stay on the accelerated track between eighth and ninth grade than their white peers. Both racial gaps in persistence remain largely unexplained after accounting for prior course performance and parent, teacher, and counselor involvement. These patterns, which occur only among students on the accelerated track, are consistent with prior research that identified students whose academic status is inconsistent with the stereotypes ascribed to them (e.g., high-achieving black students) as more susceptible to academic declines during the transition to high school (Sutton et al. 2018).
The results also show that Asian students are either as likely as or more likely than their white peers to take advanced math classes. I find that South Asian students are more likely to remain on the accelerated track than their white peers, even after accounting for background, academic factors, and interactions with parents, teachers, and counselors. Moreover, East Asian, South Asian, and Southeast Asian students who were on the standard track are all more likely to get on the accelerated track than their white peers. Racial differences in prior performance explain just less than a quarter of the gap in track formation for East Asian students, a fifth of the gap for South Asian students, and close to a sixth of the gap for Southeast Asian students. Racial differences in parent and teacher involvement also contribute to racial differences in track formation for East Asian and South Asian students, though the latter remains statistically significant. However, parent and teacher involvement explain almost none of the gap for Southeast Asian students, which also remains significant.
Third, parent, teacher, and counselor involvement moderates racial gaps in important ways. I find that talking to a favorite teacher about math course options is particularly important for track persistence among black students. This effect is large enough to close the black-white gap in persistence by increasing the likelihood of staying on the accelerated track among black students to roughly the same level as their white peers. This finding highlights the importance of teachers for promoting black student success and reducing racial inequality in advanced course placements. Results for black Latinx students, however, stand in stark contrast. Specifically, I find that talking to a counselor dramatically reduces track persistence for black Latinx students. Among students on the standard track, I find that talking with a favorite teacher significantly lowers the likelihood of getting on the advanced track in ninth grade for black Latinxs, a pattern that is also present for Southeast Asian students, and to lesser extent for white Latinx students. Otherwise, I find no significant relationships between counselor recommendations and advanced math course taking or between talking with a counselor and course taking among students on the standard track. Given counselors’ limited and infrequent contact with students (Bridgeland and Bruce 2011), these findings for counselor involvement are not very surprising. These patterns highlight the differential effects of teacher and counselor involvement and their potential impact on racial inequality in advanced course taking.
Limitations
This study is not without limitations. Math test scores are not included in the analyses presented here because of problems with temporal ordering: algebraic reasoning tests created for HSLS were administered in the fall of ninth grade and thus were not yet available when ninth grade math course placements were being decided. However, results from an alternative model 2 with an additional control for math test scores (in quintiles), available in Appendix Table A3, show that the racial gaps described above are for the most part robust to the inclusion of test scores. Supplementary results also show that racial differences in test scores in the fall of ninth grade account for about 40 percent of the gap in persistence between black and white students. Because reductions in gaps between model 2 and alternative model 2 are among students with similar backgrounds, prior course taking, and math grades, this suggests that the effect of test scores on the black-white gap is more likely due to racial differences in opportunities to learn during middle school than to a growing presence of unprepared students in algebra I.
In addition, questions regarding interaction with parents, teachers, and counselors in the HSLS are both limited and retrospective. As a result, I am unable to discern the specific factors, contexts, or mechanisms that may explain why parents, teachers, and counselors influence track formation and mobility in the ways described here. For example, there is still much to learn about who black students regard as favorite teachers, how discussions about course taking develop, and why these interactions are uniquely important for black students on the accelerated track. I am also unable to discern whether the negative effect of talking with a counselor for black Latinx students is due to counselors’ personal beliefs, a greater reliance on cultural cues because of their limited contact with students, judgments regarding the quality of math instruction in feeder middle schools attended by these students, or simply the absence of action-guiding advice from counselors, which ultimately relegates decision making to parents (Sattin-Bajaj et al. 2018). Hence, this area of research would benefit substantially from more in-depth studies of the roles of teachers and counselors. Communication between parents and school officials also deserves greater attention, especially given the impact of the parent-child relationship for promoting continuity between middle and high school (Crosnoe 2009). The short- and long-term implications of track mobility should also be a priority for future research.
Implications
This study reveals troubling patterns of advanced course taking and track mobility during the transition to high school. Although students on the accelerated track are substantially more likely than their peers on the standard track to take advanced math in ninth grade, they are also at risk for curricular disruption during the transition to high school. In an ideal world, we would expect that students who have met teacher expectations and mastered the curriculum would persist on the accelerated track (Riegle-Crumb and Grodsky 2010). Instead, I find that the transition to high school disrupts some math trajectories, such that even strong academic performance may not be enough to retain students on the accelerated math track in ninth grade.
This study improves our understanding of differences in track persistence and formation during the transition to high school, including how students from certain racial groups are disproportionately either getting on track or being derailed. On the accelerated track, black and black Latinx students are more likely than white and Asian students to be displaced. At the same time, Asian students, particularly South Asian and Southeast Asian students, are overrepresented among those rising from the standard track to take their place. In other words, the transition to high school is also a period when significant curricular resorting occurs. This resorting magnifies racial gaps in advanced math trajectories and reinforces the racial schema used to justify entrenched racial inequalities in advanced course taking.
This study also exposes the intersectional complexity of advanced math course taking during the transition to high school for students within the Latinx and Asian panethnic umbrellas. Although Asian students are collectively more likely to get on the advanced track in ninth grade, South Asian students are more likely to stay on the advanced track than East Asian and Southeast Asian students. Notably, this advantage among South Asian students is not explained by either background characteristics or prior academic performance. And disaggregating Latinx students by race highlights the unique experience of black Latinx students on the advanced math track, who face a similar level of disadvantage as other black students. The fact that black Latinx students are typically aggregated with nonblack Latinx students of color and white Latinx students may help explain the negative but nonsignificant coefficients for Latinx students in prior research (e.g., Sutton et al. 2018).
The persistence of racial inequality in access to advanced math not only reinforces racial stereotypes and notions of a racial hierarchy of academic ability but also contributes to disparities across a host of postsecondary outcomes. State and district efforts to align curricula and increase access to rigorous courses across middle schools may help reduce gaps in preparation. Establishing state and local policies that facilitate the transfer of course credits may help reduce track displacement during the transition to high school. Involving teachers in the course placement process may improve the identification of students who might benefit from or be hindered by more advanced coursework. Finally, policies that promote supportive teacher-student relationships may attenuate some of these trends.
Footnotes
Appendix
Interactions from Fixed-Effects Logit Models Predicting Advanced Math Course Taking in Ninth Grade for Students on the Standard Track.

| Model 5S |
Model 6S |
Model 7S |
Model 8S |
Model 9S |
Model 10S |
|||||||
|---|---|---|---|---|---|---|---|---|---|---|---|---|
| B | SE | B | SE | B | SE | B | SE | B | SE | B | SE | |
| Black | –.035 | .200 | .025 | .145 | .019 | .144 | .004 | .137 | .059 | .136 | .072 | .133 |
| Black Latinx | .735* | .356 | .639* | .269 | .407 | .276 | .503 | .261 | .482 | .255 | .369 | .261 |
| Nonblack Latinx | .360 | .308 | .351 | .242 | .318 | .237 | .178 | .247 | .203 | .241 | .355 | .229 |
| White Latinx | .288 | .234 | .261 | .174 | .051 | .181 | .060 | .173 | .162 | .168 | .146 | .166 |
| East Asian | .424 | .444 | .267 | .297 | .542 | .279 | .133 | .301 | .272 | .281 | .426 | .259 |
| South Asian | .644 | .486 | .895** | .277 | .595* | .295 | .617* | .297 | .651* | .281 | .644* | .267 |
| Southeast Asian/Pacific Islander | .480* | .233 | .463* | .182 | .392* | .180 | .400* | .176 | .381* | .176 | .450** | .169 |
| Talked to parent | .232 | .122 | ||||||||||
| Talk to teacher | .280* | .136 | ||||||||||
| Talked to counselor | .167 | .137 | ||||||||||
| Encouraged by parent | .859*** | .164 | ||||||||||
| Encouraged by teacher | .519** | .169 | ||||||||||
| Suggested by counselor | .069 | .197 | ||||||||||
| Interaction terms | ||||||||||||
| × Black | .108 | .249 | –.021 | .280 | –.025 | .286 | .101 | .351 | –.359 | .380 | –.692 | .503 |
| × Black Latinx | –.207 | .494 | –1.441* | .700 | –.267 | .627 | –1.128 | .787 | –1.511 | .979 | –.127 | .853 |
| × Nonblack Latinx | –.017 | .442 | –.508 | .602 | –.400 | .675 | .471 | .531 | .398 | .606 | –1.096 | .870 |
| × White Latinx | –.058 | .311 | –.911* | .433 | .193 | .362 | .276 | .439 | –.616 | .505 | –.727 | .616 |
| × East Asian | –.237 | .524 | .197 | .519 | –.768 | .559 | .675 | .529 | .263 | .577 | –.758 | .755 |
| × South Asian | .367 | .592 | –1.704* | .841 | .075 | .601 | .017 | .570 | –.226 | .637 | –.342 | .902 |
| × Southeast Asian/Pacific Islander | –.039 | .325 | –.308 | .378 | .046 | .395 | –.012 | .438 | .099 | .432 | –.580 | .562 |
Source: High School Longitudinal Study of 2009, within-school sample, 13,390 students in 700 public schools.
Note: The table presents main and interactions effects estimates from fully interactive logistic regression models with standard track set as the moderator reference category. Models also include controls for gender, socioeconomic status, advanced course, course grade, talked to parent, encouraged by parent, encouraged by teacher, and suggested by counselor.
p < .05, **p < .01, and ***p < .001 (two tailed).
1
Although many districts encourage (and some require) students to take courses beyond algebra II, these courses are not required for graduation in most states.
2
3
Preliminary review of HSLS transcript data revealed inconsistencies in the recording of eighth grade courses and course credit and, in many cases, no information at all. This information was more likely to be missing if the student did not receive high school credit for the course(s) in question.
4
Findings from a recent validity study using HSLS data (Rosen, Porter, and Rogers 2017) suggest that students are reasonably good reporters of the courses they have taken.
5
On the basis of transcript data, the six students who selected statistics or probability were actually enrolled in integrated math I courses that incorporated statistics. As such, these students were categorized as not being enrolled in advanced math.
6
High school transcripts include information on math course taking and course performance in eighth grade only if the course was awarded high school credit. Even then, it is often unclear whether the credit is for an actual course or a placement test. Hence, students’ self-reports provided a more accurate picture of eighth grade course taking.
7
8
These changes increased the proportion of students taking advanced math in ninth grade by less than 2 percentage points and had no measurable impact on the distribution for advanced math in eighth grade. Models estimated on the outcome variable without these transcript recodes produce comparable findings with those described below.
9
Results from preliminary analyses demonstrated similar effects for students who reported earning D’s, F’s, or no grade in their eighth grade math course. According to Rosen et al. (2017), grade inflation in the HSLS does not appear to vary by race but is more likely to occur among lower performing students. In addition to separating students by math track, I also included math test scores from fall of ninth grade in supplementary models (see Appendix ![]() ) to mitigate the latter issue.
) to mitigate the latter issue.
10
11
Imputation was used to replace about 600 missing values in total. This includes about 10 missing values for race; 70 missing values for eighth grade math track; 90 missing values for encouraged by parent, encouraged by teacher, and suggested by counselor; 160 missing values for course grade; and 250 missing values for talked to parent, talked to teacher, and talked to counselor.
12
Per National Center for Education Statistics rules regarding the use and dissemination of findings from analyses of restricted data, all sample sizes are rounded to the nearest tenth.
13
In supplementary analyses, I find that more than three quarters of the variation in advanced course taking in ninth grade occurs within schools. Because course placements are ultimately a school-level decision, analyses focus on within-school differences in advanced math course taking.