
Abstract
The coronavirus disease 2019 (COVID-19) pandemic has introduced manifold dislocations in Americans’ lives. Using novel survey data samples of Supplemental Nutritional Assistance Program (SNAP) recipients and U.S. Census Bureau Household Pulse Survey data, the authors examine the incidence of COVID-19-induced hardships among low-income/benefits-eligible households during the early months of the crisis. Five repeated online surveys of SNAP recipients measured perceived and realized housing insecurity, food scarcity, new debt accrual, and recent job loss. These data were supplemented by creating parallel measures among all low-income households from Household Pulse Survey. Food insecurity and debt accrual grew more prevalent between from April to June 2020, and job losses compounded. Although the magnitude of racial differences varies across indicators and data sources, black respondents fared consistently worse than non-Hispanic whites in both survey data sets, and Latinx respondents fared worse than whites in the Household Pulse Survey. These results provide early systematic evidence on the impact of the COVID-19 crisis on poor Americans and racial disparities therein.
The economic shock of the coronavirus disease 2019 (COVID-19) pandemic is unprecedented in the postwar era. During the three weeks between March 22 and April 11, 2020, total new unemployment claims in the United States totaled more than 22 million, a loss approximately equal to the entire net job gains during the decadelong expansion following the Great Recession of 2008 and 2009. Similarly, the 9.5 percent year-over-year decline in gross domestic product during the second quarter (April to June) was equivalent to the cumulative decline across the entirety of the Great Recession. Although aggregate data and journalistic accounts highlight the scale and severity of COVID-19’s socioeconomic impact, we are only beginning to understand the manifold and differential effects on households across the social structure.
In this article we focus on the population of poorer Americans. Even before the COVID-19 crisis hit, tens of millions of households were living in positions of economic precarity (e.g., Desmond and Western 2018), leaving them particularly vulnerable to the cascading effects of COVID-19-induced disruptions (Cohen 2020). In 2019, a year when the official U-3 unemployment rate stood at record low levels, approximately one in eight Americans lived below the poverty line, and 40 million received food assistance benefits at some point. Given the large number of low-income Americans who were already situated in a tenuous position before the crisis, it is vital for scholars, policy makers, and the broader public to understand the strains these individuals and families are experiencing as the pandemic continues to unfold. Research on other crises and natural disasters documents the disproportionate impact such shocks have on the most disadvantaged segments of the population (Cochrane 1975; Elliott and Pais 2006; Logan, Issar and Xu 2016).
We draw on new survey data to provide descriptive evidence on the changing incidence of socioeconomic dislocations facing low-income Americans across a 10-week period from late March 2020 through mid-June 2020. We generated weekly and/or bimonthly estimates of the incidence of labor income shocks, deepening financial indebtedness, housing instability, and food insecurity for the low-income/benefits-eligible population as a whole and by racial/ethnic subgroups. 1 The latter breakdown is especially significant given a large body of research on the effects of concentrated disadvantage and network inequality in magnifying the socioeconomic vulnerabilities facing poor black Americans (e.g., Heflin and Pattillo 2006; Massey and Brodmann 2014; O’Brien 2012). Questions about the pandemic’s potentially disparate economic impact are given further impetus by the elevated rates of COVID-19 infections, hospitalizations, and case mortality among black and Latinx populations, disparities that exist even within socioeconomic strata (Centers for Medicare and Medicaid Services 2020). Our analysis thus considers whether the racial distribution of COVID-19-induced socioeconomic strains among low-income Americans mirrors the pandemic’s racially disparate health impact.
We use data from two different tracking surveys. Our primary data source is a unique bimonthly survey series of Supplemental Nutritional Assistance Program (SNAP) recipients. These are drawn from samples recruited through a cell phone app for managing SNAP benefits (FreshEBT). FreshEBT’s user base was more than 2 million before the COVID-19 crisis. The app’s operator, Propel, Inc., supplied us with access to deidentified, anonymous responses, which we then reweighted using administrative data from the U.S. Department of Agriculture (2019) to match the demographic characteristics of pre-COVID-19 SNAP recipients nationally.
We further supplemented these data with additional comparable indicators constructed from the U.S. Census Bureau’s publicly available Household Pulse Survey. The Household Pulse Survey covers a shorter time period, beginning only in late April 2020. However, because the Household Pulse Survey is drawn from representative household samples rather than solely from program recipients, it offers more reliable sample coverage of the overall low-income population, particularly with elderly Americans, working-age persons without children, and Latinx persons. 2 Although neither data source permits comparisons with the pre-COVID-19 period, together they provide a vantage into the evolving patterns of insecurity experienced by poor Americans as the early stages of the COVID-19 crisis progressed.
We find that low-income respondents in both surveys saw pronounced upticks in the frequency of labor market, financial, and food insecurity (but not housing insecurity) from April to June. More pointedly, we also find significant racial disparities in the crisis’s impact within the low-income population. Although the magnitude of racial differences varied across indicators and data sources, black respondents fared consistently worse than non-Hispanic whites across in both survey data sets, and Latinx respondents fared worse than whites in the Household Pulse Survey. These patterns suggest that the documented racial disparities in COVID-19 infection rates and case mortality among blacks and Latinxs (Gross et al. 2020; Yancy 2020) have also been coupled with a disparate economic impact on these same groups, even within the lower income subpopulations studied here.
Background
Low-income Americans represent a large and heterogenous population (Iceland 2013; Moffitt 2015). During 2018, 12.8 percent of the population fell below the poverty line according to the Census Bureau’s supplemental poverty definition, which takes account of both in-kind and cash government transfers. An additional 9 million would have been under the poverty line if not for the purchasing power provided by SNAP, Supplemental Security Income (SSI), and housing subsidy safety-net programs for which they qualified. The poor population includes the deeply and persistently impoverished (Edin and Schaeffer 2015), the working poor (Brady, Baker, and Finnigan 2013), and a rapidly growing population of working-age adults on disability or otherwise out of the labor market (Bauer, Moss, and Shambaugh 2019). Experiences of poverty and near poverty also vary in their longevity and recurrence. Edwards (2015) documented three typical temporal patterns, which she termed churning or recurrent short-term spells, chronic long-term poverty, and single crisis-driven spells driven by increasingly privatized risk-bearing (Hacker 2006; Western et al. 2012).
Although poverty is defined and measured for administrative purposes using income (or income and assets), recent scholarship argues that the experienced condition of poverty should be conceived more broadly: poverty is not simply lack of income but an interrelated set of insecurities that hinder the ability of persons to satisfy basic needs (Desmond and Gershenson 2016; Desmond and Western 2018). This includes an inability to secure stable income, housing, and food, as well as a lack of assets to help weather short-term shocks, and legal marginalization that impedes access to other institutional resources.
Even during periods of low unemployment, the U.S. labor market is characterized by high levels of insecurity across numerous indicators (Kalleberg 2018). Income risks are especially pronounced among the working poor (Western et al. 2012), who tend to be concentrated in low-wage, part-time hourly jobs with few protective benefits. Low-wage workers have faced growing volatility because of widening use of practices that shunt variable labor demand risk onto workers, including dynamic work schedules (Schneider and Harknett 2017), on-call arrangements, and “gig” contracts.
Not surprisingly, financial balance sheet distress is endemic among low-income households. Unaffordable debts can be seen as both a source of insecurity, as well as a mechanism that compounds other insecurities by depriving households of the ability to cushion short-term shocks or access affordable credit. Data from the 2016 Survey of Income and Program Participation reveal that more than one third (34 percent) of SNAP recipients had zero or negative net worth, and the median value of liquid assets was $401 (U.S. Census Bureau 2019, Tables 4 and 1). Despite having less access to conventional consumer credit, poor Americans experience high frequency of debt in collections, largely due to utility bills, medical debts, and unpaid fines and fees (parking tickets, tolls, legal penalties and fees) (Smith, Campbell, and Kavanaugh 2017). According to data from the Consumer Financial Protection Bureau (2014), 61 percent of households with income below $20,000 had medical debt in collections on their credit reports, and more than 35 percent had negative marks for utility bills. Such non-loan-related debts have been found to be a strong predictor of deeper financial distress (Epic Collaborative 2019). Even small debts and fines, especially in conjunction with compounding fees and penalties, can unravel the tenuous financial balance on which poor Americans’ lives often hang (Seefeldt 2015; Tach and Greene 2014).
Research studies and official statistics also highlight the continuing prevalence of material hardship risks among low-income households, despite the growth of in-kind assistance programs in recent decades. In 2018, 35.3 percent of households below the federal poverty line faced food insecurity at some point during the year, according to the official definition used by the Department of Agriculture (Coleman-Jensen et al. 2019). No such official statistics exist for housing insecurity, but on the basis of carefully devised multifactorial measures, Cox et al. (2017, Table 13) estimated that between 21 percent and 35 percent of those below the poverty line face severe insecurity (including literal homelessness), while an additional 55 percent to 59 percent face more moderate housing insecurity.
Building on notion that poverty is structured by multiple intersecting insecurities (Desmond and Western 2018; Hill et al. 2017), in the present analysis we gauge the extent to which the early months of the COVID-19 crisis have upended the already vulnerable livelihoods of poor households. Our analysis quantifies these short-term effects by focusing on four aspects of precariousness and their cooccurrence: experienced labor market displacement, experienced food and medicine insecurity, experienced or perceived or expected near-term housing insecurity, and experienced accrual of new debts (e.g., unpaid utility bills) that are likely to induce future financial strain.
Research Design and Data
Data Sources
We draw on two distinct survey data sets to measure changes in the relative prevalence of socioeconomic insecurities among low-income Americans. Each data set brings some methodological advantages and disadvantages. Our primary data source is a nonpublic tracking survey series of benefit recipients, which was acquired from Propel. It includes more extensive temporal coverage during the early weeks of the COVID-19-induced shutdowns, and it allows us to measure more dimensions of insecurity. However, eligibility restrictions and enrollment barriers make SNAP recipients a selective sub-subset of low-income Americans. Furthermore, the fact that samples are drawn from smartphone app users introduces additional sample complications. 3 Hence we also draw on public-use microdata from the new Census Bureau Household Pulse Survey. The Household Pulse Survey is based on large, weekly national household probability samples. The data are publicly available, and they allow us to define prior-year low-income status (2019 income <130 percent of the federal poverty level) directly rather than using program participation as a proxy. However, the Household Pulse Survey began coverage only in late April 2020, well into the pandemic.
The Propel data series comprises five repeated cross-sectional tracking surveys, which were conducted April 4 and 5, April 12 and 13, April 30 and May 1, June 1 to 3, and June 14 to 16, 2020. The samples are drawn from the population of SNAP (formerly known as the Food Stamp Program) recipients. SNAP covers the vast majority of the low-income documented population in the United States. Approximately 12 percent of Americans were beneficiaries at some point in 2018, which amounts to more than 90 percent of those who fell below the poverty line. SNAP coverage is tilted toward families with children, covering 30 percent of all U.S. children younger than 11 years (USDA 2019). 4 The surveys were created and administered by a company, Propel, that operates a widely used budgeting app (FreshEBT) for food assistance recipients to track and manage their SNAP and Temporary Assistance for Needy Families benefits. Prior to the COVID-19 pandemic, FreshEBT maintained approximately 2 million active user accounts at any time. Propel administered anonymous surveys for internal research purposes to understand the needs of their users but also made anonymized extracts available to us for scientific analysis. The surveys contain self-reported information on respondents’ current socioeconomic conditions and how they perceived changes in their financial situations as a result of COVID-19. 5 Because the samples are drawn from the population of means-tested program recipients, they capture only those low-income persons who are eligible and have successfully navigated the red tape of the safety net (Moynihan and Herd 2010).
Respondents were recruited through an invitation link that appeared on the home screen of a random subset of FreshEBT app users for approximately 36 to 48 hours during each bimonthly wave. Invitations were sent to 10,000 to 24,000 users per wave. However, given the short window of visibility, it is likely that many invited users never saw the invitation link. There were no participation incentives. The completion rate among those who clicked on the link was averaged 57 percent across the survey waves. Incomplete cases were automatically dropped by the survey tool. 6
Sample Composition, Weighting, and Drift
It is important to clarify that this research is designed to capture the effects of the crisis on the population of Americans who were already low income/benefits eligible before the COVID-19 crisis began, rather than track the enlargement of the benefits-eligible population as a result of the crisis.
In the case of the Household Pulse Survey data, this is straightforward. Here we simply restrict the analytic sample to those whose reported that prior-year (2019) gross income fell below the federal SNAP income eligibility requirement (<130 percent of the federal poverty level for a given household size). We then apply the Census Bureau–calculated probability weights. This sample thus captures respondents whose low-income status would make them eligible for SNAP benefits, even though many may be ineligible in practice on the basis of other criteria such as work requirements or documentation status.
Whereas the Household Pulse Survey subsample targets the low-income/benefits-eligible population, the Propel sample targets the population of SNAP enrollees. We developed custom probability weights to render each of the Propel samples demographically representative of the (pre-COVID-19) SNAP recipient population. Specifically, we used a raking procedure and published administrative data on the demographic characteristics of SNAP recipients in 2018 from the Department of Agriculture to reweight the Propel samples on the following characteristics: race, gender, age, region of residence, whether the respondent lived with children younger than 18, whether the respondent lived alone or with other people, and whether the respondent received SSI or Social Security Disability Insurance (SSDI). Our demographic categories reflect the most detailed available breakdowns of SNAP beneficiary groups in the Department of Agriculture’s 2018 SNAP beneficiaries profile. Weights were applied separately to each survey wave. We compare the unweighted demographic characteristics of the Propel samples with the underlying population of SNAP beneficiaries in Table 1.
Population and Survey Sample Characteristics.

Despite the use of poststratification weights, the samples may still suffer from endogenous response bias, which is a common issue in Internet-based surveys (Loosveldt and Sonck 2008). For instance, persons who lost jobs will likely have more time available to respond to surveys. Moreover, because this survey was administered through an app for smartphones, the usual concerns about unequal access to technology apply here. For example, the number of elderly respondents in the Propel surveys is much lower than in the overall SNAP population, and those elderly respondents with access to a smartphone app may not accurately represent the average experiences of elderly SNAP beneficiaries (Loosveldt and Sonck 2008; Yeager et al. 2011). Some research on Internet-based surveys suggests that although the point estimates tend to be less externally valid than probabilistic survey sample estimates, they still tend to produce valid estimates of the conditional associations between variables (Batty et al. 2020). So long as we make the reasonable assumption that sampling biases are constant over time and groups, our focal estimates of relative trends and between-group disparities therein will be unbiased.
Finally, it is important to note that data gathered through repeated samples of online platforms such as FreshEBT can be subject to drift as a result of compositional shift in the user base (Salganik 2017). This is especially important in the present case given the sudden rise of applications for food and unemployment benefits as a result of the crisis. Many of those newly eligible for benefits likely differed in observable and unobservable ways from the population of pre-COVID-19 recipients. National-level data on the rise in SNAP applications are not yet available, but individual states, including Texas, Utah, Alabama, Vermont, California, and Connecticut, have all reported much greater numbers of SNAP applications than usual during March. Alabama’s online applications rose by 155 percent in the first week of April. Vermont’s weekly average for applications grew from 390 applications to 2,000 during the first week of April.
Concerns about sample drift are mitigated for the first three Propel surveys (early, middle, and late April) given long administrative lag times for SNAP application processing. In other words, those early surveys capture the period during which pandemic-fueled shutdowns were already affecting Americans’ economic livelihoods, but before the composition of benefit recipients had been transformed by the crisis. 7 We confirmed relative invariance in the distributions of observed respondent characteristic across the first three analytical survey waves and between the analytic samples and an earlier (pre-COVID-19) user demographic survey conducted by Propel during the first week of March 2020. For the fourth and fifth Propel surveys in late May and mid-June, we were able to use additional screening questions to explicitly exclude new beneficiaries who first became eligible for SNAP benefits after March 2020.
Table 1 compares characteristics of the SNAP population circa 2018 with Propel’s pre-COVID-19 user base and with the unweighted characteristics of the three post-COVID-19 analytic samples. Propel’s user base differs from the overall population of SNAP beneficiaries in some important respects. Propel’s user base skews more heavily toward women who are heads of households with children. Individuals with other benefits beyond SNAP tend to use the app more consistently over time. Propel’s user base also has a lower proportion of elderly (≥65 years of age) SNAP beneficiaries than the national average. This is not surprising, given that FreshEBT is an app for smartphones, and smartphones have a much lower adoption rate among elderly users. Propel’s user population contains more multiperson households compared with individuals living alone than SNAP’s beneficiary population. And finally, Propel’s user base has a higher proportion of SSI or SSDI beneficiaries than SNAP’s overall population does. Because the surveys were run exclusively through Propel’s English-language version of the app for smartphones, our samples capture a lower share of Spanish-speaking users. Finally, although we cannot measure these directly, we suspect that Propel’s smartphone-owning user base is less likely to be located in rural areas and less likely to be in severe poverty compared with the overall SNAP population.
Compared with the baseline March demographic survey, the COVID-19 surveys include a significantly greater proportion of black respondents and a lower proportion of white and other-race respondents. 8 The COVID-19 surveys also had a lower proportion of male respondents compared with the baseline demographic survey. The proportion of elderly respondents remained consistent in the COVID-19 surveys and the demographic survey, but the proportion of 18- to 35-year-olds was between .14 and .23 higher in the COVID-19 surveys than the proportion of 18- to 35-year-olds in the demographic survey. As a result, 36- to 59-year-olds represent a smaller proportion of respondents in the COVID-19 surveys than they did in the demographic survey. Families were a larger proportion of respondents across all COVID-19 surveys by .15 or more compared with the demographic survey. Individuals living alone were a smaller proportion of the overall respondents in the COVID-19 surveys compared with the demographic survey. The proportion of respondents receiving SSI or SSDI was consistent between the demographic survey and the COVID-19 surveys.
The unweighted sample characteristics were relatively stable across the focal COVID-19 surveys. The proportions of Asian, black, Latinx, other, and white respondents remained similar. 9 The proportions of male and female respondents also remained within a range of 2 to 4 percentage points in all three surveys. The population of elderly (≥60 years of age) respondents remained steadily low. There was some variation in the proportion of 18- to 35-year-old versus 36- to 59-year-old users across the three surveys, but the 18- to 35-year-old user group consistently accounted for more than 55 percent of the sample. The proportion of households with children compared with those without children remained within 2 percentage points across all three samples (roughly .88/.12). The ratio of households with multiple individuals compared with individuals living alone was approximately .90 to .10. SSI or SSDI recipients represented 28 percent of the sample across all three surveys.
Finally, the regional distribution among the survey respondents was consistent for New England; the central states (Idaho, Kansas, Nebraska, North Dakota, South Dakota, Montana, and Wyoming); the Pacific coast (California, Nevada, Oregon, and Washington); Puerto Rico, Hawaii, and Alaska; and the Southwest (Arizona, Colorado, New Mexico, Oklahoma, Texas, and Utah). The other three regional groups represent the largest proportion of respondents, and they fluctuated within a range of .10. These regions include the mid-Atlantic (Delaware, Maryland, New Jersey, New York, Pennsylvania, Virginia, and West Virginia), the Midwest (Illinois, Indiana, Iowa, Michigan, Minnesota, Missouri, Ohio, and Wisconsin), and the Southeast (Alabama, Arkansas, Florida, Georgia, Kentucky, Louisiana, Mississippi, North Carolina, South Carolina, and Tennessee).
Outcome Variable Measures
We focus on four dimensions of precarity amid the COVID-19 crisis. Where possible, our measurement approach conceptualizes insecurity as both realized and prospective risks by combining reports of recent occurrences and respondents’ subjective expectations of likely near-term occurrences. The four measures created from the Propel data are (1) experienced housing instability and/or perceived high likelihood of near-term instability, (2) experienced job loss during the COVID-19 shutdown, (3) debt accrued from missed rent or bill payments and/or looming debt accrual due to intended nonpayment of upcoming bills due, and (4) experienced food insecurity since the COVID-19 crisis began. We are able to create nearly comparable measures from the Household Pulse Survey for labor income loss and food insecurity, but not debt accrual or housing instability. Hence our analysis of Household Pulse Survey data is confined to the former two measures.
For housing insecurity, the COVID-19 surveys asked respondents if they had stable housing and if they believed that their housing would be stable after that 30-day period. We coded as housing insecure those without stable housing and those who rated their likelihood of losing their current housing within the next 30 days as almost certain or very likely (using a five-category scale). Unlike the other indicators, the housing insecurity measure incorporates both a subjective/prospective component and an objective/retrospective component. It should thus be interpreted as a metric of perceived insecurity rather than actual rates of dislocation.
To estimate labor market insecurity during the COVID-19 shutdown, we focused on recent changes in work status among those who had paid work at some point in 2020 or 2019. We labeled those who had lost their jobs in the COVID-19 shutdown as those who listed their last day of work as February 24, 2020, or later or that they were working fewer hours or shifts. Reported loss of labor income during the COVID-19 shutdown from another household member was also counted.
We coded COVID-19-induced financial debt shocks on the basis of whether respondents reported that they had skipped paying bills as a result of the COVID-19 shutdowns, were planning not to pay rent or utilities during the month of the survey, and/or were using credit cards or loans to cover their basic expenses.
We coded food insecurity on the basis of whether respondents reported having skipped meals, relying on family or friends for meals, or visiting food pantries as a result of the COVID-19 shutdown. In the Propel survey, respondents were asked if they had resorted to any of these measures “as a result of the COVID-19 shutdowns,” but no explicit reference period was specified. In the Household Pulse Survey respondents were asked if they “lacked sufficient food to eat” or if they had resorted to any of the above emergency food acquisition measures during the prior seven-day reference period. Response tabulations for each individual survey item are shown in the appendix.
Results
We begin by reporting aggregate trends in the incidence hardships over time using the Propel data. We then report breakdowns by race. We urge readers to avoid placing too much emphasis on the absolute population rates in the Propel data, given that they are estimated from nonprobability samples. Readers should also avoid drawing absolute comparisons between the Propel and Household Pulse Survey series because of subtle differences in the target population and in measurement. Rather, the key results of interest concern the trends within each metric over time and the racial disparities therein.
Job Loss during the COVID-19 Shutdown
Figure 1 shows rates of job loss among SNAP recipients. Already by wave 1, nearly 27 percent of SNAP beneficiaries had lost jobs or were losing labor income while their working hours or partners’ hours were reduced during the COVID-19 shutdown. We estimate that another 11 percent were still technically employed, but their work was totally paused. These losses continued to compound by an additional 25 percent between late March and the middle of June, reaching an estimated 35 percent of SNAP households. The proportion of workers whose work was totally paused decreased from the beginning of the month, which likely reflects the fact that some businesses, such as restaurants, adopted reduced operations. But the proportion of workers laid off increased. This trend is not surprising given low-wage workers’ overrepresentation in hourly service jobs, which generally cannot be performed remotely. Although the share of those who experienced labor shocks stabilized by June, it is clear from Figure 1 that low-income workers’ disproportionate presence in the so-called essential workforce did not insulate them from widespread labor income shocks.
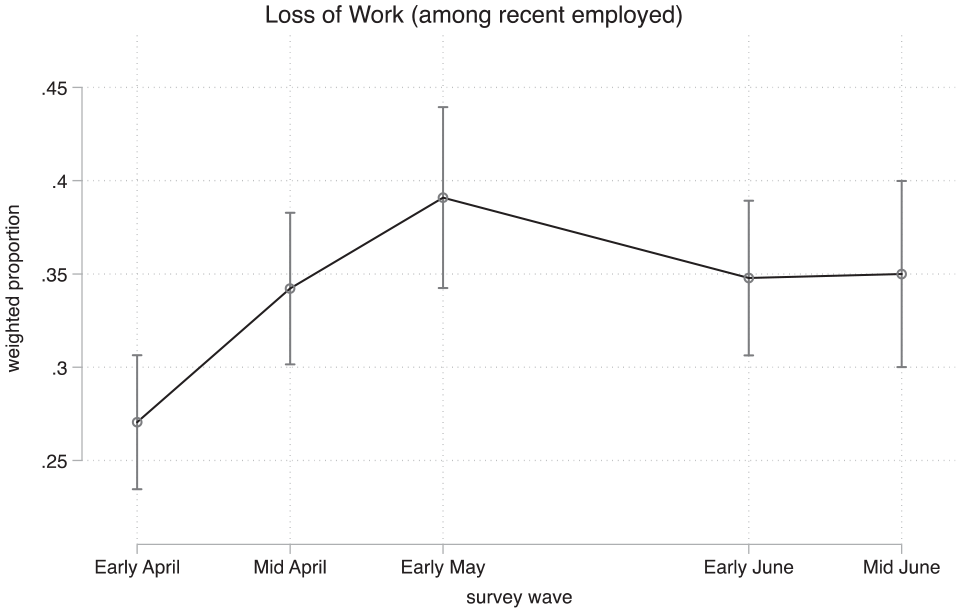
COVID-19-induced loss of work by respondent or household member (Propel survey)
Housing Precarity
The SNAP recipient population exhibited a high degree of housing insecurity across the study period. However, unlike other measures, housing insecurity did not become markedly worse over this time period. Moreover, the over-time variation that did appear was driven by fluctuations in perceived near-term housing loss likelihood, rather than by realized housing dislocation.
Figure 2 shows the proportion of SNAP beneficiaries who reported currently unstable housing conditions plus those who reported a high subjective likelihood of housing instability in the upcoming month. At the end of March (wave 1), 52 percent were deemed housing insecure by our definition. This includes 9 percent of SNAP beneficiaries who reported unstable housing or homelessness and 43 percent who expected that their housing would not remain stable after the upcoming month (at worse than 50/50 odds).

Current lack of stable housing or perceived high likelihood of housing loss in upcoming month (Propel survey).
By early May, subjective housing insecurity had climbed again to 62 percent of respondents. This may have reflected renewed worries about the upcoming month’s rent payment as the shutdown continued and some benefit assistance had been slow to arrive. Overall, across the first three waves, we estimated only a 2 percent net increase (not statistically significant) in the share of respondents who experienced housing dislocations and a 4 percent net increase in expected housing dislocation during the following month. By late May and early June, about 50 percent of households reported housing insecurity, which is a 12 percent drop from the end of April. By this point in the shutdown, families may have adapted more stable arrangements to navigate their new unsettled lives, and they may have become more fully cognizant of the eviction moratorium policies. Overall, although neither subjective housing insecurity nor realized housing dislocations become more widespread over the study period, a significant minority of SNAP recipient respondents nonetheless continued to perceive a high likelihood that they would be unable to maintain their current housing arrangements during the following month amid job losses and missed rent payments.
Food Insecurity
Managing nutritional needs was a growing challenge for SNAP beneficiaries over the study period. Figure 3 shows the proportion of SNAP beneficiaries reporting food scarcity rose steadily over the five waves as income losses compounded and benefits proved insufficient to cover necessary spending, especially for families who used to receive meals for their children at school and were making ends meet with the same SNAP benefits they received during more normal times.

Use of emergency food sources since COVID-19 shutdowns began (Propel survey).
More than half of SNAP beneficiaries reported skipping meals, relying on family or friends for meals, and visiting food pantries as measures they had to take during the COVID-19 shutdown. At the beginning of the month, we estimate that 54 percent of SNAP beneficiaries relied on these measures to manage their household food insecurity. By the end of April, the proportion of SNAP beneficiaries using one or more of these measures to manage their food insecurity rose to 63 percent of respondents. By late May, the proportion of households reporting food insecurity dropped to 58 percent, and it rose to roughly 64 percent of households by mid-June. Some of the families previously reporting serious food insecurity may have received additional SNAP benefits (Pandemic Electronic Benefit Transfer) which was focused on supporting households with children. The stimulus may have also provided the income necessary for households to stock up on some more nutritional basics in their households. The rise between May and mid-June marks the period after most families received their stimulus support and may be a poststimulus period of increased food insecurity.
Debt Accrued
We measured COVID-19 shutdown–fueled debt accrual by whether respondents had skipped paying bills as a result of the COVID-19 shutdown, were not paying their utility bills or rent in the month the survey was administered, or needed to use loans or credit cards to cover their basic household expenses (Figure 4). We estimate that the proportion of SNAP beneficiaries who were accruing some kind of new debt during the shutdown went from 67 percent in wave 1 to 77 percent by wave 3. The proportion of families reporting some kind of new debt during the COVID-19 shutdown remained steady at 77 percent between mid-April and mid-June.

Accrual of unpaid past due utility or other bills due to loss of income (Propel survey).
Although an increased proportion of SNAP beneficiaries reported some form of new debt accrual over these five waves, the overall increase in households reporting new debt could not be attributed to one of our specific measures of new debt accrual. The proportion of SNAP beneficiaries who reported that they were not planning to pay next month’s rent started at 27 percent and decreased to 24 percent by the end of April. May and June had even lower proportions of families reporting they were going to skip rent payments. The rate of respondents reporting that they would pay rent late, however, increased from 26 percent at the beginning of April to 31 percent in May and 34 percent in June. Similarly, the proportion of individuals who were not planning to pay their utility bills in April declined from 37 percent at the beginning of April to 31 percent at the end of the month. May and June were steady around 30 percent. Overall, we estimate that 51 percent skipped paying bills during the COVID-19 shutdown at the beginning of April, and 53 percent reported skipping bills by the end of April. May and June had slightly higher proportions of families reporting skipping payments on bills (55 percent and 58 percent, respectively). Finally, we estimate that 43 percent of SNAP beneficiaries used loans or credit cards to cover basic expenses at the beginning of April, and this proportion increased to 48 percent by the end of the month. May and June showed similar proportions of families using credit to cover expenses, at 46 percent in wave 5 and 47 percent in wave 6. The only type of debt that increased across these five waves was in skipped bill payments, though skipped utility bills and credit card debt were also used to manage household expenses at similar rates over these months. The rate of skipped rent payments may have decreased as respondents settled into their quarantining arrangements, some of which may have been family households where they were not expected to pay rent.
Change in Number of Sources of Precariousness among Households
Finally, we compared the proportion of households reporting any one or more of our precarity measures to those without these issues (Figure 5). Between the end of March and mid-June, more than 90 percent of families reported some kind of basic needs precarity within our four measures. Early May marked a point when more than 96 percent of households had some kind of new source of precarity during the COVID-19 shutdown. Although there was some improvement in June, the number of households reporting remained higher than 92 percent.
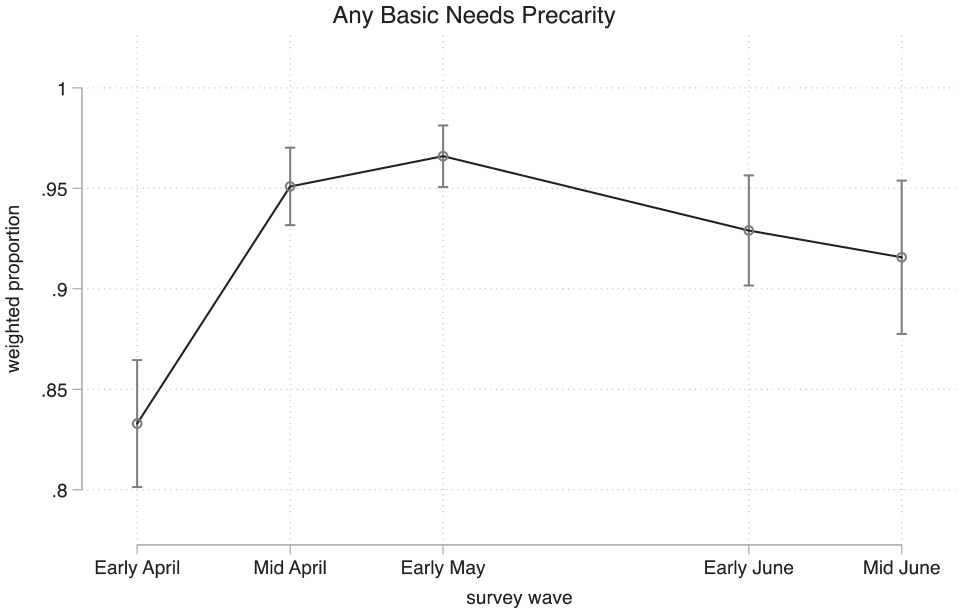
Share of respondents experiencing work dislocation or heightened housing, food, or financial strains due to COVID-19 crisis (Propel survey).
Precarity by Race and Ethnic Group
The previous section reported weighted estimates for the SNAP recipient population as a whole. Here we examine heterogeneity in prevalence and trends by race of the respondents.
Beginning with housing insecurity, Figure 6 compares the proportional differences in perceived housing insecurity over April among black, Latinx, and white respondents in Propel’s administrative data. We were not able to construct similar measures of perceived housing precarity within the Household Pulse Survey data. Black respondents reported the highest proportion of housing precarity at the beginning (59 percent), middle (58 percent), and end (66 percent) of April. The proportion of black households reporting housing precarity peaked at the end of April at 66 percent, while May (59 percent) and June (51 percent) showed some improvement for black households. The proportion of white respondents reporting housing precarity was lower than for Latinx and black respondents over the first half of April. At the beginning of the month, 42 percent of white households reported housing precarity and by the end of the month compared with 59 percent at the end of the month. Early June (41 percent) and mid-June (37 percent) showed some improvement in reported housing precarity for white households. Latinx households reported increasingly housing precarity, going from 52 percent at the beginning of April to 60 percent at the end of April. The number of households reporting housing precarity improved in May (50 percent) but returned to 59 percent in mid-June.
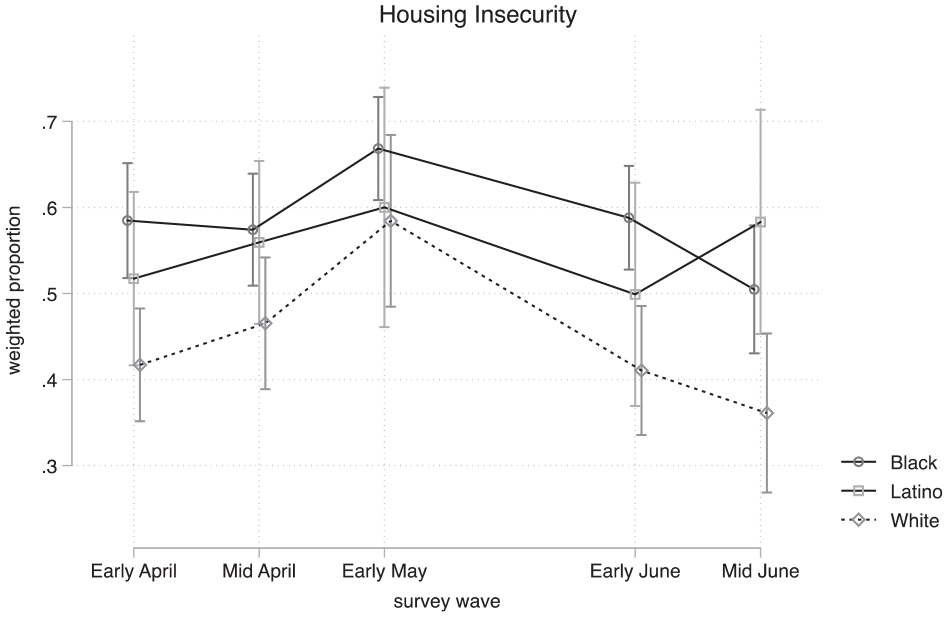
Current lack of stable housing or perceived high likelihood of housing loss in upcoming month (Propel survey).
Figure 7 demonstrates that for all three groups, food insecurity increased over April in Propel’s data. White respondents had a slightly higher proportion of individuals reporting food insecurity during the month than black respondents, but their proportional measures of food insecurity over the month rose at a similar pace. Both groups started April with 54 percent to 59 percent reporting skipping meals, visiting food pantries, or relying on friends or family for meals at the beginning the month but ended April with 61 percent of black and 69 percent of white households reporting using at least one of these measures to meet their nutritional needs. The proportion of Latinx respondents experiencing food insecurity remained steadier over April before rising in May and June: 47 percent reported food insecurity at the beginning of April, remaining at about 48 percent at the end of April. This proportion rose to 62 percent in May and 60 percent in June. By mid-June, about 60 percent of black and Latinx households reported food insecurity compared with 68 percent of white households. This is the only measure for which white households fared worse than black and Latinx households. One major caveat, however, is that the lack of a Spanish-language survey instrument may have skewed these results in the Propel survey, as we likely missed many of the more vulnerable Latinx households.
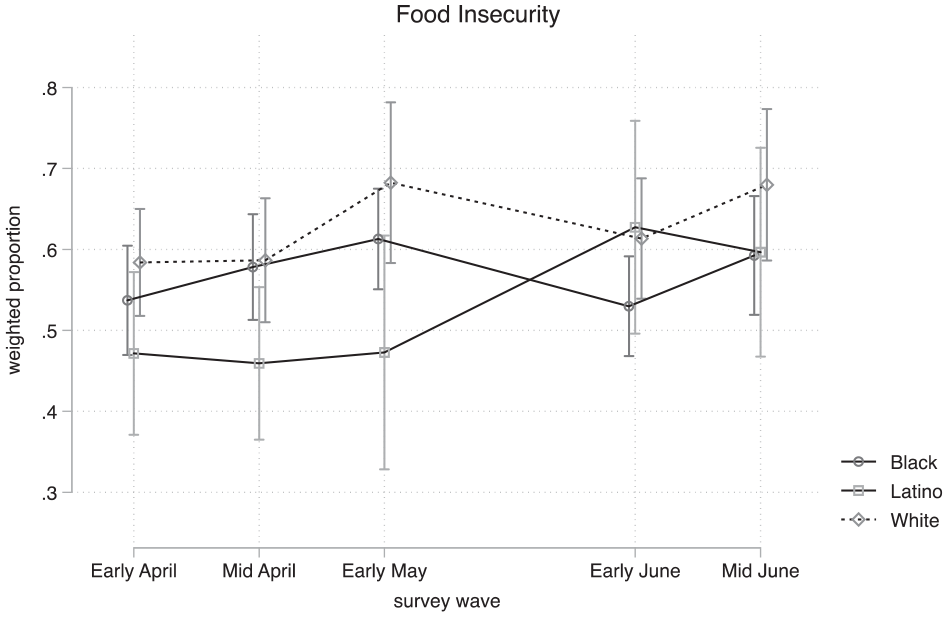
Use of emergency food sources since COVID-19 shutdowns began, by race (Propel survey).
The Household Pulse Survey shows a starker contrast between black and Latinx households compared with white households. Thirty-seven percent of white households reported food insecurity at the end of April compared with 45 percent of black and Latinx households (Figure 8). The proportion of white households reporting food insecurity remained mostly stable between the end of April and mid-June. The proportion of black and Latinx households reporting food insecurity, however, grew during the same period. By mid-June, slightly more than 50 percent of Latinx households and nearly 60 percent of black households reported food insecurity.

Use of emergency food sources during prior week, by race (Household Pulse Survey).
In general, the food precarity estimates in Propel’s data are slightly higher than those reported in the Household Pulse Survey figures. This may be attributable to slight differences in measures, though it is more likely attributable to the shorter seven-day reference period used in the Household Pulse Survey items.
The proportion of black respondents in Propel’s data reporting that they had lost work and income during the COVID-19 shutdown was consistently higher than those of both white and Latinx respondents over the month of April. Among these three groups, the proportion of black respondents reporting job loss also increased the most. Figure 9 shows that the proportion of black respondents who lost work at the beginning of April was 30 percent, compared with 48 percent at the end of April. Job and income loss increased for both Latinx and white households during April but not as dramatically. At the beginning of April, 24 percent of Latinx households reported job or income loss. Between mid-April and the end of May, the rate of Latinx households remained at about 30 percent until mid-June, which increased to 36 percent of Latinx households reporting job or income loss. The proportion of white workers reporting job loss remained steadier between the beginning of April and mid-June: 28 percent of white households reported job or income loss at the beginning of April, and this proportion remained between 29 percent and 31 percent between mid-April and mid-June.

COVID-19-induced loss of work by respondent or household member, by race (Propel survey).
In the Census Bureau data, Latinx households reported higher and increasing proportions of job loss during the shutdown compared with black and white households (Figure 10). Sixty-percent of black and white households reported job loss at the end of April compared with 65 percent of Latinx households. The proportion of Latinx households reporting job loss climbed to more than 75 percent compared with slightly less than 60 percent of white households and about 65 percent for black households during the second week of June. The Census Bureau’s estimate for Latinx households provides more data than we were able to capture through Propel’s administrative data, so this estimate may provide a better insight into the ways Latinx households have been affected by the COVID-19 shutdown.
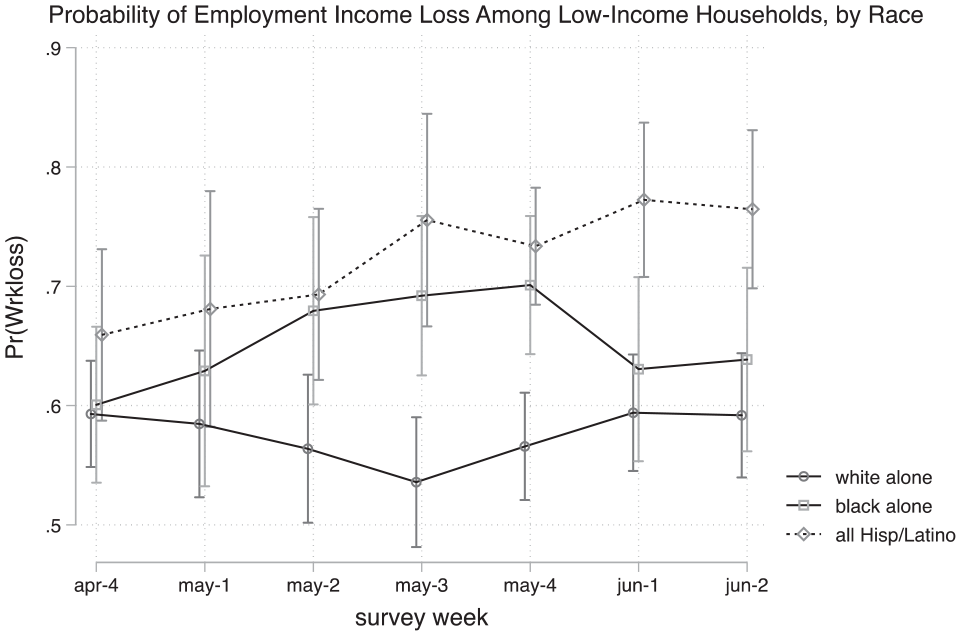
COVID-19-induced loss of labor income by respondent or household member, by race (Household Pulse Survey).
The proportion of Latinx and black respondents reporting some kid of accrued debt was similar at the beginning of April (about 70 percent) compared with white respondents at 63 percent (Figure 11).
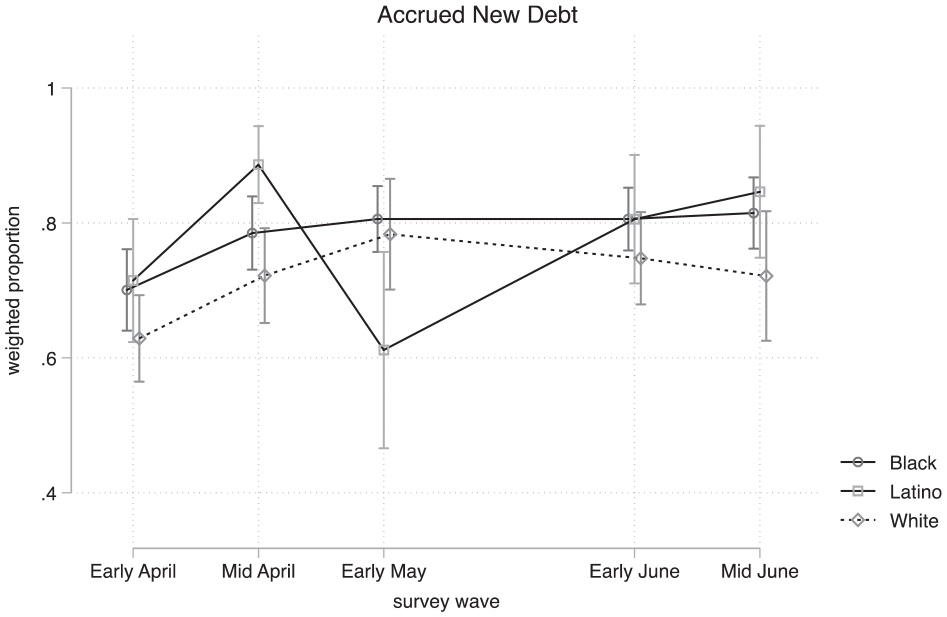
Accrual of unpaid past due utility or other bills due to loss of income, by race (Propel survey).
The proportion of black respondents reporting new debt during the COVID-19 shutdown increased by 10 percent from the beginning to the end of April. The proportion of black families reporting new debt remained steady at 81 percent between the end of March and mid-June. There was more variation among Latinx households. Latinx respondents reported higher rates taking on debt in the first half of the month: at the beginning of April, 72 percent reported taking on new debts, and by midmonth, 89 percent reported new debt. By the end of April, however, the Latinx respondents were the only group that proportionally reported fewer cases of debt accrual than the black and white respondents. Eighty percent of Latinx households reported new debt in late May compared with 85 percent in mid-June, which more closely resembled the outcomes reported by black respondents. White respondents began the month with the lowest proportion of respondents reporting new debt accrued during the COVID-19 shutdown (62 percent), and by the end of the month they reported the lowest proportion of respondents with new debt, slightly more than 70 percent. The Household Pulse Survey did not provide similar measures tracking debt.
Finally, we compared black, Latinx, and white households reporting any basic needs precarity between early April and mid-June (Figure 12). Black households remained mostly steady at about 95 percent reporting some kind of precarity throughout this entire period. Latinx households also remained at or above 92 percent throughout these surveys, with 96 percent of respondents reporting some kind of precarity in May and June. In the mid-April and the two June surveys, a higher proportion of Latinx households reported some kind of precarity than black households. The fluctuations and differences between black and Latinx households, however, were always within a few percentage points of each other and did not indicate a vast improvement or decline compared with the other group. White households showed some variation but remained at more than 90 percent, peaking in late April at 98 percent but falling to 88 percent in mid-June.

Share of respondents experiencing work dislocation or heightened, housing, food, or financial strains due to COVID-19 crisis, by race (Propel survey).
Discussion and Conclusion
Our aim with this research was to provide early indicators of the impact COVID-19 is having on the lives of poorer Americans. We find that low-income/benefits-eligible respondents faced increasingly widespread economic dislocations and strains as the pandemic progressed. Although some effects of the COVID-19 shock were already evident in our first survey wave (particularly in the labor market and perceived housing insecurity), the proportion of SNAP beneficiaries accruing new debts and/or losing labor income continued to expand during late May and early June, even as many states were lifting business restrictions and restarting economic activities. The incidence of food insecurity in the Household Pulse Survey also continued growing (though less so in the Propel data) across this period.
Together, these survey results paint a picture of deepening crisis from late March to June 2020: as labor incomes losses widened and compounded, more households reported new or increasing sources of insecurity along basic needs like food access. In the face of constraints, they increasingly skipped bill payments and thereby accrued new debts. Even as some workers are rehired at their old jobs or find new jobs, the reduced hours at work will make it difficult to pay off these new debts before these debts grow from interest payments and penalties.
The sheer proportions of respondents who were experiencing these forms of insecurity testifies to the scale of the COVID-19-shutdown-induced shock but also to the precarious position of low-income Americans before the current crisis began. When considering policy implications, it is important to emphasize that the Propel sample included only households that were already approved for SNAP and other benefits. Safety-net inaccessibility is an important problem (e.g., Moynihan and Herd 2010). However, to the extent that the present results highlight the insufficient protectiveness of safety-net programs in helping recipients cover basic needs, this is due to insufficient generosity rather than insufficient accessibility. In other words, existing benefits are not large enough to address recipients’ basic needs during the COVID-19 shutdown. Many states also adjusted their policies to make SNAP accessible to more of their populations during the early months of the COVID-19 crisis, but they are also describing the measures they plan to take to reduce their support for unemployment payments and other financial support for those affected by the COVID-19 crisis in the future.
Our results also highlight pronounced racial disparities in economic insecurity. Black households reported higher proportions of job and income loss during the COVID-19 shutdown and more debt accrual by the end of the month than white or Latinx families. White households ended April with the highest proportion of families reporting going without meals and finding other means to get enough food for their households, followed by black households. All three groups ended the month with similar proportions reporting perceived housing precarity. In most of our measurements, blacks fared somewhat worse than others, while Latinx households fared better than black and white households. These results suggest that the well-documented evidence of elevated COVID-19 mortality risk among blacks (e.g., Chowkwanyun and Reed 2020; Yancy 2020) was also coupled with elevated economic risks, at least among the low-income population studied here.
One limitation of the present survey measures is that they focus on the prevalence of particular insecurities rather than their relative severity. For instance, we do not know how many of those households that accumulated debts because of unpaid bills will end up experiencing acute financial distress as a result. Nor do know how many meals were being skipped. Further research might consider the severity of each of these precarity measurements within different household structures and different racial/ethnic groups. Another question for future research is to assess how economic stimulus payments were spent with regard to housing, food, medicine, and debt payments. Similarly, there are other forms of insecurity not covered here that could be examined in future research. For instance, we do not to focus on health, experience of COVID-19 symptoms, or health care access, but these are all significant risk factors for low-income populations.
Footnotes
Appendix
Means and Standard Errors from Weighted and Unweighted Outcome Variables for Debt and Nutrition.

| Survey Question | Variable | Mean | Standard Error | Unweighted Proportion |
|---|---|---|---|---|
| Have you had to skip medicine since the COVID shutdown began? | Wave1 | |||
| Gone without meds | .14 | .02 | .13 | |
| Wave2 | ||||
| Gone without meds | .13 | .01 | .13 | |
| Wave3 | ||||
| Gone without meds | .18 | .02 | .16 | |
| Wave5 | ||||
| Gone without meds | .15 | .01 | .17 | |
| Wave6 | ||||
| Gone without meds | .16 | .02 | .16 | |
| Experienced food scarcity since COVID shutdown? | Wave1 | |||
| Food scarce | .53 | .02 | .55 | |
| Wave2 | ||||
| Food scarce | .63 | .02 | .65 | |
| Wave3 | ||||
| Food scarce | .70 | .02 | .69 | |
| Wave5 | ||||
| Food scarce | .58 | .02 | .58 | |
| Wave6 | ||||
| Food scarce | .63 | .02 | .63 | |
| Are you planning to pay April/May/June rent? | Wave1 | |||
| Not paying rent | .27 | .02 | .22 | |
| I have a discount | .01 | .00 | .01 | |
| Extension | .10 | .01 | .11 | |
| Paying late | .26 | .02 | .29 | |
| Paid on time | .25 | .02 | .26 | |
| Wave2 | ||||
| Not paying rent | .24 | .02 | .25 | |
| I have a discount | .17 | .01 | .02 | |
| Extension | .14 | .02 | .14 | |
| Paying late | .26 | .02 | .28 | |
| Paid on time | .34 | .02 | .32 | |
| Wave3 | ||||
| Not paying rent | .24 | .02 | .21 | |
| I have a discount | .03 | .01 | .02 | |
| Extension | .15 | .02 | .15 | |
| Paying late | .28 | .02 | .30 | |
| Paid on time | .30 | .02 | .31 | |
| Wave5 | ||||
| Not paying rent | .17 | .01 | .18 | |
| I have a discount | .02 | .01 | .02 | |
| Extension | .14 | .02 | .14 | |
| Paying late | .31 | .02 | .30 | |
| Paid on time | .36 | .02 | .36 | |
| Wave6 | ||||
| Not paying rent | .11 | .01 | .12 | |
| I have a discount | .02 | .01 | .03 | |
| Extension | .13 | .01 | .14 | |
| Paying late | .34 | .03 | .34 | |
| Paid on time | .40 | .03 | .37 | |
| Are you planning to pay utilities? | Wave1 | |||
| Not paying utilities | .37 | .02 | .30 | |
| Wave2 | ||||
| Not paying utilities | .30 | .02 | .30 | |
| Wave3 | ||||
| Not paying utilities | .31 | .03 | .26 | |
| Wave5 | ||||
| Not paying utilities | .27 | .02 | .26 | |
| Wave6 | ||||
| Not paying utilities | .32 | .03 | .28 | |
| Have you used a credit card/loan to cover basic expenses? | Wave1 | |||
| Loan/credit card for expenses | .51 | .02 | .45 | |
| Wave2 | ||||
| Loan/credit card for expenses | .47 | .02 | .40 | |
| Wave3 | ||||
| Loan/credit card for expenses | .53 | .03 | .50 | |
| Wave5 | ||||
| Loan/credit card for expenses | .55 | .02 | .46 | |
| Wave6 | ||||
| Loan/credit card for expenses | .58 | .03 | .42 | |
| Have you skipped paying a bill since COVID shutdown? | Wave1 | |||
| Skipped paying bill | .43 | .02 | .42 | |
| Wave2 | ||||
| Skipped paying bill | .44 | .02 | .44 | |
| Wave3 | ||||
| Skipped paying bill | .48 | .03 | .49 | |
| Wave5 | ||||
| Skipped paying bill | .46 | .02 | .51 | |
| Wave6 | ||||
| Skipped paying bill | .47 | .03 | .48 |
Acknowledgements
We thank Propel, Inc., for suppling the anonymized survey used in this analysis. The Global Systemic Risk Project at Princeton University provided generous research support. All errors are ours alone.