
Abstract
Concerns that prospects for upward mobility are fading are common in popular and scientific discourse. The fact that fewer Americans today surpass their parents’ economic status than in the past has been invoked to explain trends ranging from the recent spike in drug and alcohol poisonings to the growing appeal of right-wing populism. Using General Social Survey data, the authors ask whether people actually feel that their standard of living is falling short of that of previous generations. In contrast to data on income, education, or occupation, a majority still perceive that they have attained a higher standard of living than their parents. At the same time, mobility experiences are becoming increasingly polarized: subjective upward mobility is rising among highly educated, minority, and urban populations and declining among less educated and rural populations.
Keywords
Most Americans born in the post–World War II era could expect to be significantly better off than past generations. However, research on intergenerational mobility suggests that this prospect is fading (Chetty et al. 2017; Hout 2018; Song et al. 2019). Since the baby boom, the proportion who go on to out-earn their parents has plummeted: whereas about 90 percent of those born in the 1940s earned higher real incomes than their parents in adulthood, that share dropped to about half in the early 1980s (Chetty et al. 2017). Over the same period, the fraction of children who attained higher status occupations than their parents fell from about two thirds to barely half (Hout 2018). Among academic researchers, policy makers, and the general public, such statistics have been used to infer that a growing share of Americans are facing lower standards of living or are fundamentally “worse off” than their parents (Case and Deaton 2015; Chetty et al. 2017; Obama 2013; Putnam 2016).
There is little doubt that true disadvantage pervades the daily lives of many Americans (Allard 2017; Desmond and Western 2018; Edin and Shaefer 2015; Graham 2017). At the same time, we lack representative evidence on the extent to which people feel that their standard of living has declined relative to past generations. With few exceptions, intergenerational mobility research draws on unidimensional measures such as income (Chetty et al. 2017) or occupational status (Hout 2018; Song et al. 2019). Yet people are likely to judge their living standards against a broader set of factors, including health and education, leisure time, personal freedom, meaningful social connections, and so on (Duru-Bellat and Kieffer 2008; Edin et al. 2019; Nussbaum and Sen 1993). Given that intergenerational mobility is a multidimensional construct, no single indicator can claim to capture it fully or present a “correct” view of the state of mobility. Social science researchers should therefore draw on multiple indicators to understand how social stratification is evolving.
Subjective data are an important complement to conventional status indicators and may detect trends not reflected in these measures. Lived mobility experiences matter in their own right but also as an implicit component in models of how socioeconomic factors influence attitudes, behavior, and well-being (Chan 2018; Gugushvili 2020; Kaiser and Trinh 2019; Newman 1999; Paskov, Präg, and Richards 2020). Not least is this evident in recent discussion of the precipitous rise in “deaths of despair” associated with alcohol, drugs, and self-harm. Case and Deaton (2015) attributed this rise to current generations being “the first to find, in midlife, that they will not be better off than were their parents” (p. 15081). Perceptions of intergenerational decline have also figured prominently as an explanation for the rise of right-wing populism in American politics (Gest 2016; Gidron and Hall 2017; Hochschild 2018; Jackson and Grusky 2018; Morgan 2018).
Why might subjective and objective mobility indicators diverge? Over the past decades, rising inequalities and a slowdown in educational expansion, occupational upgrading, and income growth all contributed to reversing intergenerational progress. Still, countervailing trends may have improved life for the average American in other respects. Throughout the post–World War II era, the diffusion of modern lifestyles and new technologies revolutionized both leisure and labor, not least within the household (Gordon 2017). During the same period, successive generations saw rising health and life spans, the expansion of civil rights, access to cleaner air and water, and improved safety from crime (Carlson and Burtraw 2019; Pinker 2018; Stevenson and Wolfers 2008; Zimring 2006). More recently, “techno-optimists” have argued that the proliferation of new and often free digital goods and services is changing consumption across the income spectrum in ways that standard price indices fail to detect (Brynjolfsson and McAfee 2014).
Given these disparate trends, it is an open question whether a growing share of Americans actually feel that their living standards are falling below that of their parents. To answer this question, we leverage data from one of the longest running representative surveys of the U.S. population. For the past 25 years, the General Social Survey (GSS) has asked its respondents whether they think their standard of living is better or worse than that of their parents at a similar age (Smith et al. 2019). 1 On the basis of these data, we estimate the fraction of Americans who perceive that they have attained a greater standard of living than their parents for successive cohorts born between 1940 and 1984. We contrast these results with objective measures that have dominated earlier work on mobility: income, education, and occupation. We pay attention to the level of subjective mobility as well as its cohort trend over time but also to demographic differences that may be concealed in the aggregate population. Most of our focus is on simple visualization of cohort trends; our methods are described in greater detail at the end of this article.
Our analysis reveals a striking contrast between subjective mobility in living standards and objective mobility as measured by income, education, or occupation. Contrary to the marked decline in objective indicators, the majority of Americans still feel that they have attained a greater standard of living than their parents. Decline is confined mainly to early baby boomers, while levels have remained stable since cohorts born from the mid-1950s onward. At the same time, subjective mobility shows a stark polarization that goes undetected with conventional measures. Mobility experiences are stagnant in the demographics that have captured much of the political imagination in recent years: less educated, rural whites. With respect to current debate, then, our results provide a mixed picture. On one hand, they confirm fears about a growing opportunity divide in recent cohorts—in fact, more so than standard socioeconomic indicators reveal. On the other hand, decline in subjective mobility is the experience of the few, not the many. This seems to suggest that the drop in upward mobility documented by previous research has not been “felt” by most people and may not have had the implications for attitudes and behavior that are commonly assumed.
Results
Trends in Subjective Upward Mobility since 1940
Figure 1A shows the distribution of responses to the question “Compared to your parents when they were the age you are now, do you think your own standard of living is much better, somewhat better, about the same, somewhat worse, or much worse than theirs was?” We restrict analyses to respondents aged 25 to 69 years at the time of interview (for alternative cutoffs, see Supplemental Material Section 1); the horizontal axis shows year of birth. The share responding “much better” shrinks throughout the first part of the period, while “about the same” and “somewhat worse” increase proportionally and “somewhat better” remains largely constant. From about the mid-1950s, these shares stabilize, and overall, perceptions are more positive than previous work based on income or occupation would lead us to expect (Chetty et al. 2017; Hout 2018; Song et al. 2019). In particular, the shares of respondents in any generation deeming themselves “somewhat worse” and “much worse” off than their parents are no higher than 15 percent and 5 percent, respectively.
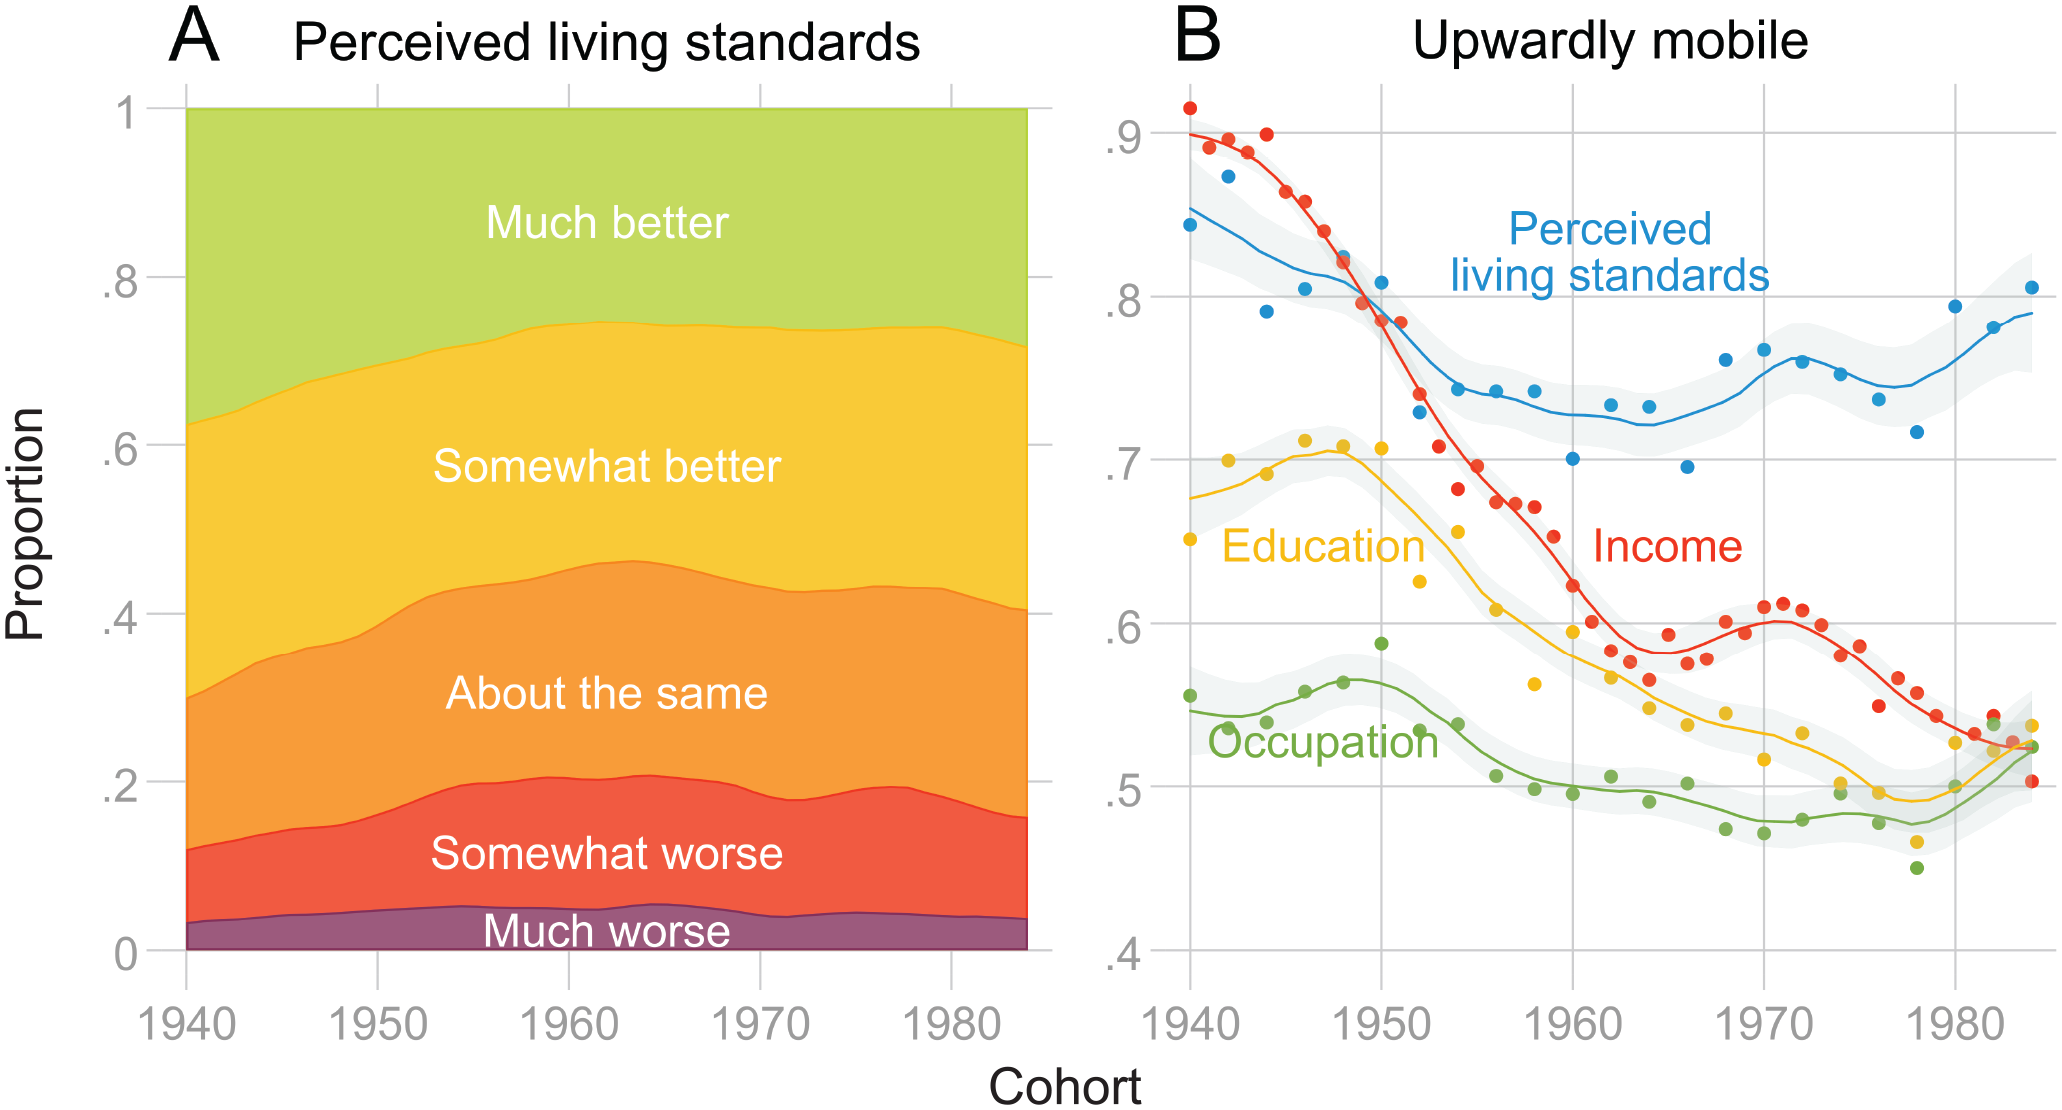
Subjective and objective mobility by child cohort. (A) Perceived living standards relative to parents. (B) Upward mobility, the share in each cohort that surpass their parents.
Comparison with Income, Education, and Occupation
To allow a more direct comparison with previous work, in Figure 1B we collapse the “much better off” and “better off” responses and contrast them with the “somewhat worse” and “much worse” groups. 2 We compare these responses with data on upward mobility in income, education, and occupation for the same cohorts. Income mobility estimates are from the copula-based analysis by Chetty et al. (2017), while we estimate mobility in educational attainment and occupational status directly from the GSS respondents. These results reaffirm the conclusion that perceptions of downward mobility are less widespread than estimates based on objective indicators would have us think: upward mobility in income, education, and occupational status have all dwindled, while the decline in subjective upward mobility is much less dramatic.
Robustness
Is the divergence between objective and subjective mobility real or an artifact of data and methods? We examine three potential sources of bias in perceptions: life-cycle effects, demographic composition, and cognitive bias.
Life-Cycle Effects
Although we restrict our sample to people of working age, respondents in more recent cohorts are younger on average. This could bias the trend if younger cohorts have not reached maturity in the labor market or if mobility perceptions decline with age. In Supplemental Material Figure S1, we use alternative age cutoffs; in Figure 2, we estimate a linear trend in subjective upward mobility adjusting for age and other factors. The blue marker shows the unadjusted decline in the incidence of subjective upward mobility per 10-year cohort, –0.014 (95 percent confidence interval [CI] –0.021 to −0.006). Red markers are estimates from a model including age at interview and its square term. Older respondents report less favorable mobility experiences, and the cohort trend steepens somewhat once this is adjusted for (–0.042, 95 percent CI −0.054 to −0.029). However, the trend is still less than half the decline in income mobility (–0.090). And although it is closer to the trend in education or occupation mobility (Supplemental Material Section 3), the large differences in level remain to be explained. 3

Multivariate regressions of upward mobility in perceived living standards on cohort and demographics.
Demographic Composition
Other demographic shifts could underlie the discrepancy between objective and subjective mobility. For example, immigration has risen from a historic low in 1970, and differential fertility trends have increased the relative size of minority groups (Frank, Akresh, and Lu 2010; Lee and Bean 2004; Taylor 2016; Waters, Kasinitz, and Asad 2014). A growing proportion of immigrants may inflate subjective mobility across cohorts, if they compare themselves with economically poorer countries they or their parents have left behind. Estimates in green in Figure 2 adjust for race and minority status, as well as gender and rural/urban residence (for definitions, see “Data and Methods”). All else equal, black, immigrant, and rural populations report more favorable mobility experiences. However, the shift in the cohort trend adjusting for these factors is minor; the cohort coefficient is −0.045 (95 percent CI −0.058 to −0.033) compared with −0.041 in the previous model. Estimates in yellow in Figure 2 add a control for census region and division, and although there are regional differences, this adjustment does not move the cohort trend, which remains at −0.045 (95 percent CI −0.057 to −0.032). In sum, sample composition does not seem to be a major explanation for why subjective mobility has remained high.
Cognitive Bias
Another possibility is that people generally overestimate how much their lives have improved. Indeed, there is some evidence that Americans are too optimistic about the prospects for upward mobility (Alesina, Stantcheva, and Teso 2018; Kraus and Tan 2015). If such overoptimism has increased among recent cohorts, it may partly explain the growing gap between subjective and objective mobility indicators. In Supplemental Material Section 4, we use data from two independent surveys (Alesina et al. 2018; Cheng and Wen 2019) to show that more recent cohorts are, if anything, more pessimistic about chances of upward mobility. These surveys are not directly comparable with our data; their focus is on establishing beliefs about relative income mobility in a cross-section, not absolute mobility over time. However, the fact that neither of them finds that more recent cohorts are overly optimistic about mobility prospects suggests that cognitive bias is an unlikely explanation for the persistently high levels of subjective upward mobility we find. 4
Factors Contributing to Subjective Mobility
Although income and occupational mobility have dwindled, perceptions of upward mobility in living standards are still high, a discrepancy not easily attributable to life-cycle dynamics, cohort composition, or cognitive biases. Living standards are arguably a broader concept, encompassing aspects beyond objective status as measured by income, education, or occupation. To explore other potential determinants of mobility perceptions, we next examine the association between subjective mobility and measures of well-being (for definitions, see “Data and Methods” at the end of this article). Needless to say, the causal relationship between subjective mobility and these indicators is likely to be reciprocal. Still, clustering between subjective mobility and other self-reported well-being metrics would suggest a common dimension that objective indicators fail to capture fully.
Figure 3A first shows the correlation between subjective mobility and objective mobility metrics. Income mobility is an important predictor of subjective mobility, while education and occupation mobility produce smaller but nevertheless sizable correlations. At the same time, the importance of income mobility has declined in recent cohorts (Supplemental Material Figure S8). Income may have lost salience because of a decreasing emphasis on material values (Inglehart 2018) or because it is becoming less relevant for actual consumption (Brynjolfsson et al. 2019; Brynjolfsson and McAfee 2014). Regardless of reason, it underscores the potential importance of additional determinants. For example, it is plausible that individuals value other aspects of life and work, such as the ability to choose their own lifestyle or lead a fulfilling life in general.

Correlation between mobility in perceived living standards and other metrics of mobility and well-being.
Next, we inspect correlations for evaluative and emotional aspects of subjective well-being (SWB). Life evaluation measures draw on people’s thoughts about their lives over a longer time horizon, whereas emotional well-being involves people’s judgements about the frequency and intensity of day-to-day emotional experiences such as anxiety or happiness (Kahneman and Deaton 2010). SWB has not declined over the period we study (Supplemental Material Figure S7), which could help explain the growing discrepancy between objective indicators of mobility and perceptions of living standards. Figure 3B shows that life evaluation measures yield correlations of comparable magnitudes to education and occupation mobility. Satisfaction with life and self are stronger predictors of subjective mobility than work satisfaction, underscoring nonmaterial aspects of living such as personal agency, autonomy, and self-expression. Turning to emotional SWB in Figure 3C, we find significant correlations with happiness and unhappiness and somewhat smaller correlations for alternative indicators including anxiety. Similarly, self-reported health is associated with subjective mobility, also when we focus on separate measures capturing (poor) physical and mental health in Figure 3D.
In Supplemental Material Figure S10, we further show that these relationships hold when adjusting for mobility in the three objective indicators we study: education, occupation, and income. The correlations with SWB and health remain on average about two thirds their size with objective mobility controls in place, and all coefficients statistically significant in the original analysis remain so.
Demographic Disparities in Subjective Upward Mobility
Although most Americans see themselves as better off than their parents, this overall trend might hide important group differences. In Figure 4 we plot separate trends across a range of demographics. Doing so reveals that subjective upward mobility is becoming increasingly polarized by education, race, and place in recent cohorts. Notably, the polarization of mobility in perceived living standards is more salient than that in educational attainment and occupational status among the same respondents in the GSS (Supplemental Material Figures S4 and S5), suggesting that research focusing on a single dimension may understate the perception of inequalities.

Upward mobility in perceived living standards by social and demographic characteristics.
Educational Attainment and Gender
Subjective upward mobility has diverged between those with high (>12 years) and low (≤12 years) levels of educational attainment (Figure 4A). This evidence is consistent with a widening gap in income and SWB that has opened up across educational groups since the 1980s (Andersson 2018; Autor 2014; Stevenson and Wolfers 2008). In light of women’s dramatic advances in educational attainment (Buchmann et al. 2008; DiPrete and Buchmann 2013), it is perhaps surprising to see that there is no similar polarization by gender (Figure 4B). However, women’s gains in education, health, and labor market outcomes (Schnittker 2007) appear to have been partly offset by a decline in SWB, which could explain the pattern (Stevenson and Wolfers 2009). In Supplemental Material Section 7, we show separate trends for each combination of education, race, and gender, but the same broad patterns hold across combinations of these groups.
Race and Immigration Status
Blacks are more likely than the white majority to perceive their standard of living to be greater than that attained by their parents (Figure 4C). Moreover, the gap in subjective upward mobility between blacks and whites has increased from cohorts born in the 1970s onward. Economic strides made by blacks slowed down in the last decades of the 20th century (Bloome 2014; Conley 1999; Quillian et al. 2017), yet absolute and relative progress in SWB continued unabated (Stevenson and Wolfers 2012), a fact potentially relevant for the continued rise in subjective upward mobility. A similar pattern is evident among immigrants beginning around 1960 (Figure 4D). It is important to stress that these group differences carry no direct implication about how the living standards of blacks or immigrants have progressed relative to the white majority, only how each group compares with their own parents. In fact, looking at a SWB metric that does not involve intergenerational comparison, 5 racial differences reverse in favor of whites (Supplemental Material Figure S19).
Urbanicity and Region of Residence
The importance of place has been a focal point of recent debate. A striking regional convergence during the century leading up to the 1980s has been followed by an equally striking reversal, which left rural and formal industrial communities behind (Manduca 2019; Moretti 2012; VanHeuvelen and Copas 2019). Perceptions of intergenerational mobility track these trends. Although rural areas provided more subjective upward mobility than urban areas for baby boomers, this reversed among those born in the early 1980s (Figure 4E). A similar reversal of fortunes is visible in the Middle Atlantic region comprising the states of New York, New Jersey, and Pennsylvania, which make up a large part of the rust belt. These states follow a parallel trend to the rest of the country until 1970s cohorts, when a dramatic drop is visible (Figure 4F). In Supplemental Material Section 7, we plot separate trends by gender for all census regions and divisions, showing that the Middle Atlantic decline is concentrated among men. Further analysis indicates that these estimates are not driven by selective migration (Figures S12 and S13).
Party Identification and Family Background
There is increasing political polarization in beliefs, preferences, and perceptions (Alesina, Miano, and Stantcheva 2020; Noy and O’Brien 2016; Taylor 2016). Despite this, party identification is largely unrelated to trends in subjective upward mobility (Figure 4G), However, levels differ throughout the period, with Republican Party sympathizers reporting the highest levels of mobility, followed by Democrats and independents. It is notable that levels of subjective mobility are lowest among those without a strong party preference, who are likely to constitute an influential part of the electorate as presumptive swing voters. There is also clear patterning in subjective upward mobility by childhood income: rates of subjective upward mobility are rising among children from high-income families, unlike children from average or below-average economic circumstances (Figure 4H). These patterns seem to map well onto the growth in top income shares witnessed in the United States since the post–World War II era (Piketty 2014).
Discussion
Historically, Americans’ tolerance for inequality has rested on a belief that anyone is able to better his or her lot through ambition and hard work (McCall 2013; Mortimer, Mont’Alvao, and Aronson 2020; Reynolds, May, and Xian 2019). Throughout much of the post–World War II era, educational expansion, occupational upgrading, and income growth helped deliver this promise. Today, the prospect of upward mobility increasingly appears to be slipping out of reach (Chetty et al. 2017; Hout 2018). Meanwhile, policies with the potential to stem inequality’s rising tide remain controversial (Brooks and Manza 2013; Cech 2017; Piketty 2020). Although intergenerational mobility has been the subject of extensive discussion in recent years, we still know comparatively little about perceptions, attitudes, and beliefs thereof.
Against this background, we make a vital contribution analyzing the trend in subjective upward mobility in the United States across cohorts born since 1940. We document two main findings. First, there is only a modest long-run decline in the share of Americans who perceive themselves to be better off than their parents. Notably, the drop in subjective upward mobility is much less dramatic than the secular decline in mobility in terms of education, income, or occupational status. Second, we find significant polarization in subjective upward mobility (e.g., across educational groups), which appears to be growing in recent decades. It is important to note that these two conclusions are not mutually exclusive and that, regardless of the overall level and trend, inequalities in subjective upward mobility are an important cause for concern in and of themselves.
One implication is that the decline in objective mobility may not have been “felt” by a majority of Americans and therefore might be less consequential than previously thought as a determinant of behavior, orientations, and well-being (Case and Deaton 2015; Chetty et al. 2017; Obama 2013; Putnam 2016). More work will be needed to unpack the meaning of this finding. On one hand, the interest in absolute income mobility is to a large extent motivated precisely by a comprehensive interest in living standards. 6 On the other hand, income and perceived living standards are not identical and may capture partly different experiences. As we have argued, it is likely that respondents may be drawing on a wider range of considerations when assessing subjective upward mobility. It is entirely plausible, for example, that although they have access to technology and opportunities for consumption unthinkable a generation ago, they still suffer from greater financial insecurity than their parents. Although we cannot disentangle these and other dimensions in our data, our results provide important information for future work on the nexus between mobility experiences, attitudes, and behavior.
Why has subjective and objective mobility diverged? A number of trends countervail the stagnation of growth and educational expansion and may thereby help explain our findings. Technological development is one such potential factor. Since the post–World War II era, technological innovations have revolutionized American homes and workplaces (Gordon 2017), and free digital goods and services have more recently cheapened consumption and provided higher quality leisure across the income spectrum (Brynjolfsson et al. 2019; Brynjolfsson and McAfee 2014). But progress has not been limited to material domains: the cohorts we study also saw rising health and life spans, the expansion of civil rights, access to cleaner air and water, and improved safety from crime (Carlson and Burtraw 2019; Phillips 2013; Pinker 2018; Stevenson and Wolfers 2012; Zimring 2006). Trends in SWB have likewise remained buoyant over the period we study (Stevenson and Wolfers 2008). Indeed, recent work argues that conventional measures of economic progress, such as income and gross domestic product, are becoming detached from human welfare (Brynjolfsson et al. 2019; Jones and Klenow 2016).
If the decline in subjective upward mobility is less marked than in objective indicators, group differences appear all the more striking. Subjective mobility in recent cohorts differs sharply by demographics in ways that trace other indicators of ill-being and despair (Gest 2017; Graham 2017; Graham and Pinto 2019). Although technological progress may have made life better for the average American, the changing economy also created winners and losers. The most striking manifestation of this is the dramatic rise in returns to higher education that took off around 1980 (Autor 2014; Morris and Western 1999; Neckerman and Torche 2007). This polarization is visible in our data, as is the widening rural-urban divide, driven by deindustrialization and the rise of knowledge-intensive industries that thrive in densely populated metropolitan areas (Allard 2017; Manduca 2019; Moretti 2012; VanHeuvelen and Copas 2019). The fact that these rising disparities are more marked in subjective upward mobility than in some objective measures suggests that research focusing on a single dimension such as income or occupational status may miss important aspects.
Finally, despite buoyant perceptions of living standards, there is reason for caution, as improvements in several of its potential determinants, including health and mortality (Case and Deaton 2015; Murray et al. 2013), living environments (Clay and Muller 2019), racial progress (Stevenson and Wolfers 2012), and even innovation (Gordon 2017), show signs of stalling or reversal. In particular, in light of the apparent role of education and health in explaining perceptions of living standards, the fact that prices for essential services such as education and health care have doubled or even tripled in recent decades raises critical questions for many Americans (Archibald and Feldman 2014; Dieleman et al. 2017; McMillan Cottom 2017). This is concerning if investments in human capital and health are a key input into upward mobility. Failures to remedy this may limit opportunity in the future, no matter how optimistic the outlook of current generations of Americans.
Data and Methods
We base our analyses on the 1972–2018 GSS cumulative file (Smith et al. 2019), select respondents aged 25 to 69 years at the time of interview, and exclude respondents who were living outside the United States at age 16. The question about subjective mobility was first introduced in 1994. The number of observations per cohort ranges from 83 in 1983 to 427 in 1958 (Supplemental Material Figure S15). In our main analyses, we do not use survey weights, as there is no established way to integrate them into scatterplot smoothers (Figures 1 and 4). In Supplemental Material Section 8 we show that incorporating GSS design weights makes no discernible change to our results.
Intergenerational Mobility
All measures of mobility are relative to the parents of the focal cohort. Perceived mobility in living standards has five categories ranging from “much worse” to “much better” (see Figure 1). In Figures 1A and 3 we use the responses as an ordinal variable; in Figures 1B, 2, and 4 we exclude the middle and collapse the categories above and below to create a binary indicator of upward mobility (Sturgis, Roberts, and Smith 2014). Estimates of income mobility in Figure 1B are as reported by Chetty et al. (2017). We also create an ordinal measure of income mobility for Figure 3 by subtracting self-reported family income at age 16 from current income (both in five categories ranging from “far below average” to “far above average”). We construct education and occupation mobility in a similar way on the basis of respondents’ reports of their own education and occupation and that of their parents. Education is measured as years of schooling (0–20). Occupations are scaled by their 2010 socioeconomic status scores (Hout, Smith, and Marsden 2014). We average education and occupational status over both parents, or take the only nonmissing, and subtract these from the respondent’s own value to calculate mobility.
Demographics
In Figures 2 and 4 we separate respondents on the basis of various demographics. Level of education distinguishes those with 13 to 20 years of schooling from those with 12 years or less. Race is as reported by the respondent, “white” or “black”; we exclude the category “other” (3.2 percent of the sample). For immigration status, we separate those who report having at least one foreign-born parent from other response categories. All analyses exclude respondents who did not reside in the United States by age 16. Urban or rural residence is based on the Survey Research Center new belt code (Lazerwitz 1960); we code as rural the “other rural” category (12.5 percent of the sample). Region is the census region or division where the respondent lived at the time of interview. For party identification, we designate the three categories “strong Republican” to “independent, near Republican” as Republican and do likewise for Democratic sympathizers, while the independent category comprises the alternatives “independent” and “other party.” Childhood income is self-reported; we group together “below/far below average” and “above/far above average” to create three categories, with “average” being the middle category.
SWB and Health
We use the following items. For life satisfaction, the respondent is satisfied with his or her life, with seven alternatives ranging from “completely dissatisfied” to “completely satisfied.” For satisfaction with self, on the whole the respondent is satisfied with himself or herself, with four alternatives ranging from “strongly disagree” to “strongly agree.” For work satisfaction, we use four alternatives ranging from “very dissatisfied” to “very satisfied.” Anxiety in the past week is the number of days the respondent felt anxious and tense. Happiness is the overall happiness of the respondent, with three alternatives ranging from “not too happy” to “very happy.” Unhappy or depressed in the past month is how often the respondent was unhappy or depressed in the past four weeks, with five alternatives ranging from “never” to “very often.” Difficulties piling up in the past month is how often the respondent felt difficulty piling up in the past four weeks, with five alternatives ranging from “never” to “very often.” General health is assessed using four alternatives ranging from “poor” to “excellent.” Poor physical or mental health in the past month is days the respondent experienced a condition in the past 30 days. Not all items are available consistently across survey waves; see Supplemental Material Section 9 for available years and number of observations.
Regression Models
In Figure 2 we present results from multivariate linear probability models with standard errors adjusted for heteroskedasticity. To account for missing data, we fit these models using full-information maximum likelihood (FIML), which allows us to keep the number of observations constant across models despite missing data. FIML is asymptotically equivalent to the more commonly used method of multiple imputation, but more statistically efficient (Allison 2012; Von Hippel 2016). Including the same variables in the analysis and imputation model by default, it also standardizes the process of selecting auxiliary variables, thereby increasing transparency and reducing researcher degrees of freedom. In Figure 3 we estimate polychoric correlations between mobility in perceived living standards and mobility metrics, SWB, and health. For education and occupation mobility and days of poor physical or mental health, which are ordinal variables, correlations are polyserial. As these correlations are all bivariate, we handle missing data in Figure 3 using casewise deletion. Correlations between SWB/health and subjective mobility adjusting for objective mobility are shown in Supplemental Material Figure S10.
Supplemental Material
si – Supplemental material for Trends and Disparities in Subjective Upward Mobility since 1940
Supplemental material, si for Trends and Disparities in Subjective Upward Mobility since 1940 by Thor Berger and Per Engzell in Socius
Footnotes
Funding
The author(s) disclosed receipt of the following financial support for the research, authorship, and/or publication of this article: Dr. Berger was supported by the Jan Wallander and Tom Hedelius Foundation. Dr. Engzell was supported by Nuffield College, the Leverhulme Centre for Demographic Science, the Leverhulme Trust, and the FORTE Swedish Research Council for Health, Working Life and Welfare (grant 2016-07099).
Data Availability
The GSS is publicly available from the NORC at the University of Chicago (http://gss.norc.org/get-the-data). All materials necessary to reproduce the findings can be found at: ![]() .
.
Supplemental Material
Supplemental material for this article is available online.
1
The GSS has been running since 1971, but the question about subjective upward mobility was not included until 1994.
2
We exclude the category “about the same,” which lacks a counterpart in the objective data, but show results using alternative codings of subjective upward mobility in Figure S2 in the Supplemental Material.
3
Future work should aim to disentangle the relative role of age, period, and cohort in determining these patterns. In Supplemental Material Figure S17, we disaggregate trends simultaneously by age and cohort. Doing so reveals that declining perceptions of upward mobility by age are especially marked in recent cohorts, arguably more consistent with ![]() and suggestive of an influence of the Great Recession.
and suggestive of an influence of the Great Recession.
4
In Supplemental Material Figure S18, we further examine trends in subjective upward mobility when adjusting for objective mobility as measured by income, education, and occupation.
5
Here, the share of respondents who report being either “pretty” or “very” happy when asked, “Taken all together, how would you say things are these days–would you say that you are very happy, pretty happy, or not too happy?”
6
Author Biographies
References
Supplementary Material
Please find the following supplemental material available below.
For Open Access articles published under a Creative Commons License, all supplemental material carries the same license as the article it is associated with.
For non-Open Access articles published, all supplemental material carries a non-exclusive license, and permission requests for re-use of supplemental material or any part of supplemental material shall be sent directly to the copyright owner as specified in the copyright notice associated with the article.