
Abstract
Descriptions of the contemporary U.S. opioid crisis emphasize several “waves” of overdose deaths. However, a focus on trends in overdose deaths may obscure important sociological dynamics. The authors provide heatmap visualizations of estimated annual rates of past-year substance use, rather than overdose deaths, for prescription pain relievers and heroin. These visualizations are based on weighted analyses of self-reports, cross-classified by age and period, collected as part of the National Survey on Drug Use and Health from 2002 to 2017. Whereas descriptions of the U.S. opioid crisis tend to focus on period dynamics, these visualizations indicate that cohort patterns of drug use are also evident in addition to well-known age variation. A substantive focus on cohort patterns highlights the possibility that cohorts of people who use drugs may remain at risk for overdose in the years to come. These findings suggest that policies aimed only at restricting opioid availability may have limited effects.
Descriptions of the contemporary U.S. opioid crisis typically classify its evolution into several “waves” (Ciccarone 2019). The first wave lasted from the late 1990s to approximately 2010 and consisted primarily of overdose deaths attributable to prescription pain relievers. The 2010s witnessed increases in heroin overdose deaths atop still high rates of prescription-related deaths. More recent waves have been driven by synthetic opioids (primarily fentanyl) and stimulants.
Although this narrative is useful, by relying too heavily on overdose statistics and privileging a period perspective, it may obscure unfolding challenges associated with age and cohort dynamics in substance use. Sociologists often distinguish among the concepts of age, period, and cohort (Luo and Hodges forthcoming). Although there are clear reasons to expect recent period changes in substance use, such as when drug reformulations and criminal justice crackdowns restricted prescriptions in the early 2010s (Cicero, Ellis, and Surratt 2012), these expectations do not fully account for the theoretical mechanisms of addiction. Perhaps cohort differences in vulnerability to substance use disorders explains the four-decade climb in U.S. overdose deaths from all manner of drugs (Jalal et al. 2018). Cohorts of people who use drugs at elevated rates may remain at ongoing risk for overdose, even if they shift substances.
As a first step toward thinking more about such potential cohort patterns, we turn to heatmap visualizations. Figure 1 contains a two-panel visualization of rates of self-reported, past-year misuse of prescription pain relievers and use of heroin in the 2002 to 2017 waves of the National Survey on Drug Use and Health (N = 892,927; SAMHDA 2019). Each panel is cross-classified into a grid by age (vertical axis) and period (horizontal axis), and each gridded cell is colored from green (low prevalence) to yellow (high prevalence) by the weighted estimate of misuse rates per 100 people (for pain relievers), or use rates 1,000 people (for heroin), of that age in that period (see Supplementary Materials).
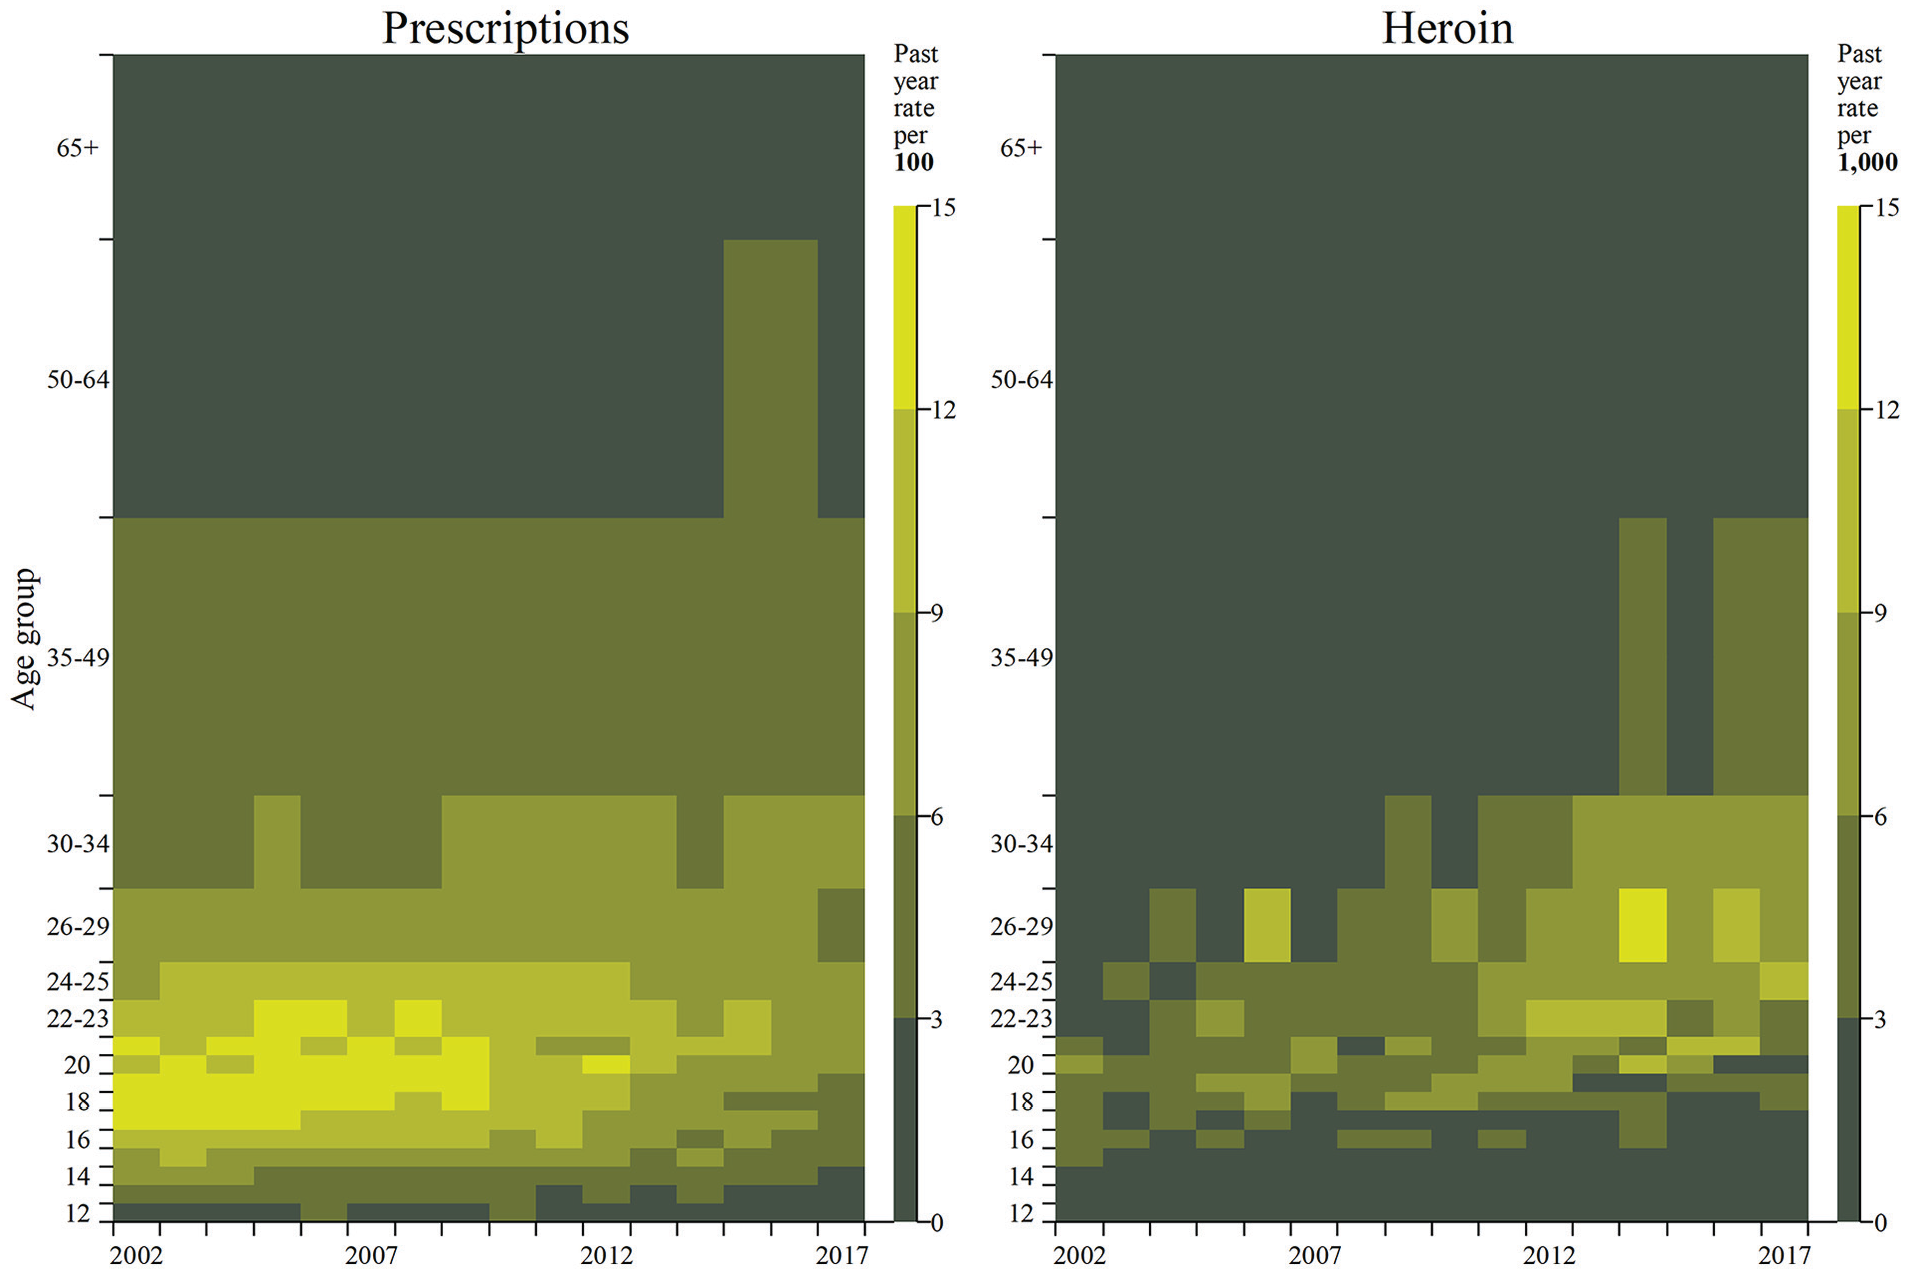
Heatmaps of past year, self-reported prescription pain reliever misuse and heroin use, cross-classified by age group and period, in the 2002 to 2017 National Survey on Drug Use and Health (NSDUH). Each cell presents the weighted estimate of each drug’s misuse or use for a given age group and period. Age patterns are visible by following horizontally, period patterns are visible by following vertically, and cohort patterns are visible by following diagonally up and to the right. Note that the heatmap colors indicate different use rates in each panel: for prescription opioids, rates are per 100 people, while rates for heroin are per 1,000 people. Also note that the age groupings are of different size because of restrictions in the public-use NSDUH data; ages 12 to 21 years are single years of age, then ages 22 to 23, 24 to 25, 26 to 29, 30 to 34, 35 to 49, 50 to 64, and ≥65 years are in groups of different sizes.
Figure 1 reveals clear, stable, and well-known age patterns of substance use; the highest rates of drug use are in late adolescence and young adulthood, although the age associations vary somewhat among periods. The figure also shows patterns consistent with period interpretations, such as the decline circa 2010 in prescription misuse. Most important, however, the figure also showcases possible cohort patterns. Elevated rates of pain reliever misuse tend to move diagonally up and to the right as cohorts aged until the 2010 period shock. Then, there is a concomitant uptick in heroin use among the same cohorts, consistent with people switching drugs. These heatmaps of opioid use complement prior documentation of opioid crisis trends based on overdose death rates. Use patterns vary by period, age, and cohort in ways that suggest drug switching and continued policy challenges associated with cohorts of people using substances at elevated rates. Worryingly, current age-adjusted overdose death rates are highest in the age range of 25 to 44 years (Scholl 2019), precisely the age groups that cohorts with the highest use rates are entering, which may foretell continued increases in overdose deaths.
Supplemental Material
RandR_SuppMatt_VisualizationPaper_HeatmapNSDUH – Supplemental material for Visualizing Age, Period, and Cohort Patterns of Substance Use in the U.S. Opioid Crisis
Supplemental material, RandR_SuppMatt_VisualizationPaper_HeatmapNSDUH for Visualizing Age, Period, and Cohort Patterns of Substance Use in the U.S. Opioid Crisis by Ashton M. Verdery, Kira England, Alexander Chapman, Liying Luo, Katherine McLean and Shannon Monnat in Socius
Footnotes
Funding
The author(s) disclosed receipt of the following financial support for the research, authorship, and/or publication of this article: Portions of this research were supported by the Social Science Research Institute, the Criminal Justice Research Center, and the Population Research Institute at Penn State University, the last of which is supported by an infrastructure grant by the Eunice Kennedy Shriver National Institute of Child Health and Human Development (P2C-HD041025). Dr. Monnat acknowledges support from the U.S. Department of Agriculture National Institute of Food and Agriculture, Agricultural and Food Research Initiative Competitive Program, Agriculture Economics and Rural Communities (grant 2018-68006-27640).
Supplemental Material
Supplemental material for this article is available online.
Author Biographies
References
Supplementary Material
Please find the following supplemental material available below.
For Open Access articles published under a Creative Commons License, all supplemental material carries the same license as the article it is associated with.
For non-Open Access articles published, all supplemental material carries a non-exclusive license, and permission requests for re-use of supplemental material or any part of supplemental material shall be sent directly to the copyright owner as specified in the copyright notice associated with the article.