



Abstract
Access to institutions of higher education has increased in recent decades; however, increased access has not led to parallel increases in degree completion among all types of students. In this article, I examine the associations between individual-level factors and the particular paths through educational institutions that students follow as they navigate their educational careers. Research on educational pathways has typically examined individual educational “transitions” but failed to examine the full “trajectories” that students experience. Applying optimal matching sequence analysis techniques to the Educational Longitudinal Study of 2002, I capture the long-term postsecondary educational experiences of respondents across 107 months in early adulthood. Examining how social background factors affect the extent and ordering of postsecondary experiences over this extended period of the life course contributes to our understanding of the ways these factors may influence whole educational careers and provides a holistic counterpart to the more traditional transitions-focused literature.
Over the past half century, access to postsecondary education has grown tremendously. Despite rising costs and a shifting financial burden that places more of the cost of college attendance on students and their families, students continue to enroll in college in large numbers (Heller 2011). This is, in part, because today more than ever before, a college degree has become an important marker of social and economic success (Hout 2012). Simultaneously, postsecondary institutions have adapted to the growing enrollment by increasing the ways that students can attend postsecondary education—students now choose from an array of community colleges (Dougherty 1994; Juszkiewicz 2016), for-profit institutions (Soliz 2018; Tierney and Hentschke 2007), online programs (Allen and Seaman 2013; Andreas and Haenlein 2016), and “second-chance” programs aimed at getting dropouts back into the system (Bloom 2010) in addition to the classic four-year college or university. Patterns in which students stop out of school only to later return or attend multiple postsecondary institutions over time have also become common (DesJardins, Ahlburg, and McCall 2002; Goldrick-Rab 2006; McCormick 2003). Increases in access, however, do not necessarily lead to parallel increases in degree attainment among all types of students. While more routes through postsecondary may be beneficial, allowing students to find a path that best fits their needs, this may exacerbate inequality if disadvantaged students are disproportionately funneled into paths less likely to lead to degrees. For both individuals and our broader society, understanding how students move through postsecondary education and the factors that channel certain students down particular paths is essential.
In recent years, scholars have focused attention on understanding the causes and consequences of following certain postsecondary pathways by ever more finely defining specific transitions of interest. For example, a notable body of work focuses on better defining an appropriate comparison group when assessing the effect of attending a two-year school on the probability of transfer and BA attainment—for instance, distinguishing students based on their educational intentions or credits earned (e.g., Long and Kurlaender 2009; Melguizo, Kienzl, and Alfonoso. 2011; Monaghan and Attewell 2015). While a worthwhile pursuit, scholars of higher education simultaneously point to how extended students’ pathways are, with more students returning to school or enrolling later in life, and call on researchers to expand the time period under study. Student experiences do not occur as disconnected steps but as full careers with each enrollment decision affecting future decisions across the life course. Examining specific transitions gets us at one part of the broader picture but neglects the long-term educational trajectories that occur across multiple institutions and over many years. Less work, however, focuses on these long-term pathways. This is in part due to data challenges that arise from the complexity of the paths students follow. Students are apt to experience many more transitions and have even more diverse patterns when examined over extended time frames. Work examining long-term pathways, then, often resorts to simplifying the data and categorizing these patterns a priori.
In this article, I utilize a novel method, optimal matching sequence analysis, which allows me to model the factors that shape long-term educational careers rather than single transitions or ultimate educational attainment. Moreover, sequence analysis allows the groupings to emerge from the data itself rather than forcing the researcher to determine all relevant educational paths themselves prior to conducting their analysis. After uncovering the postsecondary trajectories followed by students, the resulting groups are then used to explore how precollege experiences predict individuals’ postsecondary trajectories. Specifically, I ask:
Research Question 1: What is the empirical reality of the postsecondary trajectories that students experience?
Research Question 2: How do academic and social background factors prior to college entry shape the likelihood of students following particular postsecondary trajectories?
By examining postsecondary trajectories rather than single enrollment decisions in this way, I contribute to our understanding of how whole educational careers are shaped as they exist in real life—long-term, sequential, and often quite messy—and reveal findings that are obscured when we focus largely on transitions. I shed light on both the existence and extent of several paths less commonly studied (i.e., a lateral transfer, unstructured, and four-year without bachelor’s degree attainment path), uncover the role of social background and academic ability prior to college entry in shaping the paths, and provide better estimates of the effects of these factors on educational experiences. My work highlights just how long a sizable group of students spend in school without earning their BA, makes clear that the factors that shape student enrollment patterns are not neutral but connected to broader stratifying forces in our society, and speaks to the potential usefulness of nontraditional pathways for some students.
Education and the Status Attainment Process
Scholars have long been concerned with questions of how people end up where they do in our stratified society. These questions motivate the body of work on status attainment, the process through which one achieves one’s place in the social hierarchy (Blau and Duncan 1967). Now a long-standing research tradition, work in this area examines how social origins shape later attainment (Blau and Duncan 1967; Sewell, Haller, and Portes 1969). These models identified education as a key component in this process influencing occupational attainment through both direct and indirect means (Blau and Duncan 1967; Sewell et al. 1969).
While education was largely included in these early status attainment models as a measure of ultimate educational attainment (Blau and Duncan 1967), subsequent work suggested that to best understand the impact of social origins on attainment, educational attainment must be conceptualized as a series of transitions (Mare 1980, 1981). Mare (1980) argued that educational sequences need to be studied, in which each step along an educational pathway is predicated upon the completion of previous steps and in which the effect of social background depends on one’s position in the sequence. Unfortunately, the call to uncover paths has not been fully realized.
Educational Transitions Literature
Today, access to higher education is widespread, with over 7,000 postsecondary institutions operating in the United States (National Center for Education Statistics [NCES] 2016) and many of them providing open access. For most students, it has become relatively easy to enter the postsecondary system in some form; however, rates of completion and returns to education vary widely between different types of institutions (Shapiro et al. 2017). As a result, researchers have suggested that attention should focus less on whether or not one attends but rather on where and how they attend (Brint and Karabel 1989).
In recent years, scholars took up this call, analyzing steps in the educational process and the predictors and consequences of different patterns of educational progression (e.g., see Bozick & DeLuca, 2005; Goldrick-Rab 2006; Monaghan and Attewell 2015; Roksa and Velez 2012). Many nontraditional enrollment patterns have been studied extensively, including delays in college entry after high school (Bozick and DeLuca 2005; Cabrera and Nasa 2001; Hearn 1992; Roksa and Velez 2012; Rowan-Kenyon 2007; Wells and Lynch 2012), transfer at the same level and between levels of higher education (Crisp and Nunez 2014; Goldrick-Rab and Pfeffer 2009), the type of institution one initially enrolls in (Hearn 1992; Karen 2002), attendance at multiple institutions (Goldrick-Rab 2006; McCormick 2003; Wang and Wickersham 2014), discontinuous enrollment (DesJardins, Ahlburg, and McCall 2006; DesJardins and McCall 2010; Goldrick-Rab 2006), and enrollment intensity (Cabrera et al. 2012; Hearn 1992). While the specific effect of social origins on educational pathways depends on the enrollment pattern under study, empirical results largely show that pathways through postsecondary are not random but occur in patterned and predictable ways based on one’s social origins and academic background. Social origins affect educational transitions, which in turn influence later attainment.
Notably, disadvantaged students are more likely to depart from traditional paths through higher education than their more well-off peers. Students who follow nontraditional paths tend to come from less advantaged social backgrounds, and socioeconomic status (SES) and academic preparation prior to college entry are the strongest predictors of nontraditional pathways (Bozick and DeLuca 2005; Goldrick-Rab and Han 2011; Hearn 1992; Roksa and Velez 2012; Rowan-Kenyon 2007). These factors influence both when and where a student initially enrolls as well as how the student moves through postsecondary after entering. Low SES students and those who exhibited poor academic performance are more likely to delay entry into college after high school (Bozick and DeLuca 2005; Goldrick-Rab and Han 2011) and are more likely to enroll in two-year or non-degree granting programs initially (Cabrera et al. 2012; Hearn 1992; Karen 2002). After entry, they are more likely to attend only part-time (Cabrera et al. 2012; Carroll 1989; Hearn 1992), transfer downward moving from a four-year school into a two-year school (Carroll 1989; Goldrick-Rab and Pfeffer 2009), and stop out (DesJardins et al. 2006; Goldrick-Rab 2006).
From Transitions to Trajectories
While we know a great deal about what shapes specific educational transitions, less is known about what shapes long-term educational careers. Typically, event history and logistic or multinomial regression analyses methods are used to examine educational pathways (see e.g., DesJardins et al. 2002; DesJardins and McCall 2010; Goldrick-Rab 2006); however, such methods commonly examine only unique transitions or specific enrollment patterns rather than full sequences of educational steps. Today, young people experience diverse educational careers that may lead them in, out, and among multiple institutions over time (Adelman 2006; Goldrick-Rab 2006), but to date, the educational transitions literature has largely captured “transitions” rather than “trajectories,” providing only a partial picture of the full influence of social background and other factors on educational experiences. 1
This distinction emerged from the life course perspective that emphasizes the multiplicity of paths an individual can take throughout the life span (Elder, Johnson, and Crosnoe 2003). The perspective highlights change in individuals’ lives over extended periods of time rather than just short-term status changes (Mayer 2009), distinguishing between trajectories, the long-term paths or lines of development that characterize an individual’s life course, and transitions, life events that occur over a shorter time period that are embedded within a trajectory (Elder 1985). While work on educational pathways using traditional statistical methods has effectively modeled transitions, thus far it has failed to capture the full trajectories experienced by young people and emphasized by life course scholars.
This is problematic theoretically because each step along an educational path is influenced by prior steps. Individual educational transitions are linked as part of a string of prior and subsequent educational experiences that may be analytically meaningful in its entirety. Focusing on only a single transition loses sight of the full educational pathways or career lines and may lead us to fail to account for how prior transitions influence later transitions. For instance, there may be some early transitions that set individuals on paths from which they cannot recover. Conversely, examining only single transitions may bias our estimates of the effects of certain background characteristics on transitions if our models do not allow for the possibility of students making transitions at later points in life.
Conceptualizing Long-Term Pathways
While little quantitative research on the factors that shape postsecondary enrollment patterns has examined long-term pathways rather than individual transitions, a few pieces, using diverse methodologies provide an exception. For instance, Goldrick-Rab (2006) examined how longer-term enrollment patterns are shaped, following students over eight years and across schools. This study is one of the first to examine not just a single transition that a student may make into or out of a single institution, but the students’ “full range of movement” with multiple potential transitions across schools and over time (Goldrick-Rab 2006:64). Goldrick-Rab coded students into a four-category typology based on students’ experiences with multiinstitutional enrollment and discontinuous enrollment, and my article builds on this by capturing additional aspects of the postsecondary experience, including the specific timing and ordering of students’ enrollment patterns. More advanced data mining techniques including cluster analysis and latent class analysis have also been used to identify typologies of students, particularly those who attend community colleges (Ammon, Bowman, and Mourad 2008; Bahr 2010; Crosta 2014; Hagedorn and Prather 2005; Marti 2008); however, much of this draws on relatively small and ungeneralizable sample sizes from just a handful of colleges (Crosta 2014) or bases their typologies on relatively few variables (Hagedorn and Prather 2005).
By applying a novel method, sequence analysis, described in the following, I was able to generate an empirical typology of postsecondary trajectories in which I allowed the data itself to reveal how students experience pathways through education. I tracked students not just across schools but in and out of educational institutions across their educational careers, thereby getting at their full range of educational experiences and capturing trajectories as emphasized by life course scholars. I then analyzed how social background factors, including socioeconomic status, race and gender, as well as educational expectations, prior educational achievement, and peer and family influence shape students’ paths through postsecondary education. By considering how different factors shape not just specific educational transitions or decisions but long-term sequences of educational movements, I broaden our understanding of who follows certain paths and why.
Data
My sample was drawn from the Educational Longitudinal Study of 2002 (ELS:2002) commissioned by the NCES. The study follows a nationally representative sample of 10th-grade students through high school and on to postsecondary attainment or work (see Ingels et al. 2014). Thus far, there have been four waves of data released for the ELS:2002. In the base year, student participants were enrolled as 10th-grade students in the spring of 2002. Additional follow-up surveys were conducted with the students in 2004, 2006, and 2012. Additionally, I utilized the Postsecondary Education Transcript Study (PETS), which contains transcript information for all students in the ELS:2002 who attended at least one postsecondary institution. This restricted-use file includes detailed information regarding respondents’ postsecondary experiences. My sample consisted of all individuals who participated in the base year ELS:2002 survey who attended at least one undergraduate-level postsecondary school between August 2004 (on-time high school graduation is spring 2004) and June 2013 and for whom a complete transcript record is available. This results in a final sample of 14,410 transcripts for 8,500 2 individuals.
Analytic Strategy
My analysis was carried out in two distinct steps. First, I applied optimal matching sequence analysis (OMA) techniques to identify postsecondary trajectories followed by the respondents. I then used the resulting groups from the sequence analysis as the dependent variable in a multinomial logistic regression examining predictors of following each trajectory.
Applying the OMA
Sequence analysis techniques were introduced to the social sciences by Abbott in the late 1980s and early 1990s (Abbott 1995; Abbott and Forrest 1986; Abbott and Hrycak 1990). Using techniques that compare whole sequences of events rather than single events or transitions, the method allows researchers to uncover meaningful groups and build typologies based on common temporal patterns that appear in the data 3 (Abbott 1995). At its core, the technique involves a two-step process. To apply the OMA, first data are coded into an ordered list of elements that expresses the states people experienced during the study period, and measures of dissimilarity are computed to quantify how similar/different each sequence is from all other sequences in the data. Second, a clustering technique is used to categorize individual sequences into substantively meaningful groups in which the members of a given group are more similar to each other than to members of other groups.
The method is suited to studying any type of career (e.g., work careers, criminal careers, or educational careers) in which people occupy a series of discrete states over time. When placed together in chronological order, these states form a sequence. The initial step of my analysis was to define the events of interest and create the sequence state object or “alphabet” that tracks the postsecondary enrollment patterns each respondent experienced over the course of approximately nine years. Student postsecondary enrollment patterns came from the PETS data and reflect each student’s monthly enrollment status over the 107 months from August 2004 to June 2013. I focused on two primary aspects of educational experiences: (1) the level of postsecondary education attended (i.e., enrollment at a four-year vs. two-year [or less] institution) and (2) the extent of churning between institutions (i.e., the number and ordering of the multiple institutions attended).
I distinguished between four-year and two-year institutions to capture the important divide between the “traditional” four-year pathway through higher education and the larger and increasingly growing two-year route. The level of school attended has ramifications for potential attainment, and research suggests that entry into different levels of institutions varies systematically by social class background (Goldrick-Rab and Pfeffer 2009; Hearn 1992; Karen 2002). I combined two-year and less-than-two-year school enrollment patterns into a single state 4 and restricted my analysis to enrollment at the undergraduate level. 5
Additionally, I accounted for attendance in multiple institutions over time and churning between institutions. Students’ pathways through education have become increasingly complex and less linear than those experienced in the past. Today, students are more likely to enroll in multiple institutions over the course of their postsecondary career (Goldrick-Rab 2006; McCormick 2003; Wang and Wickersham 2014). Indeed, the modal number of institutions attended by respondents in my sample was three. I coded each transcript as belonging to a student’s first, second, or third-or-more four-year institution attended or their first, second, or third-or-more two-year institution attended based on the initial enrollment dates at each. The distinction allowed me to capture movement not just between levels of schools but also movement from school to school via attendance at multiple institutions over time. I limited my focus on churning to the extent that individuals moved between their first, second, and third (or more) institutions 6 at each level.
Finally, what it means to be not currently enrolled varies by student. I accounted for four potential ways that students can be out of school: out, with no high school degree; out, with a high school degree or equivalent; out, with a BA; and finally, out, on summer break. 7 These distinctions are important because the months in which one is not currently enrolled during summer break with plans to return in the fall are substantively different than months in which one is out of school entirely; similarly, being out after having earned the BA is a qualitatively different state than being out without this degree. Ultimately, the sequence state object codes each respondent as experiencing 1 of 10 states across the 107 months, as shown in Table 1.
Sequence State Object Defining Coding of Monthly Postsecondaryª Statuses.

ªRefers to enrollment at the undergraduate level only. Students pursuing a graduate degree are considered “Not enrolled” unless they reported simultaneous undergraduate degree program enrollment.
Source: National Center for Education Statistics Educational Longitudinal Study of 2002 Postsecondary Transcript Study.
After coding the alphabet, I next quantified how similar or different each sequence was from the others using the TraMinR package in the statistical program R (Gabadinho et al. 2011b). I assigned a measure of distance between each pair of sequences by calculating the cost of transforming one sequence to match the other. Transformations are performed by either inserting or deleting elements of the sequence (collectively known as indels) or substituting one element of the sequence for another until the two sequences match (Abbott and Tsay 2000; Gauthier et al. 2009). A key part of this process involves the researcher setting costs for the different operations used to transform the sequences (indels and substitutions) with different rationales for setting costs in different ways. The distance between any two sequences is equal to the minimum number of substitutions and indels needed to transform the sequences to be identical (Abbott 1995; Halpin and Chan 1998; MacIndoe and Abbott 2004). To explore the best method for setting substitution and indel costs, I conducted sensitivity analyses in which I systematically varied the choice of substitution costs, the level of indels relative to the subcosts, and the clustering method, then examined the quality statistics of the resulting cluster solutions. This allowed me to examine the degree to which the results of the OMA are robust to the choice of costs by the researcher and identify the solutions with the highest quality statistics. Details on this procedure are included in Appendix A.
Ultimately, I utilized costs derived from the data, assigning a cost based on the probability of transitioning from one state to another state. More common transitions were assigned a lower cost, while less common transitions “cost” more. This is a common method when there is no clear theoretical justification for precisely quantifying the cost of moving from one state to another (Aisenbrey & Fasang, 2010; Day 2018). The use of data-based costs was further supported by the results in my sensitivity analysis. While the resulting groups were similar to those seen when utilizing unitary substitution costs (a common cost-setting strategy in which the cost is always equal to a given number), the average silhouette width, a measure of cluster quality, was higher at the best number of clusters for the transition-rate costs than for the groups that emerged using unitary costs. The transition matrix showing the empirical probability of moving from each state to another 8 is included in Appendix A alongside the substitution cost matrix, which reports the cost of moving from each state to every other when aligning the sequences.
Indels control the allowed time warp of the data, with insertions and deletions applied at specific points in the sequence if shifting where elements appear in the sequence will align them. For instance, if two students both followed a traditional route, but one took a gap year, their resulting sequences would look alike in many ways but would be misaligned by a year. With sequences of equal length, as in my data, indels are not strictly necessary as the alignments can occur with just the use of substitutions. I set indels at 50 percent of the largest substitution cost. A commonly assigned ratio (Day 2018; Struffolino 2019; Wahrendorf et al. 2019), this means substitutions will generally be “cheaper” and will be utilized over indels. This was desirable for my data because timing is relevant to postsecondary transitions across the life course and the use of substitutions over indels reduces potential time warp in the alignment process. Finally, after using the costs to derive the distance matrix, I used Ward’s method to cluster the results. This is a hierarchical cluster algorithm that optimizes local criteria to derive the clusters (Studer 2013). While I explored alternative clustering methods, Ward’s method provided relatively evenly sized clusters that were both intuitively interpretable and had high quality statistics.
Predicting Pathways
After uncovering the groups that emerged from the sequence analysis, I then moved beyond solely describing and classifying student patterns of postsecondary movement to explore the mechanisms by which these trajectories are formed. I conducted a multinomial logistic regression in which the identified postsecondary trajectories served as the dependent variable and examined the odds that respondents will be in each of the enrollment patterns given a set of precollege individual-level characteristics. Doing so allowed me to assess the veracity of the postsecondary trajectories I identified using sequence analysis as well as confirm and extend prior work on educational transitions and the predictors of different enrollment patterns.
Independent Variables
I incorporated individual-level variables in my models that reflect the predictors used by early mobility scholars (Blau and Duncan 1967; Sewell et al. 1969; Sewell and Hauser 1972) and have been shown to still be meaningful in more recent work on educational transitions (Goldrick-Rab 2006; Hearn 1992; Rowan-Kenyon 2007). I include variables that capture demographic factors, educational ability and academic performance, occupational aspirations, educational expectations, and family and peers’ impact. Appendix B provides a detailed description of each of the variables included in the analysis.
Results of the Sequence Analysis
Identifying Postsecondary Trajectories
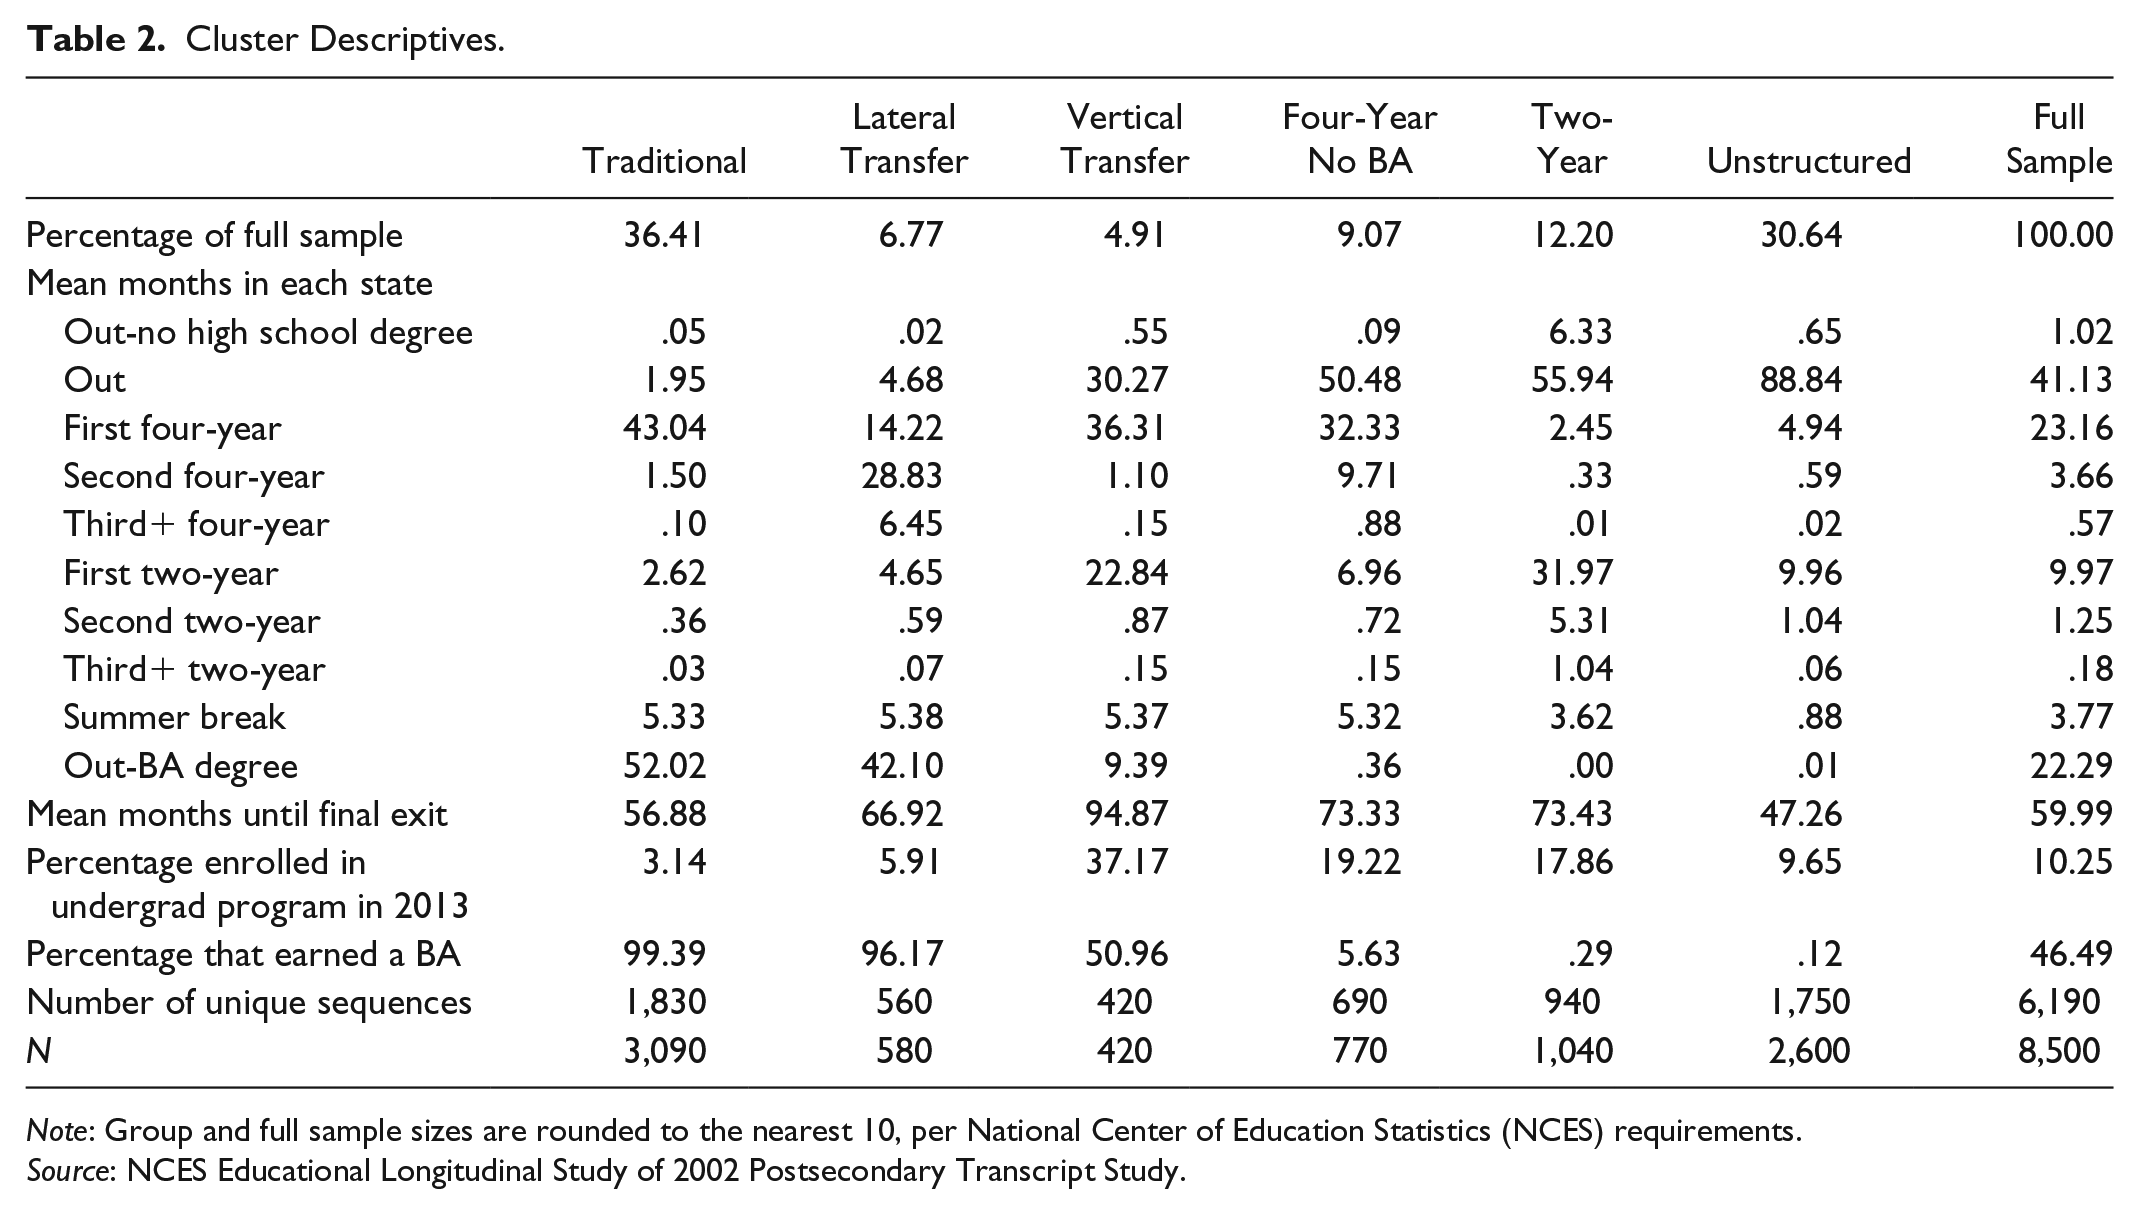
After clustering the sequences using the calculated distances, my results suggested six distinct groups within the relative chaos of all the respondents’ individual postsecondary trajectories. This six-group solution had the greatest average silhouette width while also appearing to create substantively meaningful groups. In the following, I present and describe the six clusters identified by the optimal matching sequence analysis. Table 2 provides descriptive information on each of the six clusters, showing how they vary in terms of the number and types of schools attended, when students attended these institutions, and when they exited, while Figures 1 and 2 present the clusters graphically. Each thin horizontal line in Figure 1 represents a single unique sequence in the data set, and the 107 months are represented by dashes along the x-axis. Figure 2 is a distribution plot showing the proportion of individuals in the cluster in each of the 10 states at each of the months. The information from the tables and figures was used to inductively assign names to the clusters.
Cluster Descriptives.
Note: Group and full sample sizes are rounded to the nearest 10, per National Center of Education Statistics (NCES) requirements.
Source: NCES Educational Longitudinal Study of 2002 Postsecondary Transcript Study.

Index plot of individual sequences, by cluster.

State distribution plot, by cluster.
Cluster 1: Traditional Pathway
The first cluster resembles what is commonly thought of as a traditional pathway through education. Figure 1 shows that this cluster is dominated by sequences characterized by enrollment in one’s first four-year institution. Very large proportions (about 90 percent) enrolled in their first-four year over the first four years, or 48 months. The proportion who are out with a BA then increases markedly after this point, with nearly 100 percent of the individuals in this group earning a BA by 2013. The pathway also captures a smaller number of sequences that depart from the usual timing of a “traditional” path. Individuals who remained in their first-four year longer than four years and those who entered later also appear in this cluster if their postsecondary sequence was primarily characterized by enrollment in their first four-year school. Notably, those who follow a “classic” two-year to four-year transfer path also appear in this group. Those who successfully transferred to their first four-year after approximately two years in a two-year school are closer in distance to the “traditional” group than to any of the other identified groups. On average, individuals following this path exited postsecondary for the last time (within the time frame of the study) after 56.88 months, or just under five years after their on-time high school graduation. Only a small amount, approximately 3.1 percent of individuals, were still enrolled in postsecondary education at the undergraduate level in 2013. Not surprisingly, this is the largest cluster, and approximately 36.4 percent of the sample followed this trajectory.
Cluster 2: Lateral Transfer: Four-Year Pathway
The second cluster contains sequences also dominated by four-year enrollment and ultimate BA attainment but in which students appear more likely to exit their first school and enter another institution at this same level of education. Figure 2 shows that while most individuals in this cluster begin in a four-year school, over time, the number enrolled in their first four-year declines as the proportion who enroll in their second and third four-year institutions grows. While students in the traditional pathway, on average, spend less than two months in their second or third four-year schools, students in the lateral transfer spend 29 months and nearly 7 months in their second and third four-year schools, respectively. Because this cluster is characterized by four-year enrollment and enrollment between multiple schools at the same level, I call it the lateral transfer: four-year pathway, hereafter the lateral transfer pathway for brevity. Students on this path also exit school later on average. While the majority of those on this path have earned their BA by 2013, approximately 6 percent of the individuals in this cluster were still enrolled at the undergraduate level for at least one month in the spring of 2013, and on average, those following this path do not exit postsecondary until February 2010, nearly a year later than those on the traditional path. This cluster contains 6.8 percent of the sample.
Cluster 3: Vertical Transfer: Extended
Cluster 3 also has a relatively high proportion of individuals who ultimately earn their BA; however, this pathway primarily contains students who began their college career in a two-year school and whose path to the BA was extended over a significant span of time. The sequences within this group largely begin at a student’s first two-year school; attendance at that school is then combined with later enrollment at a first four-year school—however, this typically does not occur until three or more years after high school graduation. On average, these students spend large proportions of time in their first two- and four-year institutions, spending roughly 23 months in their first two-year school and 36 months in their first four-year school over the 107 months. They spend relatively little time, less than two months on average, in either their third or second two- or four-year schools. Individuals in this pathway exhibit the longest time to exit, spending nearly 95 months enrolled on average before final exit, and they are also the most likely to still be enrolled at the end of my time frame, with 37.2 percent of individuals in this cluster still enrolled at the undergraduate level in spring 2013. The smallest group, this cluster contains 4.9 percent of the sample.
Notably, while these students experience a “vertical transfer” moving from a two-year to a four-year school to a degree, their enrollment timing does not correspond to the idealized two years to transfer pattern. Rather, for these students, the route from a two-year to a four-year is extended over a considerable length of time. And while only approximately half of the individuals in this pathway have earned the BA by 2013 (51 percent), many are still actively pursuing an undergraduate postsecondary degree at the end of the time frame under study. Here we see a benefit of following students over a much longer time period and of the sequence analysis technique. The method can identify individuals whose underlying patterns are similar even though they may not directly correspond to our definition of a classic vertical transfer transition pattern.
Cluster 4: Four-Year No BA Pathway
The fourth cluster contains sequences of those who spend a considerable amount of time enrolled in a four-year school but who despite this, are distinguished by their failure to earn a BA by the end of the nine years. Approximately 80 percent of the individuals in this cluster enrolled in their first four-year institution immediately after high school in the fall of 2004, with the proportion so enrolled declining steadily over the next five years as the proportion who are out grows. Students on this path spend just over two-and-a-half years, on average, in their first four-year and nearly 10 months in their second four-year school; however, only 6 percent of individuals in this group earned a bachelor’s degree by June 2013. Notably, the individuals who earned their BA among this group largely earned it toward the very end of the study period between 2011 and 2013. While the majority of this group is unenrolled without a BA at the end of the study, 19 percent of students on this pathway remain enrolled in postsecondary at the undergraduate level in the spring of 2013, suggesting the pursuit of a four-year degree is still an active endeavor for many on this path. These students also spend relatively little time in a two-year school (less than seven months on average). This cluster contains 9.0 percent of the sample.
Cluster 5: Two-Year Pathway
The fifth cluster, the two-year path, contains sequences dominated by attendance in two-year institutions with little time spent in four-year schools and, as a result, almost no one who earns a BA. Students in this cluster are more likely to have spent time out of school without a high school degree and less likely to continue to a four-year school compared to those on the vertical transfer path. On average, students in this path spent 6.3 months out of high school without a diploma or GED, 32 months in a first two-year school, and 5 months in a second two-year school. They spent less than three months in their first four-year school. And while every other group spent less than a month in their third+ two-year school on average, those in the two-year pathway spent the most time in this state—1.04 months. On average, individuals following this trajectory exit postsecondary for the last time after 73 months, approximately the same time as those on the four-year no BA path. In spring 2013, approximately 18 percent of individuals in this cluster were still enrolled in postsecondary education at the undergraduate level. This cluster contains 12.2 percent of the sample.
Cluster 6: Unstructured/Out Pathway
Finally, the sixth cluster reflects an unstructured or mainly out pattern. The second largest group, with 30.6 percent of the sample, this cluster shows no clear patterns in terms of the type or order of enrollment. Rather, these sequences are defined by the large amounts of time spent out of postsecondary without a BA degree and by the chaotic and unstructured nature of their enrollment patterns. These sequences reflect large stop out gaps in enrollment as well as enrollment sequences with short attendance periods at a variety of types of institutions. On average, students who are part of this trajectory spend 89 months, or 83 percent of their time, out and unenrolled, and less than 1 percent of students on this path earn their BA by 2013.
Results of the Multinomial Regression
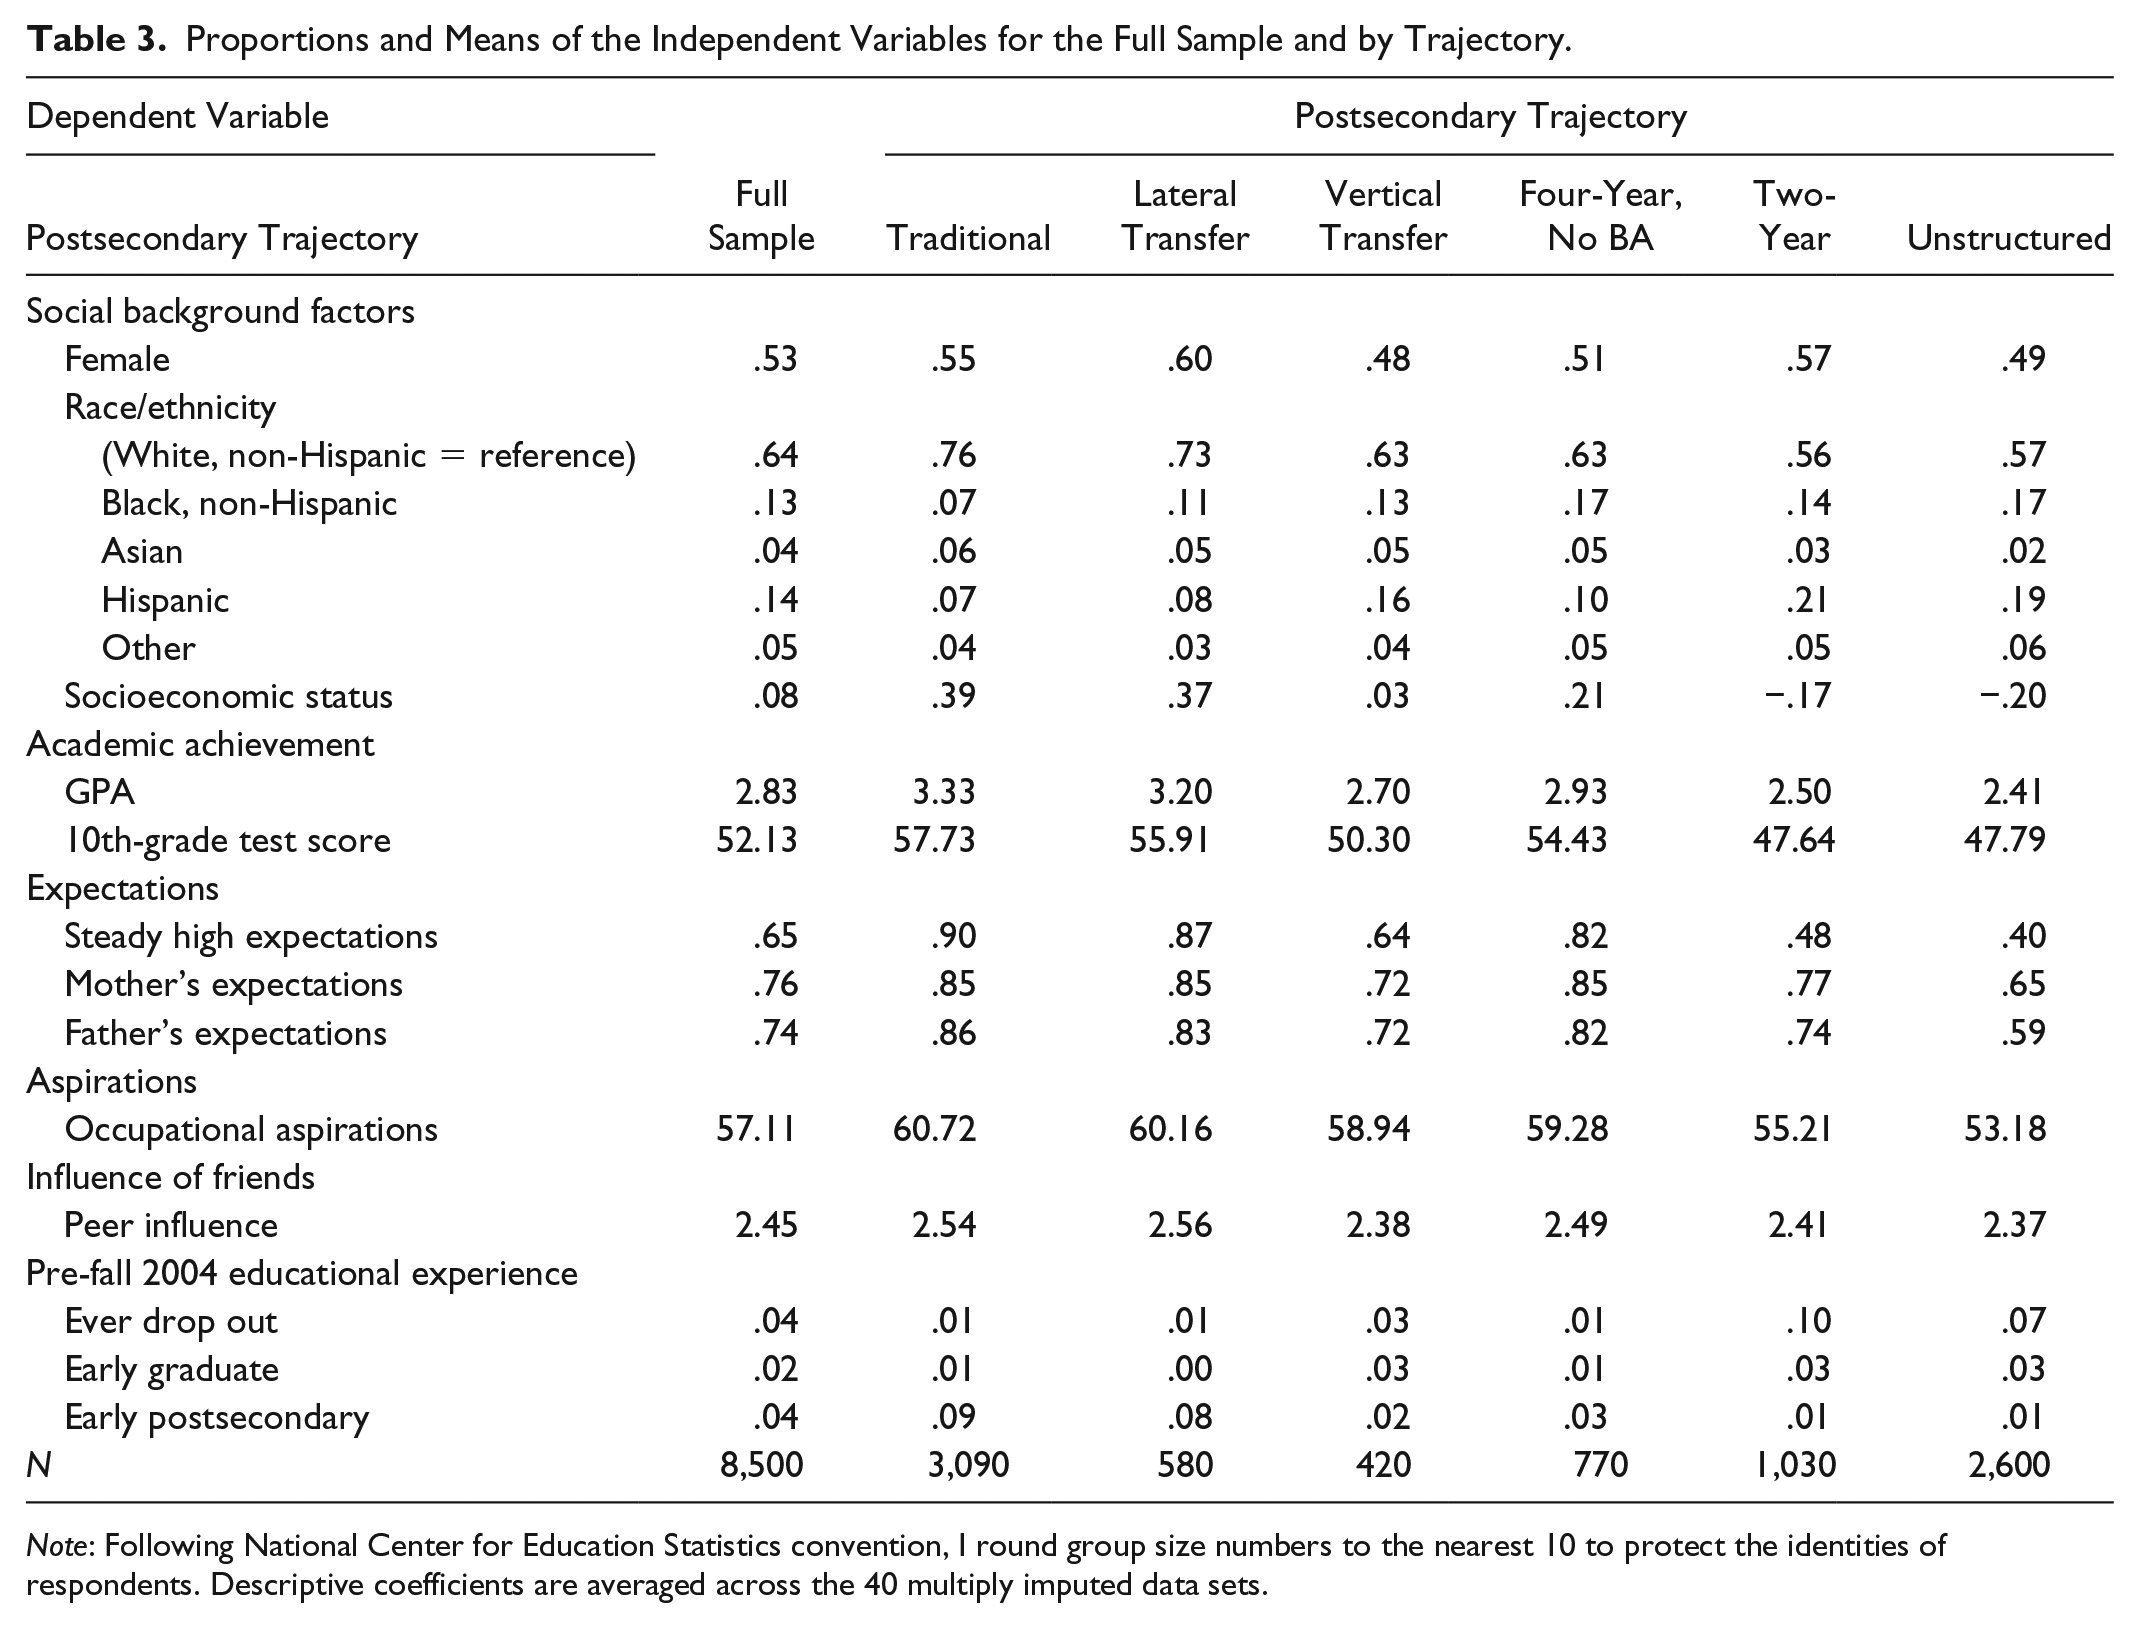
I next turn to the multinomial logistic regression to examine the predictors of following different paths. Table 3 provides the proportions and means for the independent variables and controls for the full sample and by pathway, and Table 4 presents the regression results. Models 1 through 5 in Table 4 show the results of running the model with alternating base outcomes. In Model 1, the traditional pathway serves as the reference group. In Model 2, the lateral transfer pathway serves as the reference group. In Model 3, the vertical transfer pathway serves as the reference group. In Model 4, the four-year no BA path serves as the reference group. And in Model 5, the two-year pathway serves as the reference group. Only the reference group changes in each model, and the independent variables remain the same. In each subsequent model, there is one less column of output because that comparison already appears in the table in the previous models. I present the results as odds ratios in the table.
Proportions and Means of the Independent Variables for the Full Sample and by Trajectory.
Note: Following National Center for Education Statistics convention, I round group size numbers to the nearest 10 to protect the identities of respondents. Descriptive coefficients are averaged across the 40 multiply imputed data sets.
Multinomial Logistic Regression of the Odds of Experiencing Different Postsecondary Trajectories: All Comparisons.

Note: Following National Center for Education Statistics convention, I round all sample size numbers to the nearest 10 to protect the identities of respondents. Data come from the Education Statistics Educational Longitudinal Study of 2002. Restricted to base-year participants for whom postsecondary transcripts are available. Missing data have been multiply imputed. Models have been adjusted to account for clustering within schools and weighted with student weight F3BYPNLPSWT.
p < .05. **p < .01. ***p < .001.
Unsurprisingly, as one’s SES increases so does one’s likelihood of following a path that involves four-year college enrollment and BA attainment. Model 1 of Table 4 shows that as SES increases, one’s odds of following the vertical transfer, four-year no BA, two-year, and unstructured paths each decline relative to one’s likelihood of following a traditional path (the reference group). Notably, there is no significant difference in the likelihood of following a lateral transfer path compared to the traditional path due to SES. Model 2 in Table 4, in which lateral transfer is the reference group, shows similar results. As SES increases, students are more likely to follow a lateral transfer path than the vertical transfer, four-year no BA, two-year, or unstructured paths. Thus, SES appears to operate similarly for the traditional and lateral transfer paths. Examining the other comparisons in Table 4 reveals that while there is no effect of SES on following the vertical transfer as opposed to the four-year no BA route, higher SES increases the odds of both vertical transfer and following a four-year no BA path relative to following a two-year or unstructured path. Ultimately, my results suggest that SES encourages movement into four-year institutions and away from two-year institutions and especially toward four-year paths that also involve BA attainment.
Race also has significant effects on the trajectory one takes through postsecondary. The results reveal no differences between white and black respondents in their likelihood of following the lateral or vertical transfer paths compared to the traditional path; however, black students are more likely to follow the four-year no BA path and less likely to follow the two-year and unstructured paths than their white counterparts, as opposed to the traditional path. They are also more likely to follow a four-year no BA path than a vertical transfer path by a factor of 2.36. Because the interpretation of multinomial logistic models requires each of the coefficients to be understood relative to the base category in each model, average marginal effects (AMEs) can be useful for assessing the magnitude of the effects. AMEs show the average change in the predicted probability of an outcome given a change in a single independent variable, holding the other variables constant at their observed values. Table 5 reports the average marginal effects of each of the independent variables on the probability of observing each trajectory, and Figure 3 shows the AMEs effects visually.
Average Marginal Effects from Multinomial Logistic Regression Predicting Postsecondary Trajectory.

Note: Following National Center for Education Statistics convention, sample size numbers are rounded to the nearest 10 to protect the identities of respondents. Model accounts for clustering within schools.
p < .05. **p < .01. ***p < .001.

Plots of average marginal effects, by cluster.
Holding the other variables constant, a shift in the independent variable from white to black increases the probability of respondents following the four-year no BA route by 5 percentage points and decreases their probability of following two-year path by 4 percentage points. Thus, compared to their white peers, black students are equally or even more likely to follow the paths that entail time in a four-year school—the traditional, lateral, vertical, and four-year no BA paths—but this finding is complicated by their particular greater likelihood of following the four-year path that is least likely to involve BA completion. Asian students also experience different postsecondary trajectories than white students. The average marginal effects show that being Asian, as opposed to white, increases one’s probability of following the traditional route by 8 percentage points and decreases the probability of following the unstructured route by 12 percentage points.
Gender has a slight effect on educational pathways. Compared to men, women are more likely to experience the two-year trajectory as opposed to the traditional path. However, this is a relative probability and should not be interpreted to mean that men are more likely than women to follow the traditional path in general; rather, the finding appears to be driven by women’s increased probability of following the two-year path compared to men. The AMEs reveal that while there is no difference between the genders in their probabilities of following the traditional, lateral transfer, vertical transfer, or unstructured paths, women’s probability of following the two-year path is about 2.9 percentage points higher than that of men when all other variables are held constant.
The high school grade point average and test score results show that students who displayed greater academic achievement in high school are more likely to follow paths that combine four-year institutional enrollment and earning the BA. As GPA increases, one is more likely to follow a traditional route than to laterally transfer and more likely to laterally transfer than vertically transfer. Notably, however, as GPA increases, one is also more likely to follow the four-year no BA path than to vertically transfer by a factor of 1.4 (Table 4, Model 3). With only 6 percent of those on the four-year no BA path earning a BA by June 2013 compared to 51 percent of those who followed the extended vertical transfer path, some students whose GPAs helped propel them into a four-year school directly after high school might have been better served had they followed a different path. Similar to GPA, students with higher test scores have a greater likelihood of experiencing the traditional and lateral transfer paths than the vertical transfer, two-year, and unstructured paths than those with lower achievement. Here we also see a higher likelihood of being in the four-year no BA group as test scores increase compared to vertically transferring.
Expectations and aspirations also shape educational pathways, with one’s expectations for themselves having the greatest effect. Maintaining high expectations between 10th and 12th grades significantly predicts following the traditional, as opposed to the vertical transfer, two-year, and unstructured routes as seen in Table 4. Indeed, the AMEs show that holding the other variables constant, switching from low to high expectations increases the predicted probability of being in the traditional group by .11 and decreases the probability of being in the unstructured group by .12. Altering the base categories in the regression reveals that high educational expectations encourage paths that involve initial enrollment at the four-year school level. While the predictions of difference in the odds between the traditional, lateral, and four-year no BA are not significant, there is a greater likelihood of following each of these paths than the vertical transfer path when one maintains high educational expectations. In contrast, the influence of others’ expectations does not appear as pronounced on educational trajectories. High paternal expectations appear to act primarily to discourage unstructured paths and encourage traditional paths, while mother’s expectations have few significant effects.
High occupational aspirations appear to primarily lead individuals away from both the two-year and unstructured routes. Holding high occupational aspirations leads individuals on pathways that tend to involve enrollment in four-year institutions but apparently does not affect the specific four-year route that is followed. Finally, perceiving one’s peer group as positively valuing school and acting in ways that promote educational attainment appears to have the strongest effect in relation to discouraging vertically transferring. While there are no significant effects of peers on vertically transferring as opposed to following the two-year or unstructured paths, students who perceive a more academically oriented peer group are more likely to follow the traditional and lateral transfer paths than the vertical transfer path. This suggests that having peers who value education may be particularly important for students who are on the cusp of entering a four-year school.
Traditional Coding of Paths Compared to Sequence Analysis Coding
When examining educational transitions, scholars often must make complicated choices about what “counts” as experiencing a given enrollment pattern or transition. Often, the individual experiences of students may not map perfectly onto what we theoretically consider a typical transfer enrollment pattern or traditional enrollment pattern. Is five years spent in a four-year school a traditional path? What about someone who attends a four-year school for four years but who also attends a community college in the summer to earn additional transferable credits? The challenge, then, is to determine how to code individuals with highly variable paths. Common solutions to this problem typically simplify the data, reducing enrollment patterns to yearly states; look only at certain transitions of interest; or eschew such labels altogether. However, doing so results in a loss of valuable information. Such choices are often at least somewhat arbitrary and may miss or oversimplify the experiences of individuals who spend very little time in postsecondary or who have particularly complex paths. Indeed, my data revealed that the second largest cluster was made up of individuals whose postsecondary experiences did not fit the commonly examined paths described in the literature.
By allowing these groups to emerge from the data itself, I can more accurately assess the factors that lead individuals to follow particular long-term paths through postsecondary. To underscore this point, I carried out an additional supplementary analysis wherein I estimated simple logit models that examined the odds of following a given path versus all other paths, comparing my coding of each pathway that emerged from the optimal matching sequence analysis to a more traditional way of coding by defining the paths a priori. For instance, I compared my traditional cluster to the set of students who entered college directly after high school and spent at least 32 months in a four-year school over the next four years and eventually earned a BA. This allowed me to check the robustness of my results and consider where my results differ from more classic ways of coding pathways.
I found that in general, my results are very similar to those seen with the use of a simpler coding scheme (see Figure 4 for plots of the coefficients of each model and Appendix C for a description of the coding choices and tables containing model results). The relative consistency between the results suggests that my six clusters are meaningful and accurately aligned with traditional coding schemes. However, the magnitude and direction of some coefficients varies between the models. For instance, in the simplified coding model, many of the coefficients for the traditional outcome were biased downward. This is likely because the coding of traditional in this case captured many individuals who were more accurately lateral transfers. For these effects and others, then, not following these individuals over a long enough time period or across multiple schools results in biases in researchers’ estimates. Indeed, the simplified coding suggested several race effects that disappear when student pathways are not artificially constricted by coding challenges and allowed to be more complex over a longer time span. Similarly, I found that the effect of being female on two-year enrollment varied by coding scheme. With the basic coding scheme, being female was not significantly associated with the two-year school route, while the model predicting the two-year pathway cluster showed that being female actually increases one’s odds of following this path. I suggest this is because I am better able to capture women who entered the two-year path later in their life course.

Comparison of classic and cluster coding.
Conclusion
Understanding how postsecondary enrollment patterns are shaped is relevant to our understanding of stratification more broadly. In theory, individuals who work hard, do well in school, and go to college can overcome any initial disadvantage. However, scholars have called this optimistic assumption into question (Alexander, Entwisle, and Olson 2014; Torche 2011). Our educational system has been implicated in the continued stratification of society and has instead been seen as a mechanism through which those in power restrict valued degrees and positions to maintain their elite status (Stevens, Armstrong, and Arum 2008). Ultimately, my work confirms that the path one follows is not neutral but deeply shaped by social origins, and one’s social background affects not just the transitions seen among those who head off to college shortly after high school but also how one chooses to continue one’s education across the years. By examining how not just educational transitions but long-term educational careers are shaped, I shed light on how our postsecondary institutions perpetuate stratification, with some paths clearly more available or viable to certain types of students than others despite claims of open access and flexible ways to move through.
Understanding the empirical reality of the paths that exist is the first step toward designing policy tailored to helping students on those paths. Applying the sequence analysis revealed the considerable size of two paths that have traditionally received less empirical or theoretical attention from scholars of higher education—the lateral transfer and unstructured paths. Today, notable numbers of students who begin in a four-year school later go on to attend at least one other school (Kalogrides and Grodsky 2011), and my work highlights the need for further attention to be paid to this group. Notably, I found little difference in what predicts following the lateral transfer path, in which students move across multiple four-year schools, versus the traditional four-year path, in which enrollment is concentrated in a single school. Thus, the lateral path may serve as an equally useful path as the traditional path. In today’s postsecondary landscape, with college costs increasing and students acting as consumers, the lateral transfer path may be an effective route for individuals to seek out the school that best fits their personal needs. Conversely, students on the lateral transfer path exit school later, on average, than those on the traditional path, and this is likely to increase both their student debt and the opportunity costs reflected in the lost wages they could be earning had they already exited postsecondary. Thus, while there may be few differences in who chooses to follow these two paths by social background, the paths may not be equivalent in the degree to which they lead to later attainment. My results suggest the possibility that some “nontraditional” paths may work better for some students than others, and continued attention should be paid to the students on this pathway and for whom it is most successful.
Additionally, while scholars have spent considerable attention predicting elements of the unstructured path (e.g., dropout, stop out, and gaps after high school), our understanding of the experiences of individuals on this path is limited by the very challenge of conceptualizing it as a meaningful path in and of itself. Those who follow unstructured paths are difficult to study because they, in essence, follow no path—their movement in and out of postsecondary is often brief or complicated. However, this was the second largest group in my study. Identifying this group empirically is the first step in understanding their experiences and potentially developing policy that will help to keep these students enrolled. For instance, while colleges and universities already track students’ past enrollment histories to assign transferable credits and appropriately place students in courses, they could also use this information to identify students whose paths have been unstructured to date when they enroll. Just as institutions recognize many forms of “nontraditional” students who may need additional help navigating the college landscape—those who are older or first generation, for instance—schools could similarly target programming specifically toward students who have followed unstructured paths.
My results also revealed that black students are no less likely to follow four-year paths than similar white students but that they are most likely to follow the four-year path that does not result in bachelor’s degree attainment. This finding is consistent with existing scholarship showing a net advantage for black students in four-year enrollment after controlling for relevant background characteristics (Bennett and Xie 2003; Ciocca Eller and DiPrete 2018; Merolla 2018) but that despite this, black students are more likely to end their educational careers without completing a bachelor’s degree (Ciocca Eller and DiPrete 2018; Merolla 2018). However, by not restricting my sample to four-year schools and instead following students across multiple institutions at multiple levels over time using the sequence analysis, I found that black students are also less likely to fall back on pathways involving two-year schools than their similar white peers. This finding speaks to broader questions about stratification. Two-year routes, often lauded as access points for underrepresented minorities to enter postsecondary, may not be fulfilling their promise for these students. Descriptives show that black students in my sample are not less likely than white students to enroll in a two-year school ever (t test, p > .001), yet their lower odds of experiencing the two-year paths suggest they are not maintaining this enrollment over time or using it as a steppingstone to a four-year school.
Further, if many of these students are spending considerable time in a four-year school without getting a degree, this has ramifications for their future life chances. Ciocca Eller and DiPrete (2018) identified black students’ persistence toward the four-year degree, despite weaker academic and social resources, as an important source of their educational gains as a population. Following respondents across the nine years in my study, however, highlights the potential negative effects for individual students. Those following the four-year no BA path spend over three and a half years in a four-year school on average, with no BA to show for it and with hefty debt likely accrued and potentially years of lost opportunity costs. This is not to argue that these students should be funneled away from four-year enrollment; rather, future work needs to understand the experiences of black students who follow the four-year no BA and unstructured routes more fully. Do we see patterns in which they are entering and exiting multiple institutions quickly? Or do they enter postsecondary once but subsequently drop out and never return? What institutional barriers and personal challenges do they encounter after enrolling in four-year schools that shape their persistence and movement across these schools?
Thus, my findings point to the need to examine how student trajectories are shaped by experiences that occur while the students are enrolled in postsecondary and should be understood alongside current work in this area. While my analyses focus on the role of precollege factors in shaping student movement, postsecondary institutions themselves are key players in student success. Tinto’s (1993) classic theory of student retention argued that a student’s academic and social integration are important predictors of whether he or she will remain enrolled and eventually graduate from a given institution. Recent work has highlighted the role of school policies and structures related to remedial courses (Bettinger and Long 2009), the balance of full- as opposed to part-time and adjunct instructors (Ehrenberg and Zhang 2005), and counseling (Castleman and Goodman 2018) among many institutional factors that have the potential to shape student persistence. Similarly, students’ life experiences that occur during the time they are enrolled but are unconnected from their institution—having a child, facing an illness, encountering a financial setback—may all shape their subsequent pathways (Merolla 2018). Understanding the events that occur once students are enrolled and how these events themselves may be differentially shaped by students’ background as well as the postsecondary paths they follow, while beyond the scope of this project, are fruitful avenues for further research. The sequence analysis may be particularly useful in that it can direct a researcher to the students whose in-college experiences should be examined more fully based on the pathway they experience.
While I shed light on the existence, extent, and major enrollment patterns that characterize the six pathways I identify, there are many transitions within those pathways that deserve attention. Although sequence analysis allows for far more complexity than many traditional methods of conceptualizing enrollment, the 10 states I delineated in the sequence analysis cannot fully capture the true complexity of individuals’ postsecondary enrollment patterns, and inevitably, there is still some required degree of simplification of the data. Work on educational transitions is a worthwhile pursuit in its own right, and more attention should continue to be paid to identifying the factors that are associated with specific college enrollment experiences, such as dual enrollment and stop out periods of different lengths.
Finally, my analysis is focused on a group of students within one same-aged cohort. A limit of the ELS data is that it does not allow one to capture those college goers who diverge even further from the traditional student, those entering or reenrolling in postsecondary in their late 20s and beyond. Approximately 10 percent of my full sample was still actively enrolled and pursuing an undergraduate degree in the spring of 2013, with variation in this proportion across the different pathways. Thus, my findings clearly speak to the need for future work and future surveys to follow students over an even more extended time frame across the life course so that the experiences of all college goers can be captured. Today, with many individuals remaining enrolled or returning to school years after leaving high school, scholars, educators, and policymakers need to be attuned to alternative paths and identify ways to help students effectively navigate them. Ultimately, higher education in the United States provides opportunity in many forms and in recent decades, through many paths. Open access means more ways to move through schools, but this will only reduce stratification if students are equally able to access and move along the paths that lead to successful outcomes.
Footnotes
Appendix A. Details on the Optimal Matching Sequence Analysis: Choice of Costs and Clustering Method
Part of the process of carrying out a sequence analysis is assigning the costs for indels and substitutions that will be used to calculate the distance between any two sequences in the data. The researcher must then choose a clustering method and examine the resulting clusters for acceptable solutions.
There is no single best practice when it comes to setting costs or clustering when conducting an optimal matching analysis; rather, general suggestions and guidelines guide the researcher in choosing a strategy that best fits their data. In the following, I outline alternative cost-setting strategies and describe the process I carry out to explore the best method for setting costs and best number of clusters for my data. I systematically varied the choice of substitution costs (unitary and data-based), the cost of insertions and deletions relative to the substitution costs (.1 to .7 times the highest subcost), and the clustering method (Ward, partitioning around the medoids, average), then examined the resulting clusters visually along with their quality statistics to identify the best combinations of costs, indels, and clustering technique.
Appendix B. Variable Detail
Detailed Description of Variable Coding.

| Variable | Variable Description |
|---|---|
| Dependent variables | |
| Postsecondary trajectory | Categorical variable of postsecondary trajectories that is derived from the results of the sequence analysis. Six trajectories: traditional; lateral transfer; vertical transfer; four-year no BA; two-year; unstructured. |
| Independent variables | |
| Social background factors | |
| Female | Student self-identifies as female (0, 1) |
| Race/ethnicity | Categorical indicator of the self-identified race of the student. Reference = white. |
| White, non-Hispanic | Student identifies as white, non-Hispanic. |
| Black, non-Hispanic | Student identifies as Black, non-Hispanic (0, 1) |
| Asian | Student identifies as Asian (0, 1) |
| Hispanic | Student identifies as Hispanic (0, 1) |
| Other | Student is multiracial or self-identified as other race (0, 1) |
| Socioeconomic status | Continuous NCES-generated restricted-use composite variable of mother and father’s highest education obtained as of follow-up one (F1), mother and father’s occupation at F1 with 1989 GSS occupational prestige scores applied, and family income at the base year. Student reports are used when parent data are unavailable. The five components are standardized and equally weighted to generate the composite. Range = −1.97 to 1.97 |
| Academic achievement | |
| GPA | Transcript-reported cumulative GPA from all high school courses at most recent school attended. Range = .16 to 4.0 |
| 10th-grade test score | Continuous composite of average reading and math scores on NCES administered test. NCES generated and restandardized score to a national mean of 50.0 and standard deviation of 10.0 to provide norm-referenced measure of achievement relative to spring 2002 10th graders. Range = 22.4 to 81.04 |
| Expectations | |
| Steady high expectations | Student reports expectation to attend college in both base year and first follow-up surveys (0, 1) |
| Mother’s expectations | Student reports their mother thinks the most important thing for them to do right after high school is to “go to college” (0, 1) |
| Father’s expectations | Student reports their father thinks the most important thing for them to do right after high school is to “go to college” (0, 1) |
| Aspirations | |
| Occupational aspirations | Continuous measure of the prestige of the job respondent wants at age 30. Student answers were categorized by NCES in 17 categories, with prestige scores from the 1989 GSS applied by author to each category. Range = 29.44 to 64.38 |
| Influence of friends | |
| Peer influence | Five-item scale reflecting student’s perception of friends’ attitudes regarding the importance of: (1) attending classes regularly; (2) studying; (3) getting good grades; (4) finishing high school; and (5) continuing education past high school. (1–3 = not important/somewhat important/very important) (α = .82) Range = 1 to 3 |
| Pre-fall 2004 educational experiences | |
| Ever drop out | Student experienced a high school dropout spell between 2002 and 2004 (0, 1) |
| Early graduate | Student graduated from high school prior to fall 2003 (0, 1) |
| Early postsecondary | Student postsecondary transcript record reports a postsecondary institution attended prior to high school completion (0, 1) |
Source: National Center for Education Statistics Educational Longitudinal Study of 2002 and Postsecondary Transcript Study.
Appendix C. Sensitivity Analysis: Basic Coding Versus Optimal Matching Coding
Logistic Regressions Predicting Odds of Following Each Path Using Basic Coding Scheme and Optimal Matching Groups.

| M1 | M2 | M3 | M4 | M5 | M6 | M7 | M8 | M9 | M10 | |
|---|---|---|---|---|---|---|---|---|---|---|
| Independent Variables | Basic a Priori Coding: Traditional | OMA Cluster Coding: Traditional | Basic a Priori Coding: Lateral | OMA Cluster Coding: Lateral | Basic a Priori Coding: Vertical | OMA Cluster Coding: Vertical | Basic a Priori Coding: Four-Year No BA | OMA Cluster Coding: Four-Year No BA | Basic a Priori Coding: Two-Year | OMA Cluster Coding: Two-Year |
| Social background factors | ||||||||||
| Female | 1.048 | .911 | 1.239 | 1.218 | 1.000 | .860 | .744*** | .939 | 1.108 | 1.282* |
| Race/ethnicity (white, non-Hispanic = reference) | ||||||||||
| Black, non-Hispanic | 1.388* | 1.165 | 1.157 | 1.243 | .482** | .755 | 1.606*** | 1.751*** | .385*** | .641*** |
| Asian | 1.451** | 1.657*** | 1.386 | 1.193 | .857 | 1.181 | .812 | 1.196 | .713* | .837 |
| Hispanic | .839 | .879 | .881 | .852 | .738 | .949 | .706* | 1.024 | .826 | 1.040 |
| Other | 1.259 | 1.222 | .795 | .679 | .639 | .654 | 1.402 | 1.209 | .510*** | .923 |
| Socioeconomic status | 1.435*** | 1.660*** | 1.568*** | 1.418*** | 1.124 | .981 | .893 | 1.091 | .752*** | .747*** |
| Academic achievement | ||||||||||
| GPA | 3.086*** | 4.347*** | 1.865*** | 1.661*** | 1.406** | .788 | .855 | .875 | .785** | .674*** |
| 10th-grade test score | 1.049*** | 1.036*** | 1.005 | 1.001 | .963*** | .975** | 1.012 | 1.023** | .949*** | .966*** |
| Expectations | ||||||||||
| Steady high expectations | 2.296*** | 2.414*** | 1.897** | 1.952** | 1.110 | 1.272 | 2.008*** | 2.059*** | .538*** | .740* |
| Mother’s expectations | 1.092 | 1.165 | 1.128 | 1.139 | 1.344 | .730 | 1.340 | 1.244 | 1.368* | 1.170 |
| Father’s expectations | 1.496** | 1.536*** | 1.032 | 1.063 | 1.505 | 1.135 | 1.161 | 1.139 | 1.003 | 1.386* |
| Aspirations | ||||||||||
| Occupational aspirations | 1.015** | 1.017*** | 1.008 | 1.009 | 1.009 | 1.027** | .998 | 1.007 | .994 | 1.001 |
| Influence of friends | ||||||||||
| Peer influence | 1.074 | 1.102 | 1.431* | 1.255 | .895 | .701* | .990 | .970 | .920 | 1.026 |
| Pre-August 2004 path controls | ||||||||||
| Ever drop out | .269* | .502 | .289* | .433 | .296* | .551 | .249*** | .263** | .341*** | 1.573* |
| Early graduate | .418 | 1.066 | .211 | .215* | 2.933** | 1.261 | 1.448 | .792 | .984 | .905 |
| Early postsecondary | 1.419 | 1.999*** | 1.627* | 1.285 | .895 | .534 | .499* | .571 | .231*** | .905 |
| N | 8,500 | |||||||||
Note: Each model is a logistic regression predicting the odds of being in a given group versus not. Dependent variables vary in each model. Following National Center for Education Statistics convention, I round group size numbers to the nearest 10 to protect the identities of respondents. Data come from the Educational Longitudinal Study of 2002. Restricted to base-year participants for whom postsecondary transcripts are available. Missing data have been multiply imputed. Models have been adjusted to account for clustering within schools and weighted with student weight F3BYPNLPSWT. OMA = optimal matching sequence analysis.
p < .05. **p < .01. ***p < .001.
1
In contrast to the educational transitions literature, sequence analysis techniques have been used extensively in research on the school-to-work transition (see e.g., Anyadike-Danes and McVicar 2005, 2010; Brzinsky-Fay 2007; Lucchino and Dorsett 2013; Quintini and Manfredi 2009;  ). However, while school is a key component of research on the school-to-work transition period, the emphasis of this work is placed clearly on employment patterns rather than educational patterns, and when education appears, it is typically captured by only a single state (e.g., “in education”) in the sequence state alphabet.
2
All sample size numbers are rounded to the nearest 10 per National Center for Education Statistics (NCES) restricted data usage requirements.
3
4
Only 730, or 3 percent, of the institutions attended by sample members are < two-year schools. In contrast, 36 percent of the institutions attended by respondents are two-year schools.
5
Months in which students were only in a graduate program are coded as out, in other words, not currently enrolled in undergraduate studies. For students who report being simultaneously enrolled in a graduate and undergraduate program, their monthly state reflects their undergraduate enrollment.
6
Enrollment in multiple institutions in a single given month is rare, occurring in only .68 percent of the months. When these cases do occur, the monthly state is coded as a student’s highest level of enrollment at the time, with attendance at a four-year school considered “higher” than attendance at a two-year, and as the student’s most recently attended institution within the four-year and two-year level categories.
7
The NCES does not distinguish between months in which students are unenrolled on summer break as opposed to months in which students are unenrolled with no plans to return. I coded months as summer if the student was unenrolled in any combination of the specific months of May, June, July, or August but enrolled on either end of the enrollment gap that occurred within these four months. For instance, if someone was unenrolled in May, June, and July but enrolled in April and August, the three months of May, June, and July would be coded as summer break.
8
While some moves between states would seemingly be impossible, this is not actually the case for most transitions as students can move back into institutions they previously attended over time. For instance, one cannot move from one’s first four-year school immediately to one’s third four-year school—one must attend one’s second four-year prior to this. However, I follow students over 107 months, and student paths are complex. Once a student has spent at least one month in their second four-year, there is no reason, in terms of the data, that they could not reenroll in their first four-year then exit it for their third four-year school. In the case of the later transition, we would see a direct move from the first four-year to the third four-year. This would be an unusual but not impossible pattern. Similarly, once someone is out, with a BA, they can still return to school to continue their education at the undergraduate level. The exception to this relates to movement between the different out states. Once one has a high school diploma/GED, they cannot go back to being out without a high school degree. Similarly, once the bachelor’s degree is achieved, one cannot transition back to out with no BA.