
Abstract
We provide an overview of associations between income inequality and intergenerational mobility in the United States, Canada, and eight European countries. We analyze whether this correlation is observed across and within countries over time. We investigate Great Gatsby curves and perform metaregression analyses based on several papers on this topic. Results suggest that countries with high levels of inequality tend to have lower levels of mobility. Intergenerational income elasticities have stronger associations with the Gini coefficient compared to associations with the top 1 percent income share. Once models are controlled for methodological variables, country indicators, and paper indicators, correlations of mobility with the Gini coefficient lose significance but not with the top 1 percent income share. This result is an indication that recent increases in inequality at the top of the distribution might be negatively affecting mobility on a greater magnitude compared to variations across the income distribution.
Keywords
Introduction
This article provides an overview of the association between income inequality and intergenerational mobility over time based on data about the United States, Canada, and eight European countries (Denmark, Finland, France, Germany, Italy, Norway, Sweden, and the United Kingdom). Over the past three decades, income inequality has increased significantly in the United States and most developed countries. Earnings have stagnated, except for those at the top end of the income scale, thus the distribution of income has become more unequal. While stagnant income among low-income individuals is worrisome, an additional concern is that increased inequality may limit intergenerational mobility, which is defined as the degree to which conditions at birth and childhood determine outcomes later in life. In other words, it measures the passing of socioeconomic standings from one generation to the next. For example, researchers use a father-son income correlation to measure intergenerational mobility. The fear is that the bigger the gap between poor and rich families, the harder it is for poor children to climb the economic ladder. Some argue that a reduction in intergenerational mobility is a consequence of income inequality (Krueger 2012; OECD 2011, 2015). The Great Gatsby curve is a scatterplot used to illustrate the inverse relationship between income inequality and intergenerational mobility: Societies with higher levels of inequality tend to have lower levels of intergenerational mobility (Corak 2013; Corak, Lindquist, and Mazumder 2014; Krueger 2012). However, whether the recent increases in income inequality cause less mobility for those at the bottom depends on the drivers for greater inequality (Chetty, Hendren, Kline, and Saez, 2014; Chetty, Hendren, Kline, Saez, et al. 2014).
Our study implements an approach that collects estimates from previous findings across time and nations. We employ a metaregression analysis to understand the correlation between inequality and mobility in North American and European countries. We collect previous estimates of intergenerational mobility (intergenerational income elasticity) and merge them to measures of income inequality (the Gini coefficient and the top 1 percent income share) by country and year. Then we perform an analysis of the correlation between intergenerational mobility (dependent variable) and income inequality (main independent variable). This approach has the limitation of not allowing us to explore the association between mobility and inequality, controlling for several other variables available in original microdata sets utilized by previous studies. However, our strategy enables us to collect several estimates of intergenerational mobility for several countries over time and measure their association with income inequality based on a wide range of databases. As a way to control for differences across databases, indicators, countries, and other factors, we estimate the overall association between inequality and mobility controlling for a series of variables related to the methodological specificities of each analysis.
We present empirical evidence regarding the extent to which income inequality and intergenerational mobility move together across time and countries. We describe the results of a metaregression analysis to answer this particular question. Our results indicate that across countries, there is a correlation between income inequality and intergenerational mobility (Corak 2013; Corak et al. 2014; Krueger 2012; OECD 2011, 2015). However, across time and within countries, increases in inequality (measured by the Gini coefficient) are not always accompanied by statistically significant decreases in mobility. We find evidence to suggest that recent increases in the top 1 percent income share does have negative associations with intergenerational mobility, even controlling for a series of other factors. This finding is an important contribution of our study to contemporary debates about negative effects of income inequality because the increase of the top 1 percent income share has been the primary driver of rising inequality in recent decades, mostly in the United States (Atkinson, Piketty, and Saez 2011; Hout 2012; Jones 2015; Keister 2014; Volscho and Kelly 2012). This suggests that the drivers of cross-country variations in income inequality may be different than drivers of within-country variations, which corroborates findings from previous studies (Chetty, Hendren, Kline, and Saez, 2014; Chetty, Hendren, Kline, Saez, et al. 2014).
Background
Inequality has increased significantly in recent decades in the United States and most developed countries. This has been driven by a steep increase in income at the top of the distribution, stagnation of incomes throughout most of the distribution, and low to no growth at the bottom (Jaumotte, Lall, and Papageorgiou 2013; Piketty and Saez 2003). An important measure to indicate income inequality is the share of income owned by the groups at the top of the distribution (Atkinson et al. 2011). In the first half of the twentieth century, several countries experienced significant decreases in top income shares as a consequence of the world wars and the Great Depression. This fall in top income concentration is primarily a capital income phenomenon (Piketty and Saez 2014). In the second half of the twentieth century, top percentile shares declined after World War II and increased in recent decades in Europe and North America (OECD 2011). The United States experienced the fastest and largest income concentration in the top percentile group (Jones 2015). As a result, this country has relatively higher inequality than other developed countries. For example, American income earners at the top 10 percent hold more than half of the national income. Those in the bottom quartile only account for 30 percent of the medium income.
Several studies have been dealing with the reasons behind the rapid increase in compensation for top earners. The significant increase in income inequality in developed countries has been driven mostly by a combination of increased wages for highly educated workers and higher incomes for top earners, who are often managers of large companies and a few other high-paying occupations (Hout 2012). The increase in wages for the highly educated is a result of a greater demand for high-skilled workers brought about by changes in technology that have increased the productivity of skilled workers (Berman, Bound, and Machin 1998). Globalization and information technology have played a role by permitting managers and other professionals to control larger operations. Specifically, globalization, in terms of a greater financial openness to foreign direct investment, and technological progress contribute to the escalated income inequality by increasing the premium to higher skills and benefiting the richest quintile of the population (Jaumotte et al. 2013). Additionally, the degree of ethno-linguistic fractionalization also contributes to income inequality: Countries with a high degree of ethno-linguistic fractionalization tend to have little income redistribution (Sturm and De Haan 2015).
Income inequality has also worsened in the United States due to institutional changes, such as a decrease in the minimum wage in real terms, the weaker role of trade unions, and lower barriers to international trade (Kalleberg 2011). The first two factors have caused wages to decline for the working population who are not at the top of the income distribution. The third factor (international trade) cannot explain the increase in inequality in the 1980s and early 1990s. However, trade may have had a quantitatively larger impact since the turn of the century, contributing to more low-paid service jobs, more well-paid skill-intensive jobs, and fewer middle-class manufacturing jobs.
An important empirical study indicates that congressional shifts to the Republican Party, diminishing union membership, lower top tax rates, and financial asset bubbles had significant influences on the rise of the top 1 percent income share between 1980 and 2008 (Volscho and Kelly 2012). These results highlight that rise in inequality is linked to policy and partisan politics, which is not only related to redistribution policies but also to establishment of economic rules before the implementation of any redistribution measures. Their evidence does not support the argument that inequality has risen as a result of natural market forces. A review about studies on the top 1 percent highlights that net worth and financial wealth ownership are more concentrated than income (Keister 2014). Rising in equality in the United States became relatively stable following the 2007–2009 recession because financial assets of top owners and housing assets of most Americans depreciated in value. Reasons to explain increases in top wage incomes are related to several factors, such as growing CEO salaries, rent seeking, demand for CEO talents and generalists, rightward shifts in Congress, declining taxes on high incomes, declining union power, and financialization.
Highly skilled workers tend to have higher incomes, which may translate into greater investments in their children. This pattern might result in greater inequality of investments in skills when comparing children of highly skilled and low-skilled workers (Becker and Tomes 1986). However, the most important quantitative factor in the increase in inequality—higher incomes at the top of the income distribution—does not reduce the investments that most families can make in their children (Kornrich and Furstenberg 2013). For instance, during the period of growing income inequality between 1988 and 1998, there was little change in parental investment in terms of child-oriented expenditures (Bianchi et al. 2004). From this point of view, an increase in inequality is not likely to affect measures of intergenerational mobility that are based on movements throughout the income distribution (Beller and Hout 2006).
Previous analyses have shown that income inequality is negatively correlated with intergenerational mobility in comparisons between countries at a given point in time (Corak 2013; Corak et al. 2014; Krueger 2012; OECD 2011, 2015). Great Gatsby curves allow us to verify whether countries with high levels of income inequality tend to exhibit high levels of intergenerational transmission of economic conditions from parents to their children (low economic mobility), as is suggested by the chairman of the Council of Economic Advisers (Krueger 2012). These figures plot countries in two dimensions: (1) The horizontal axis indicates a measure of income inequality in several countries (e.g., the Gini coefficient or the top 1 percent income share), and (2) the vertical axis illustrates a measure of mobility across generations (e.g., intergenerational income elasticity or rank measures). Higher inequality is associated with lower economic mobility across generations (Corak 2013; Corak et al. 2014), likely as a result of economic improvement being more unequally allocated among children (Brunori, Ferreira, and Peragine 2013). Some argue that the negative correlation between inequality and mobility is because income inequality “can stifle upward mobility, making it harder for talented and hard-working people to get the rewards they deserve” (OECD 2011:3). Differences between countries in the Great Gatsby curve could be a consequence in the degree of upward mobility for children of low-income parents (Corak 2013; Corak et al. 2014). These differences could also be a result of downward mobility for children of top-income parents.
Other analyses suggest that the correlation between inequality and mobility varies when we consider specific contexts within countries (Chetty, Hendren, Kline, and Saez 2014; Chetty, Hendren, Kline, Saez, et al. 2014). While income inequality has increased in the United States between 2000 and 2010, intergenerational mobility has not changed considerably. More specifically, these authors “find that children entering the labor market today have the same chances of moving up in the income distribution (relative to their parents) as children born in the 1970s” (Chetty, Hendren, Kline, Saez, et al. 2014:141). In fact, the authors interpret their result as surprising: “The lack of a trend in intergenerational mobility contrasts with the increase in income inequality in recent decades. This contrast may be surprising given the well-known negative correlation between inequality and mobility across countries” (Chetty, Hendren, Kline, Saez, et al. 2014:146). These patterns might be the result of intergenerational mobility not only being associated with income inequality but also with residential segregation, quality of primary schools, social capital, and family stability (Chetty, Hendren, Kline, and Saez 2014).
A series of studies have been emphasizing the role of commodification of opportunity, in which service and goods that were previously considered public rights have been privatized or lost considerable funding, such as adequate schooling, housing, and elderly care (Grusky and Hill 2017; Grusky and MacLean 2016; Varner, Mattingly, and Grusky 2017). Rising inequality, specifically the concentration of income and wealth at the top of the distribution, has an important association with the acquisition of opportunity. This phenomenon generates a link between increasing inequality and lower mobility.
We considered the findings of these previous studies to develop our approach of focusing on a metaregression analysis to investigate the association between income inequality and intergenerational mobility in several countries over time. Our models utilize the Gini coefficient and top 1 percent income share as measures of inequality. We expect a stronger bivariate association of our indicator of intergenerational mobility with the Gini coefficient because they are related to the variance of earnings throughout the income distribution (Allison 1978). We better explain this mechanical association in the following section. After controlling for country fixed effects (Chetty, Hendren, Kline, and Saez 2014; Chetty, Hendren, Kline, Saez, et al. 2014) and several methodological variables, we expect a stronger association of intergenerational mobility with the top 1 percent income share. This hypothesis for multivariate models derives from the findings that recent increases in inequality in developed countries are related to a rising income share at the top of the distribution (Atkinson et al. 2011; Hout 2012; Jones 2015; Keister 2014; Volscho and Kelly 2012). The next section presents the strategies used to conduct our analysis.
Research Strategy
We aim to understand the association between income inequality and intergenerational mobility (the degree to which conditions at birth and childhood determine adult chances). In particular, we focus on the question of whether higher inequality necessarily implies lower mobility. Causality is hard to establish since trends in income inequality and intergenerational mobility are results of complex social and economic outcomes. To deal with this complexity, we investigate this association by controlling for differences in the methodological approaches of previous studies. We emphasize that our models capture correlations between measures of inequality (the Gini coefficient and the top 1 percent income share) and mobility (intergenerational income elasticity), not causal relationships. The following section provides a brief explanation of the measures of inequality, measures of mobility, data sources, and methods utilized in our analysis.
Measures of Inequality
A central concept in our study is the magnitude of the variation in the amounts that people earn. Income inequality is the extent to which individual or family income differs from each other. We utilized the Gini coefficient and the top 1 percent income share as measures of income inequality.
The Gini coefficient is the income inequality measure most commonly published by statistical agencies and can be interpreted as a function of the mean difference. Any change in relative incomes at any place in the distribution will affect measured inequality. The Gini coefficient can be used to compare populations with different sizes. The disadvantage of the Gini coefficient is that sometimes the same score might be computed from different shapes along the inequality curve. In addition, the Gini coefficient does not account for population compositions (e.g., variations in age structure). Another limitation is that the Gini coefficient does not account specifically for the trend of increasing top incomes. Since recent trends of increasing income inequality are related to a greater concentration of income at the top of the distribution, the Gini coefficient might not capture the association of inequality with intergenerational mobility.
As a way to overcome limitations of the Gini coefficient, we also estimated models using inequality indices based on the shape of the income distribution. These indices refer to specific parts of the distribution, such as top measures, relative poverty, and poverty rates. A key measure includes the top 1 percent income share, which gauges how much of total income goes to the top 1 percent of earners. In this measure, changes in the relative income of those at the bottom and those in the middle may not affect inequality. These measures are important because much of the recent increases in inequality have been driven by higher incomes among the top 1 percent.
Measures of Mobility
Intergenerational mobility is a less concrete concept than income inequality, but it can be operationalized as the extent to which conditions at birth (including socioeconomic status of the parents) affect the probability distributions of income (Roemer et al. 2003). It is not possible to measure this concept in a consistent way across countries and time. Our study concentrates on the analysis of one measure related to the intergenerational transmission of income (IGTI). IGTI can be approximated by measures that aim to capture the variation in the probability of a child from a certain socioeconomic background reaching a given relative position in the income distribution as an adult. These measures refer to how much a child’s position in the income distribution (when adult) is related to the income levels of their parents.
A common IGTI measure is the probability that a child’s adult earnings will be in the top quintile conditional on being born to families whose earnings were in the bottom quintile. In fact, studies usually compute the full transition matrix of children versus parental quintile. A second measure consists of simply estimating the correlation between children and parental earnings. A more complete but less commonly used measure consists of dividing earnings into multiple centiles and then estimating a regression model where the dependent variable is the centile position of the parent and the independent variable is the position of the child (we refer to this as the rank-rank correlation). Measures based on rank are unrelated to the current dispersion in wages. This measure aims to capture how much a father’s position on the income ladder matters in relation to the position of the offspring. One limitation of these mobility measures is that they were not widely estimated for several countries and time periods by previous studies. As a result, we do not utilize them in the regression models estimated in our study.
Our article utilizes a measure of IGTI that captures the proportional difference in earnings of children born to richer parents versus poorer parents: intergenerational income elasticity (IGE). Previous studies have estimated this measure to evaluate how earnings of children are related to earnings of parents for several countries over time. These estimates allow us to organize a database for our analysis that contains a significant amount of variation in the mobility indicator. IGE is important because it indicates how much the given income position of a parent matters to the child’s position. IGE can be thought of as a ladder, where each rung represents the relative position in a society. When the rungs of the ladder are very close together, then position matters less. We refer to this indicator as an elasticity measure of intergenerational mobility. One can estimate the elasticity of children’s earnings to that of their parents: the predicted percentage change of a child’s earnings based on a parent’s earnings. A hypothetical example is “in the United States, a child born to a parent whose earnings were 10 percent higher than the mean will earn on average 5 percent more than the mean.” The intergenerational elasticity is typically estimated from an ordinary least squares regression to capture the correlation between parents’ earnings in a previous period (independent variable) and children’s earnings (dependent variable). This elasticity is usually calculated through a regression of the logarithm of children’s earnings against the logarithm of parent’s earnings. IGE is a function of the parent-child correlation: the child-parent correlation times the ratio of the standard deviation of the log of child income to the standard deviation of the log of parent income. This elasticity measures the percentage difference in child earnings for each percentage point increase in parental earnings. Higher values of intergenerational earnings elasticity mean that children’s position in the income distribution is strongly associated with parents’ position, which implies less intergenerational mobility. Usually, models utilize the earnings of fathers and sons to avoid issues related to the increase in female labor force participation across time. This estimation also considers terms that capture changes in average earnings (usually five years) due to changes in productivity, international trade, technology, labor market institutions, and other influences not correlated with parental earnings. In the United States, researchers documented that father-son intergenerational elasticity rose from about .15 to .20 in the 1980s (Becker and Tomes 1986; Behrman and Taubman 1985) to around .40 in the 1990s (Solon 1999) and to about .50 in the 2000s (Mazumder 2005). These increases were probably due to better measures of earnings across generations and larger and nationally representative databases (Torche 2015).
Data and Methods
We first conducted a comprehensive search of studies dealing with intergenerational mobility from different countries that used quantitative measures, such as intergenerational income elasticity, parental-child correlation, rank-rank regressions, and quintile transition matrices. A database was organized containing the methodological details of these papers: country of study, data source, year of children’s earnings, birth cohort of children, age(s) of children, outcome variable of children, type of income of children (individual or family), gender of children, calendar year of parents’ earnings, birth cohort of parents, age of parents, earnings measure of parents, type of income of parents (individual or family), number of years for which parental income is measured, gender of parents for which income measures are obtained, type of intergenerational mobility measure, value of mobility measure, its associated standard error, confidence interval, t test, and number of observations in the model.
We highlight that the countries included in our analysis were selected due to the availability of previous studies with sufficient methodological information to control for all variables mentioned previously. More specifically, we selected all articles that satisfied the criteria of following a standard methodology to measure intergenerational mobility and provided enough information about their estimates (Tables 1 and 2). These articles deal with intergenerational mobility in the United States, Canada, Denmark, Finland, France, Germany, Italy, Norway, Sweden, and the United Kingdom. We also reviewed articles from Australia (Leigh 2007; Murray et al. 2017), Brazil (Dunn 2007; Ribeiro 2017), China (Yuan 2015), South Africa (Finn, Leibbrandt, and Ranchhod 2016), and Vietnam (Lam and Cuong 2017). However, these studies were not included in our models because they did not provide enough estimates of intergenerational mobility over time for each of these countries and/or did not have enough information to generate the methodological control variables. Since most of the selected studies are related to the United States, our analysis captures associations between intergenerational mobility and income inequality that lean toward the context of this country. As a way to deal with this limitation, we include country indicators in several of our models as well as fixed effects for the specific study articles.
List of Countries, Data Years, Data Sources, and Authors of Selected Studies Used for the Metaregression Analysis, United States and Canada.

List of Countries, Data Years, Data Sources, and Authors of Selected Studies Used for the Metregression Analysis, Europe.

When we control our models for county and paper fixed effects, we do not have much variation in the data. For instance, only Sweden and the United States have specific papers with more than 30 estimates of intergenerational mobility for each country. Sweden has 66 mobility estimates for 1999 (Hirvonen 2008), which we merged with measures of income inequality (Gini coefficient and top 1 percent income share). The United States has 32 mobility estimates between 1983 and 2000 (Lee and Solon 2009), which we merged with the Gini coefficient. For top 1 percent income share in the United States, we were able to merge 167 intergenerational mobility estimates between 1971 and 1981 (Zimmerman 1992) and 44 between 1977 and 2000 (Lee and Solon 2009).
Information on income inequality measures was extracted from the Organisation for Economic Co-operation and Development (OECD; the Gini coefficient) and the World Top Income Database (WTID; the top 1 percent income share). Unfortunately, information on these inequality indices is not available for some years in specific countries. When the Gini coefficient information was missing, we used the average of one-year neighbors (previous year and following year) to estimate the index for a specific year in a country. In the cases of any remaining missing observations, we continued estimating averages up to three previous years and three following years. If there were only information for previous or following years, we only used one value up to five previous years or five following years. We collected variables from WTID related to the top 1 percent income share. To provide enough information for replication of our analysis, we indicate the names and descriptions of the variables as they appear in the WTID database (1110301–1110306). The original variable for top 1 percent income share is named 1110301 by WTID and has information for all countries included in our analysis. However, this original variable was missing for some years, so we replaced these observations with other top 1 percent variables that were available in the WTID database. More specifically, we used five other variables to search for information when there were missing cases for the original variable. We used the variable 1110302 for the top 1 percent income share for Canada, which was estimated by the Longitudinal Administrative Databank (LAD) of Canada. Then we utilized the variable 1110303 for the top 1 percent income share among married couples and single adults, which has information for Denmark and the United Kingdom. The variable 1110304 also has information for the top 1 percent income share among adults in Denmark and the United Kingdom. The variable 1110305 for the top 1 percent income share from tax data has information for Finland. The variable 1110306 also has information only for Finland about the top 1 percent income share, which comes from the Income Distribution Statistics (IDS) series, under which the results from the European Union Statistics on Income and Living Conditions (EU-SILC) are published in Finland. For any remaining missing observations, we used the average of one-year neighbors (previous year and following year). If missing cases still remained after this technique, we continued estimating averages up to three previous years and three following years. If there were only information for previous or following years, we only used one value up to five previous years or five following years. These measures of income inequality were matched to our database using country and year of children’s earnings as identification variables.
The next section provides our results related to the association between inequality measures (the Gini coefficient and the top 1 percent income share) and intergenerational mobility (IGE). As discussed previously, higher values of IGE imply lower levels of intergenerational mobility. Stronger positive coefficients between inequality and IGE suggest stronger negative associations between inequality and intergenerational mobility. We illustrate several Great Gatsby curves, which plot the bivariate association between inequality and mobility. We also conducted a metaregression analysis through a series of ordinary least squares regressions with IGE as the dependent variable using several independent variables: (1) the Gini coefficient, (2) the top 1 percent income share, (3) children’s earnings considered in the study (male children, female children, both children), (4) parents’ earnings considered in the study (fathers, mothers, both), (5) number of years for which parents’ earnings are measured (one year, two years, three or more years, missing information), (6) children’s age, (7) parents’ age, (8) type of children’s earnings (individual, family, missing information), (9) country fixed effects, and (10) study paper fixed effects. We also included quadratic associations of intergenerational mobility with children’s age and parents’ age. More specifically, we added age-squared terms for age of children and parents to allow for nonlinear (quadratic) associations between these variables and intergenerational mobility. Variables three through eight allow us to control the association of IGE and inequality by using different methodological strategies implemented in previous studies. Country indicators enable us to estimate within-country associations between mobility and inequality. Paper indicators allow our models to control for remaining unobserved effects related to methodological approaches as well as other factors from each context and time analyzed by these previous studies.
As a strategy to deal with nonindependent estimates within study papers, we specified that standard errors allow for intragroup correlation within papers indicating the vce(cluster clustvar) option in Stata. Observations are independent across study papers but not necessarily within study papers. This procedure affects standard errors and statistical significance but not the estimated coefficients.
In bivariate models, we anticipate that the association of the Gini coefficient with IGE will be stronger than the association of the top 1 percent income share with IGE. This is expected to happen because the Gini coefficient is a function of the variance of log earnings (Allison 1978), as is the case of the elasticities captured by IGE. In other words, IGE is directly affected by the current dispersion of earnings, which can drive the relationship between income inequality (e.g., the Gini coefficient) and intergenerational mobility in a mechanical way (Black and Devereux 2011). For example, if the cross-country variation in Gini coefficients were entirely driven by recent increases in the dispersion of labor earnings, it would affect the children’s cohort but not the parents’ cohort. As a result, the Gini coefficient would be correlated with IGE even if countries did not differ in terms of mobility. To understand why this is the case, consider a society that is perfectly immobile, in the sense that the position of children in the income distribution is exactly the same as their parents. Now assume that the dispersion of income is increasing in that society, causing IGE to go up, as the same difference in the position of the distribution brings a larger difference in terms of wages. The inclusion of the top 1 percent income share in our analysis is a way to deal with this artificial association between the Gini coefficient and IGE. The association of IGE with the top 1 percent income share is expected to be weaker in a bivariate analysis because this shared inequality indicator measures the concentration of income at the top of the distribution. This indicator does not measure the variance of earnings throughout the whole distribution. However, when controlling for all independent variables, the association of IGE can be stronger with the top 1 percent income share than with the Gini coefficient. This might happen because recent inequality increases in developed countries have been related to the growth of income share at the top of the distribution (Atkinson et al. 2011; Hout 2012; Jones 2015; Keister 2014; Volscho and Kelly 2012). Thus, mobility trends might be more related to the concentration of income at the top of the distribution (e.g., top 1 percent income share) than with variations across different levels of income (e.g., the Gini coefficient). We now present the results of our bivariate analysis with Great Gatsby curves and multivariate analysis with metaregressions.
Results
We investigate whether there is a correlation between income inequality and intergenerational mobility both across countries and within countries. We first use Great Gatsby curves to summarize a series of cross-country correlations that had been reported in earlier studies. Then, we investigate within-country variations through the estimation of metaregressions. In this case, the association between inequality and mobility is performed using a multivariate approach by controlling our estimates with variables related to the methodology of previous studies as well as fixed effects for countries and papers.
Great Gatsby Curves
Our bivariate analysis indicates a clear negative association between income inequality and intergenerational mobility in developed countries. Panel A in Figure 1 illustrates a scatterplot of these measures using the Gini coefficient as an indicator of inequality. Overall, countries with higher Gini coefficients (i.e., more inequality) tend to have higher IGE coefficients (i.e., less mobility). This pattern confirms the results of previous studies, in which high inequality levels are negatively associated with intergenerational mobility (Corak 2013; Corak et al. 2014; Krueger 2012; OECD 2011, 2015). As previously discussed, IGE and Gini coefficients are directly affected by the variance of earnings, which can influence the association between these measures. As a strategy to overcome this issue, we analyze the association between IGE and the top 1 percent income share. Given that the recent increases in inequality have been strongly driven by inequality at the top of the distribution, we analyze whether the relationship holds when using the share of income accrued by the top 1 percent of earners (Panel B in Figure 1). The bivariate association remains positive and statistically significant, but it is weaker when we use this measure that focuses only on the top part of the distribution. The correlation between IGE and income inequality is stronger when using the Gini coefficient (.666 in Panel A in Figure 1) than when using the top 1 percent (.514 in Panel B in Figure 1).
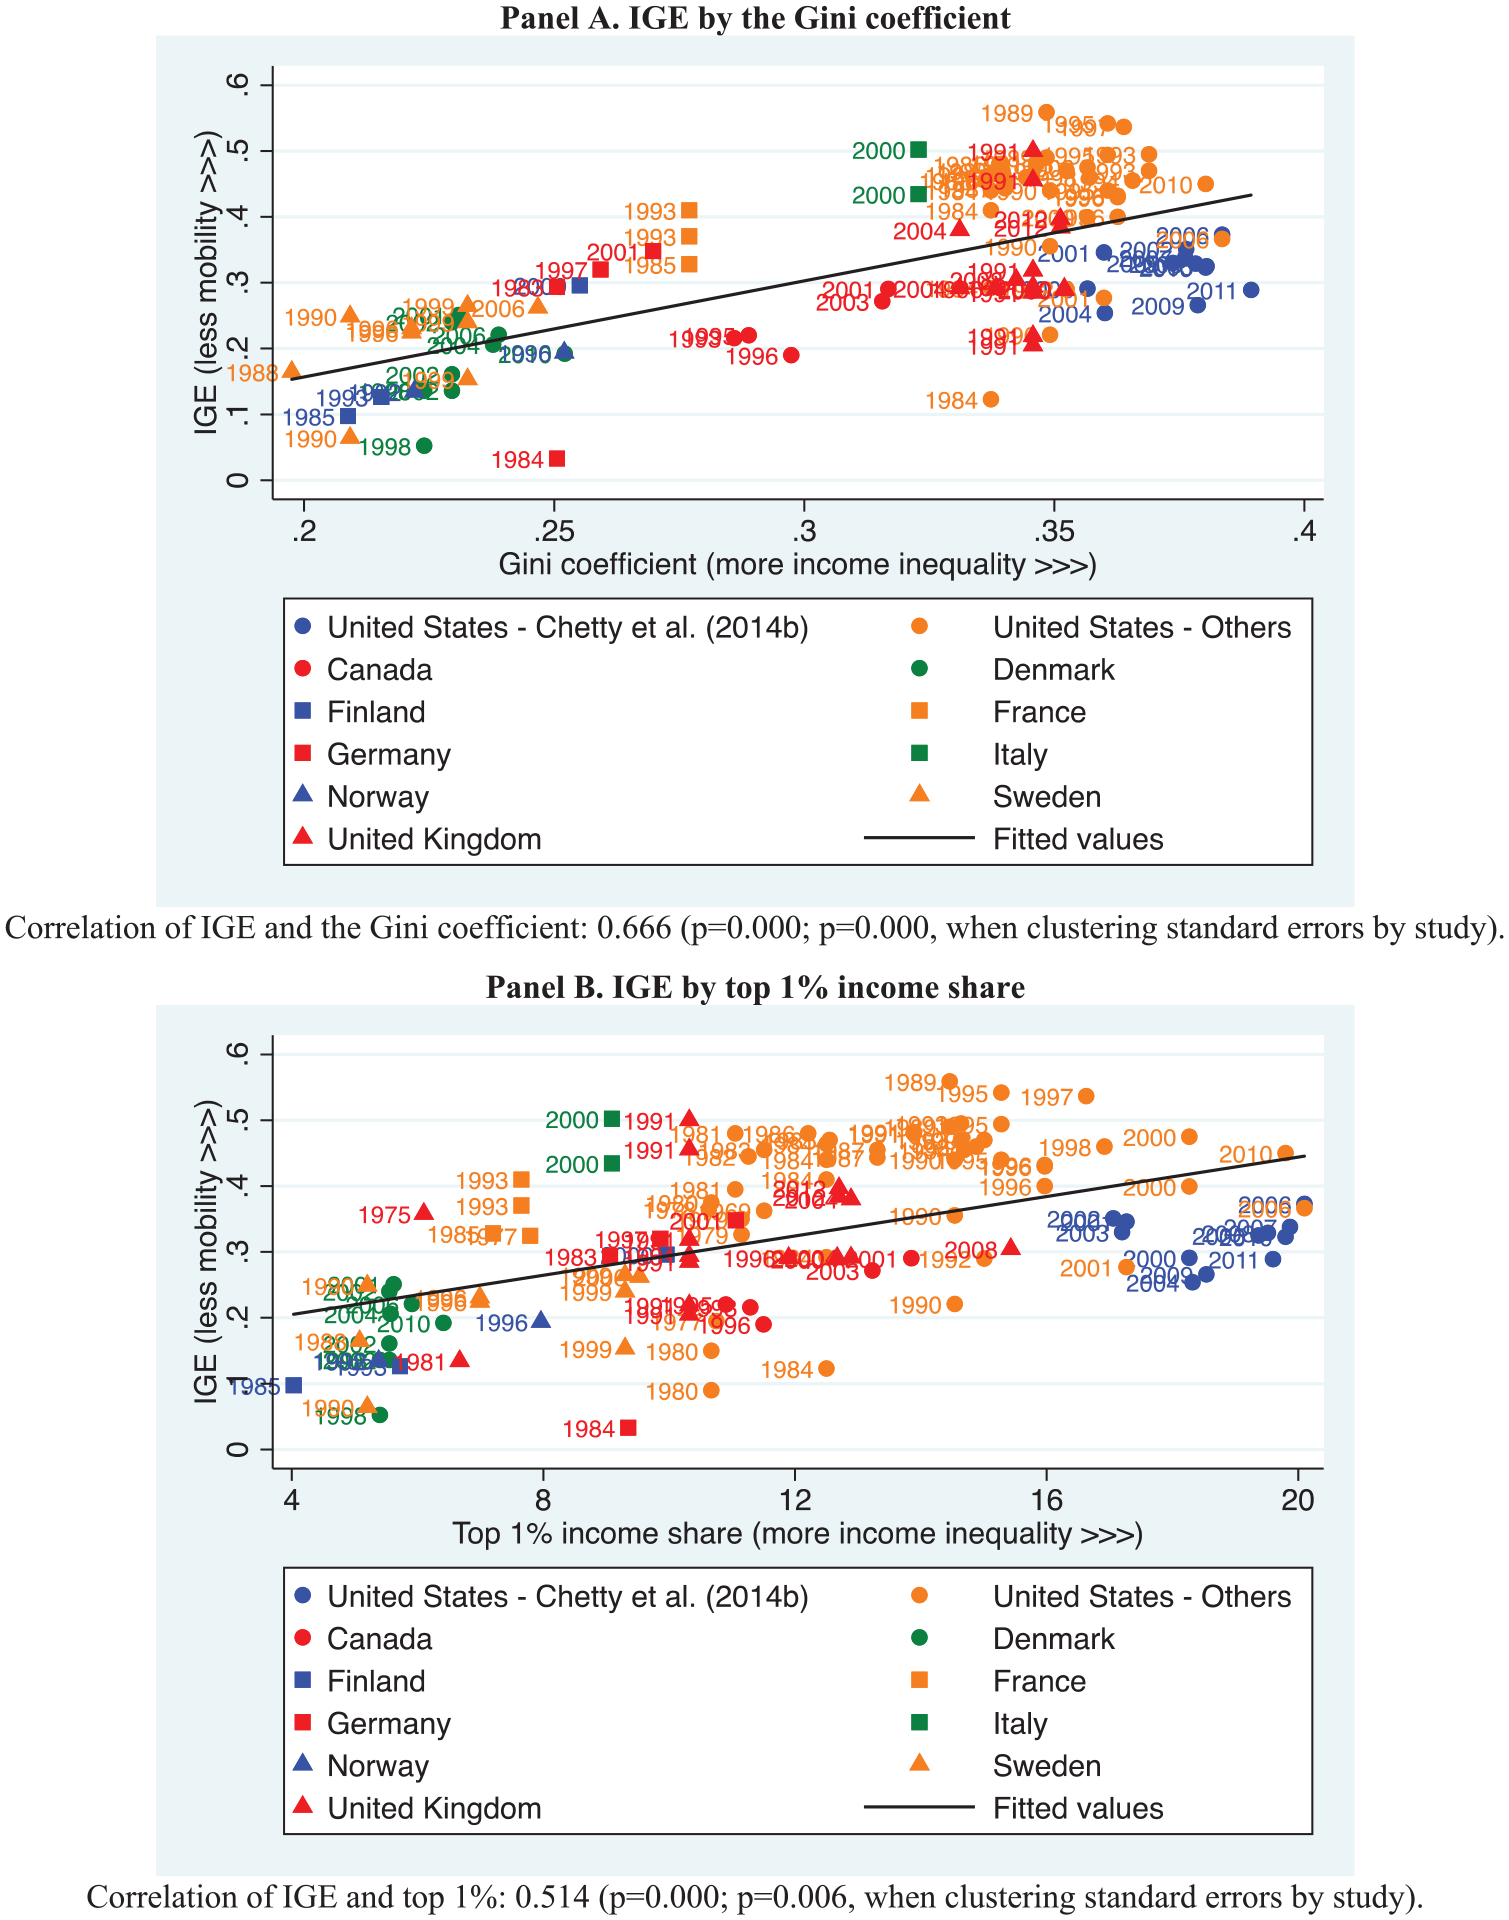
Intergenerational income elasticity (IGE) by income inequality.
We now analyze whether changes in income inequality within a country are correlated with changes in intergenerational mobility. Few studies have estimated mobility measures for a single country at different points in time using the exact same methodology and data sources. These studies allow us to observe whether correlations between inequality and mobility can be observed within a country through time. Figure 2 illustrates these patterns using two U.S. studies reflecting different time periods and data sources but fairly similar methodologies. In Panel A in Figure 2, we calculate linear trends (dashed lines) for measures of inequality and mobility using previous estimates (Chetty, Hendren, Kline, Saez, et al. 2014). In particular, we find a slightly positive trend in their rank-rank correlation (red dashed line) and a slightly negative trend line for IGE (blue dashed line). However, for the most part, their measures of mobility illustrate a stable pattern over this relatively short period between 2000 and 2012. This stability contrasts to the increasing income inequality trends observed in this period in the United States both for the Gini coefficient (green dashed line) and the top 1 percent income share (orange dashed line). Panel B in Figure 2 illustrates estimates of IGE coefficients from the second half of the 1970s to early 2000s, exhibiting a slight upward trend (blue dashed line), which is evidence of decreasing intergenerational mobility (Lee and Solon 2009). Moreover, income inequality trends increased since the 1980s based on the Gini coefficient (green dashed line) and the top 1 percent income share (orange dashed line). These findings suggest a negative correlation between income inequality and intergenerational mobility.
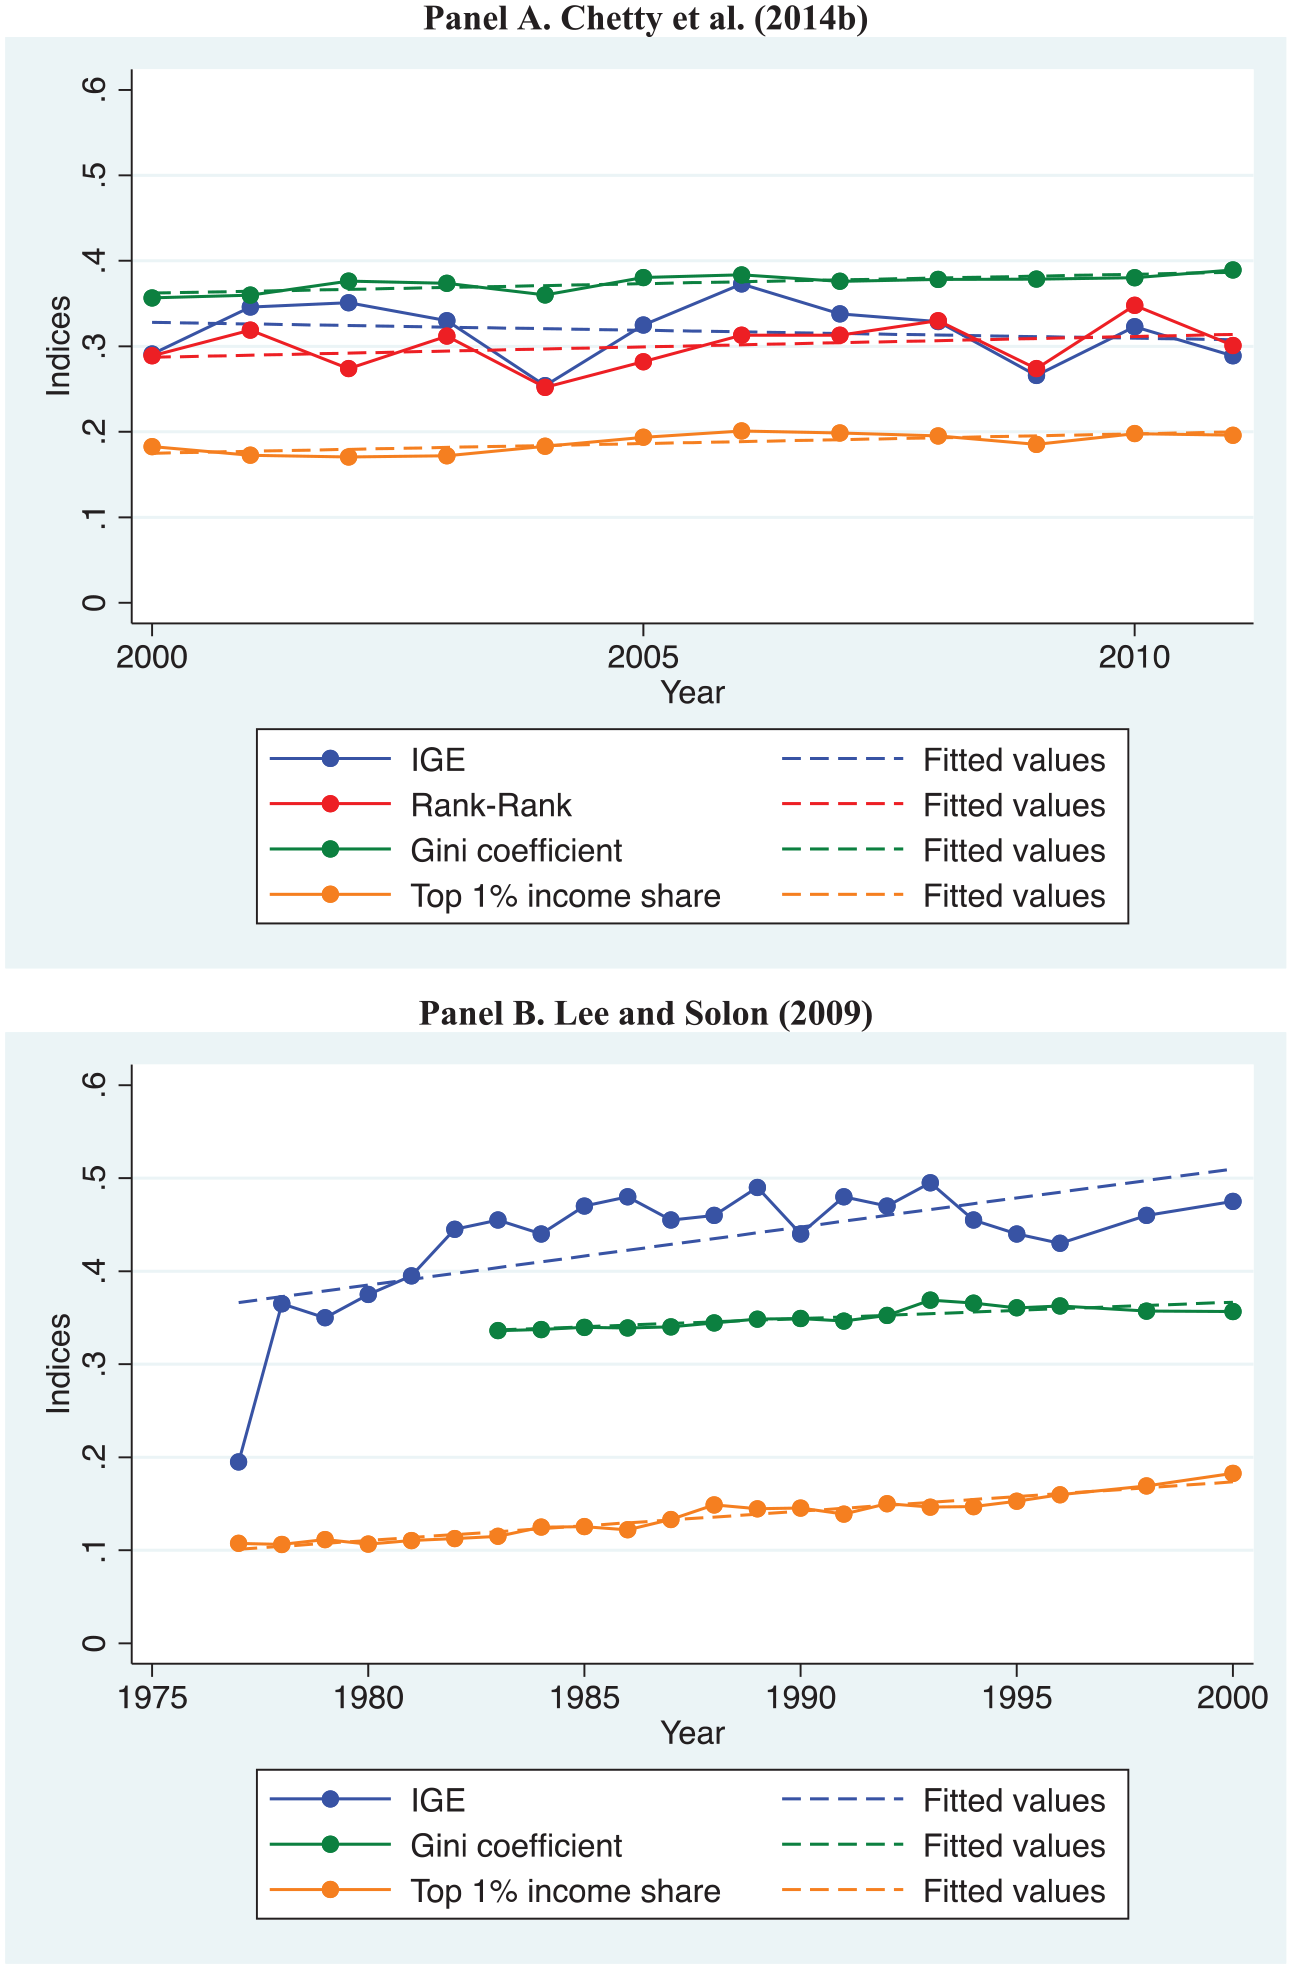
Trends of intergenerational mobility and income inequality by year, United States.
IGE estimates are subject to measurement errors and potential biases in their estimation, depending on the econometric methodology employed by a given study. As a way to deal with this issue and unobserved effects, we need to better understand these correlations through a multivariate approach. In the next section, we illustrate the results of a metaregression analysis about the association of income inequality and intergenerational mobility.
Metaregression Analysis
We conduct a multivariate analysis on the correlation between inequality and mobility by using a series of metaregressions. More specifically, we estimate ordinary least squares regression models where IGE is the dependent variable and the measure of income inequality is the independent variable of interest. We control our models for several variables related to methodological differences across studies, country indicators, and paper fixed effects. Overall, our previous results from graphical analyses are confirmed by regression estimates. However, important specificities arise from our multivariate models, as discussed in the following.
Model 1 in Table 3 is the regression analogue to Panel A in Figure 1: The Gini coefficient (independent variable) is statistically significant when associated with IGE (dependent variable). Higher income inequality is positively correlated with IGE (i.e., negatively correlated with intergenerational mobility). The association is strengthened once we control for variables related to methodological differences across studies (Model 2). More specifically, this association is stronger and remains statistically significant when including controls related to the methodology used by each study—gender of children, gender of parents for which income measures are obtained, number of years for which parental income is measured, children’s age, children’s age squared, parents’ age, parents’ age squared, and type of income of children (individual or family).
Ordinary Least Squares Estimates for Intergenerational Income Elasticity (Dependent Variable) Using the Gini Coefficient.

Note: Standard errors allow for intragroup correlation within papers. Robust standard errors are reported in parentheses.
Source: The Gini coefficient is from the Organisation for Economic Co-operation and Development (OECD), and other variables are from a series of studies listed in Tables 1 and 2.
p < .10. **p < .05. ***p < .01.
When we only control for country of study (instead of methodological variables) and thus eliminate the cross-country variation (relying on within-country variation), the association of the Gini coefficient with IGE drops in magnitude and is not statistically significant (Model 3 in Table 3). The next model includes both the effects of methodological strategies and country of study (Model 4). The association of the Gini coefficient with IGE slightly increases and becomes statistically significant. In this model, only Canada has significantly lower levels of IGE (more intergenerational mobility) compared to the United States. All other countries that had significant coefficients with IGE in comparison to the United States in Model 3 do not hold that difference in Model 4.
As a way to deal with methodological differences and country of study without the variables used in Model 4, we include fixed effects for study paper in Model 5 (Table 3). The association of the Gini coefficient with IGE increases again to the level of Model 1. An interesting aspect of Model 5 is the increase in adjusted R2 to .679 since paper indicators capture a great deal of the variation in the mobility measure. This model allows us to control for unobserved effects that could intervene on the association between inequality and mobility. However, this model does not allow us to verify the associations of each methodological variable and country with IGE.
To allow only within-country and within-study paper variability, we estimate a model including all independent variables that analyzes whether income inequality within a country is correlated with IGE. This analysis is an analogue to the panels in Figure 2. Once we include methodological variables, country fixed effects, and study paper fixed effects (Model 6 in Table 3), the association of the Gini coefficient with IGE is lower than in any other model and is not statistically significant. We highlight that there are only a few studies that look at trends in mobility within countries. Thus, the association of the Gini coefficient with IGE in Model 6 is only estimated for a few observations and is very imprecise. We do not categorically conclude that within-country inequality is uncorrelated with mobility in all cases but rather that we do not observe it in existing studies (which are limited in number).
The second set of models in Table 4 explores the association between the top 1 percent income share and IGE. This exercise is similar to the analysis of Panel B in Figure 1, which indicates a significant correlation between the top 1 percent measure and IGE. As we would expect, this measure of income inequality has a positive bivariate association with IGE in Model 1 (or negative correlation with intergenerational mobility). This association remains at the same level and statistically significant when we control for methodological differences across studies (Model 2). However, when controlling for country indicators, this association loses magnitude and is not statistically significant (Models 3 and 4). When we control for study paper (Models 5 and 6), the association becomes significant again.
Ordinary Least Squares Estimates for intergenerational Income Elasticity (Dependent Variable) Using Top 1 Percent Income Share.

Note: Standard errors allow for intragroup correlation within papers. Robust standard errors are reported in parentheses.
Source: Top income share is from the World Top Incomes Database, and other variables are from a series of studies listed in Tables 1 and 2.
p < .10. **p < .05. ***p < .01.
An interesting finding in Table 4 is that when we control our models for all independent variables (methodological variables, country fixed effects, and study paper fixed effects) in Model 6, the association of the top 1 percent income share with IGE has the highest magnitude compared to all models within this table. This result might be an indication that recent increases in inequality in developed countries, due to a concentration of earnings at the top of distribution (Atkinson et al. 2011; Hout 2012; Jones 2015; Keister 2014; Volscho and Kelly 2012), is negatively affecting intergenerational mobility (Model 6 in Table 3). Since this increase in inequality was not related to changes throughout the entire income distribution, the Gini coefficient did not have a significant association with mobility when controlling for all independent variables (Model 6 in Table 2).
We need to be careful with comparisons between coefficients of income inequality measures because the Gini coefficient and the top 1 percent income share have different units of measurement. To compare the magnitude of associations of these inequality measures with IGE, it is more appropriate to estimate coefficients in standard deviation units. Standardized coefficients of inequality indicators from all models in Tables 3 and 4 clarify the magnitude of these associations (Table 5). Overall, from Models 1 to 5, IGE had stronger associations with the Gini coefficient than with the top 1 percent income share. For example, an increase of one standard deviation in the Gini coefficient is associated with an increase of .61 standard deviations in IGE (Model 1). An increase of one standard deviation in the top 1 percent income share is associated with an increase of .34 standard deviations in IGE (Model 1). These results might be related to the nature of how these indicators are calculated. Our measure of intergenerational mobility (IGE) is based on the entire income distribution. As a result, Models 1 to 5 might be capturing a stronger association of IGE with the Gini coefficient, which is an inequality measure based on all values of the income distribution. On the other hand, the top 1 percent income share is an indicator based on the income of a specific proportion of the population. When we control the association of inequality and mobility for methodological variables, country, and study papers (Model 6), IGE has a stronger association with the top 1 percent income share than with the Gini coefficient. The inclusion of paper fixed effects allows us to control our estimations for unobserved effects not captured by our methodological variables and country indicators. As mentioned before, results from Model 6 are driven by data variation from a few studies since only a small portion of them estimated mobility measures within countries over time.

Source: The Gini coefficient is from the Organisation for Economic Co-operation and Development (OECD), top income share is from the World Top Incomes Database, and other variables are from a series of studies listed in Tables 1 and 2.
p < .10. ***p < .01.
We also estimated models to verify the joint association of the Gini coefficient and the top 1 percent income share with intergenerational mobility (not shown). As expected, results suggest the presence of collinearity between the Gini coefficient and the top 1 percent income share. The variance inflation factor indicates a strong collinearity between these income inequality measures. The issue of collinearity is more pronounced in models with country indicators since the Gini coefficient and the top 1 percent income share are available at the country level. Even though these income inequality measures can vary within a country over time, this was not sufficient to overpass the issue of collinearity.
Overall, these findings suggest the validity of the Great Gatsby curve framework, in which higher income inequality generates lower intergenerational mobility. However, after including all control variables, this negative association only appeared with statistical significance when using the top 1 percent income share (Model 6 in Table 3), not with the Gini coefficient (Model 6 in Table 2). Substantially, income share is a more appropriate measure of inequality to capture recent trends of increasing concentration of income at the top of the distribution. This statement is corroborated by the lack of statistical significance of intergenerational mobility with the Gini coefficient when controlling for all variables (Model 6 in Table 2). This specific finding might be the result of a measuring effect. The Gini coefficient is not an adequate indicator for measuring changes at the extremes of the income distribution, as previously discussed. Since recent increases in income inequality are related to a concentration of income at the top of the distribution, a multivariate analysis indicates that mobility is not correlated with the Gini coefficient. Thus, the stronger magnitude and statistical significance of the association between intergenerational mobility and top 1 percent income share is an indication that mobility is negatively associated with inequality when utilizing this income share measure compared to the inclusion of the Gini coefficient (Model 6 in Table 5).
We understand the limitations of our models both in terms of not being able to control our estimations for a series of relevant variables and for centering the analysis on a limited number of countries. Previous studies estimated intergenerational mobility based on microdata that permitted the inclusion of a series of control variables. Our intention in this study was to aggregate all these mobility estimates, merge with inequality measures, and provide an overview of the association between income inequality and intergenerational mobility. As a strategy to deal with the limited number of variables, we controlled our models for methodological aspects of the papers, unobserved variations at the country level (using country fixed effects), and other variations at the study paper level (using paper fixed effects). In relation to the limited number of countries analyzed, this limitation was the result of other countries not having enough studies to provide variation of mobility measures over time. Moreover, not all studies provided enough information to generate the control variables included in our models. Finally, we dealt with the overrepresentation of studies about the United States by including fixed effects for countries and study papers.
Final Considerations
A central concern in developed countries is that recent increases in income inequality have translated into societies that are less economically mobile. However, there is not much evidence about the trends in intergenerational mobility since this is a difficult concept to measure in a consistent manner. Our analysis suggests that there is a strong cross-country association between income inequality and intergenerational mobility, as reported by previous studies (Corak 2013; Corak et al. 2014; Krueger 2012; OECD 2011, 2015).
Our multivariate analysis (with metaregressions) has similar results to the bivariate analysis (with Great Gatsby curves). However, associations between inequality and mobility are not always statistically significant when controlling for our independent variables. For instance, the correlation of the Gini coefficient with mobility is not statistically significant after the inclusion of all control variables (methodological strategies, country indicators, paper indicators). This result is evidence that associations between inequality and mobility lose magnitude and statistical significance when we include fixed effects for countries and study papers in models using the Gini coefficient as the inequality measure. This finding is consistent with statements that negative correlations between inequality and mobility depend on specificities within countries (Chetty, Hendren, Kline, and Saez, 2014; Chetty, Hendren, Kline, Saez, et al. 2014).
Furthermore, our models using the top 1 percent income share as the inequality measure do find a significant negative correlation between inequality and mobility even after controlling for all independent variables. More specifically, the variable on the top 1 percent income share is statistically significant when all variables related to methodological approaches, country fixed effects, and paper fixed effects are considered in the models. This is an important finding of our study because recent growth in inequality in developed countries is related to the concentration of income at the top of the income distribution (Atkinson et al. 2011; Hout 2012; Jones 2015; Keister 2014; Volscho and Kelly 2012). This trend seems to make intergenerational mobility more negatively associated with an inequality measure related to the top of the distribution (the top 1 percent income share) than with a measure that captures variations throughout the income distribution (the Gini coefficient). Another major aspect of this study is that our models utilized income share at the top of the distribution as one of the measures of income inequality instead of wealth share. Previous analysis suggest that wealth is more concentrated than income (Keister 2014). Thus, we would expect an even stronger association between income inequality and intergenerational mobility if we were able to utilize a wealth measure, an arguably better determinant of social mobility.
Future analysis could evaluate: (1) whether drivers of inequality have different effects on mobility, (2) associations of individual-level indicators of intergenerational mobility with area-level measures of income inequality, and (3) whether public policies may reduce the negative correlation between inequality and mobility. On the first point, researchers could investigate if recent increases in inequality have been partly driven by changes in the return to human capital and not by increasing disparities in the accumulation of human capital. Earlier in the twentieth century, a decrease in inequality might have benefited from an increase in the accumulation of education by large sectors of the population. These two different drivers (return to human capital and educational improvement) could have reduced inequality earlier on, increased inequality recently, and may have had different effects on mobility.
A second possibility of research could combine the original microdata analyzed by the several studies reviewed in our article to estimate individual measures of intergenerational mobility between children and parents. These estimations would be followed by investigations about the association of individual-level indicators of intergenerational mobility with area-level measures of income inequality. This research possibility would require more time and resources to acquire, aggregate, and homogenize data from different countries, years, and sources. However, results of such endeavor would give even stronger empirical evidences about the links between income inequality and intergenerational mobility.
In relation to public policies, studies could be performed to analyze whether government actions may have helped reduce negative effects of income inequality on intergenerational mobility. Antipoverty policies might have contributed to holding back poverty in a time of increased inequality. A wide range of antipoverty policies have been implemented in the United States over the past five decades, which may have helped stave off poverty. These policies include conditional income transfers, such as Temporary Assistance for Needy Families (TANF) and the Earned Income Tax Credit (EITC); quasi-income, such as the Supplemental Nutrition Assistance Program (SNAP), formerly known as food stamps; and direct services provisions, such as Head Start. These policies tend to improve basic life standards of economically struggling households. However, their main goals are not to build wealth profiles or develop human, cultural, and social capital, which are important factors to increase intergenerational mobility.
Since our results suggest that top 1 percent income share seems to matter more in relation to intergenerational mobility, anti-inequality policies would be more appropriate to generate better prospects for children later in life. Future studies should investigate whether specific policies affect intergenerational mobility. Public policies such as unconditional basic income (UBI; Wright 2016), also known as universal basic income, could help break the links between income inequality and intergenerational mobility. The same could be said to other policies that might directly deal with the issue of high concentration of income and wealth at the top of the distribution, such as policies to tax wealth of ultramillionaire households, provision of affordable health care, subsidized prekindergarten, and government-funded child care. These policies would be more related to improvements of human, cultural, and social capitals, which could have greater effects on decreasing inequality and consequently improving intergenerational mobility. More randomized controlled trials, experiments, and other studies are necessary to improve our knowledge about which policies would provide greater significant effects on mobility. All policies that affect inequality will not have the same impact on mobility. Some effects may directly reduce income inequality but only indirectly benefit their children. Other policies (i.e., policies on children and education) may have a direct impact on mobility, but their effects on contemporaneous inequality may be small or null. Analyses to investigate these aspects would be crucial for dealing with this important socioeconomic issue.
Footnotes
Acknowledgements
We acknowledge the important contributions to this study provided by Dr. Francisco Perez-Arce from the University of Southern California. Our research approach was envisioned by Dr. Perez-Arce while coordinating the project, “Inequality and Opportunity: The Relationship between Income Inequality and Intergenerational Transmission of Income,” at the RAND Corporation (![]() ). Although he is not a co-author in the current article, we maintained communication with him to improve the models estimated in our study.
). Although he is not a co-author in the current article, we maintained communication with him to improve the models estimated in our study.
Funding
The authors disclosed receipt of the following financial support for the research, authorship, and/or publication of this article: The open access publishing fees for this article have been covered by the Texas A&M University Open Access to Knowledge Fund (OAKFund), supported by the University Libraries and the Office of the Vice President for Research.