
Abstract
This study extends social-psychological research on social networks and mental health by examining cross-gender differences in social integration and depression among United Methodist clergy in North Carolina. Using data from the fifth wave of the Clergy Health Initiative panel survey, we used cross-group models to examine the association of depressive symptoms and network in-degree, out-degree, and perceived social isolation among men (N = 1,145) and women (N = 535) clergy. The analysis reveals gendered differences in this association. Specifically, out-degree bore a significant negative relationship with depressive symptoms for men but not women. Feeling socially isolated had a significant positive association with depression in both men and women.
Introduction
Using data from the fifth wave (2016) of the Duke Clergy Health Initiative Longitudinal Survey, a panel survey of North Carolina United Methodist Church clergy, this study examines the association between depression and social network characteristics using reciprocal social network data gathered from an occupational network of clergy. Specifically, we assess if degree centrality and feelings of social isolation have a similar association with depression for men and women clergy. Examining this topic is important for two reasons. First, a great deal of attention has been focused on the relationship between feelings of isolation and mental health outcomes (Cacioppo, Hawkley, and Thisted 2010; Courtin and Knapp 2017), yet relatively little is known about the relationship between social networks and mental health outcomes. This article speaks to this gap by exploring the relationship between social support (using both social network measures and feelings of social isolation) and depression.
Second, the relationships between gender, social network characteristics, and depressive symptoms are still poorly understood. With women being almost twice as likely to be diagnosed with depression (Brody, Pratt, and Hughes 2018), research on the correlates of gendered differences in mental health outcomes is essential. Few studies take seriously the problem that depressive symptoms and social support are shaped by gender differently for men and women (Brownhill et al. 2005; Girgus et al. 2017; Girgus and Yang 2015; Kessler and McLeod 1984; Piccinelli and Wilkinson 2000; Schuch et al. 2014). Not only are women more likely to be diagnosed as depressed (Girgus and Yang 2015; Piccinelli and Wilkinson 2000), but men and women express depression differently (Brownhill et al. 2005). Women are more likely to endorse traditional measures of depressive symptoms, such as crying and emotionality, while men are more likely to express depression with risk-taking behaviors and self-harm (Brownhill et al. 2005; Simon and Nath 2004). Kessler and McLeod (1984) also argued that women express higher levels of depressive symptoms because women are exposed to more undesirable events that occur to important people in their social network rather than to themselves. Because they are more likely to be in caregiving roles, women are exposed to more of these network events.
Importantly, women and men clergy experience a similar depression prevalence. In a 2006 study of United Method-ist clergy, telephone interviews using the Patient Health Questionnaire (PHQ-9) with a cutoff score of 10 found a depression prevalence for 40- to 60-year-olds of 8.8 percent in men clergy and 8.2 percent in women clergy versus the NHANES survey (also a telephone survey using the PHQ-9) that found 40- to 60-year-old men had a depression prevalence of 4.4 percent versus 6.6 percent for women (Proeschold-Bell et al. 2013). Because of the similarities in depression prevalence between men and women clergy, it is likely that the factors generating elevated rates of depressive symptoms are more similar in men and women clergy than in men and women generally.
Social Networks and Depressive Symptoms
Recently, there has been a growing body of literature on social support and depression (Alpass and Neville 2003; Cacioppo et al. 2010; Courtin and Knapp 2017; Coyle and Dugan 2012; Kawachi and Berkman 2001; Liu, Gou, and Zuo 2016; Rosenquist, Fowler, and Christakis 2011; Stephens et al. 2011; Teo, Choi, and Valenstein 2013). In general, increased levels of social support are correlated with a decrease in depressive symptoms (Cacioppo et al. 2010; Liu et al. 2016; Rosenquist et al. 2011), and social isolation is highly correlated with depression (Eagle, Hybels, and Proeschold-Bell 2019).
With some exceptions (Bearman and Moody 2004; Falci and McNeely 2009; Rosenquist et al. 2011; Ueno 2005), the majority of the social support literature focuses on the relationship between feelings of social isolation and adverse mental health outcomes. The limited work on social networks and negative mental health outcomes often emphasizes how individuals who are underintegrated and/or have no/relatively few social network ties are at greater risk of having depression than those who are socially integrated (Rosenquist et al. 2011; Ueno 2005). However, this relationship between network support and depression is not straightforward, as described by Schaefer, Kornienko, and Fox (2011). Examining the nuanced relationship between depression and friendship selection, Schaefer et al. (2011) argued that depression shapes social network characteristics. Schaefer et al. (2011) found depression homophily through a withdrawal process in which depressed adolescents pull out of friendship networks and form relationships with other adolescents in similar marginalized network positions. It is not clear if this finding also holds among adults.
Prior research also posits that network position is important for negative mental health outcomes. For instance, in their study of suicide, Bearman and Moody (2004) found an individual’s structural position within his or her social network influences suicidal ideation. In particular, transitivity (i.e., whether one’s friends are also friends with one another) and centrality were predictive of suicidal ideation (Bearman and Moody 2004). The current research study adds to this body of literature by using social network methods to assess the relationship between social networks (the degree to which one is connected within one’s social network), feelings of social isolation, and depressive symptoms among working adults.
Gendered Networks and Depressive Symptoms
Studies on gender and depression add further nuance to our understanding of the relationship between social support and depression because previous work highlights gendered differences in both depressive symptoms (Girgus and Yang 2015; Schuch et al. 2014; Twenge and Nolen-Hoeksema 2002) and social network characteristics (McPherson, Smith-Lovin, and Cook 2001). Studies find higher rates of depression in women (Girgus and Yang 2015; Schuch et al. 2014; Twenge and Nolen-Hoeksema 2002). This may be in part due to the existing gender hierarchy, the constraint of gender norms, and the social roles that women play as wives and mothers (Piccinelli and Wilkinson 2000). However, some scholars argue that both men and women experience depression at equal rates but that men and women express depression symptoms differently (Brownhill et al. 2005). Screenings for depression often align with gender-appropriate responses for women, things such as sadness and emotionality, whereas men express depression in ways such as anger, risk-taking, self-harm, and in some instances even crime (Brownhill et al. 2005). These types of depressive behaviors expressed by men are not often detected using traditional depression indicators.
Importantly, while women typically receive more support than men do, women still tend to have higher rates of depression. One explanation for this paradox is that while women receive more support, they also have to give more support because of their more extensive integrated networks (Kessler and McLeod 1984). For example, Kawachi and Berkman (2001) argued that women have more support but also have higher depression because they are obliged to provide support to others in their networks. Further, women are more distressed than men when they are unable to provide support to those who are suffering within their networks (Kawachi and Berkman 2001). Similarly, in their analysis of adolescent boys and girls, Falci and McNeely (2009) found that both large and small networks led to higher levels of depression. The latter may be true because of the time and energy obligations of having too many friends outweigh the benefit of having those friends (Falci and McNeely 2009). They also found significant gendered differences between social network characteristics and depression. For girls, when networks were fragmented, overintegration was associated with depression (Falci and McNeely 2009). However, for boys, when networks were cohesive, overintegration was associated with depression. Additionally, research explores the influence of gender on the spread of depression in social networks. For instance, examining the person-to-person spread of depression across a social network, Rosenquist et al. (2011) found that gender was a significant determinate of this spread, with women influencing the spread of depression more than men.
Further, organizational literature suggests gender plays an important role in the formation of social networks in the workplace. That is, workplace networks tend to be homophilous by gender (Ibarra 1997). The principle of homophily suggests that women’s networks tend to be comprised of other women and men’s networks comprised of other men (McPherson et al. 2001). This is particularly apparent in workplaces where men dominate positions of power; in these situations, women rely on networks to cope with the particular challenges they face (Ibarra 1997). Workplace networks are crucial for several outcomes, including stress reduction (Fuhrer et al. 1999). For example, Fuhrer et al. (1999) found that among an occupational cohort of British civil servants, workplace networks played a key role in reducing psychological distress.
Social Networks and Depression among Clergy
As a male-dominated workplace, a study of United Methodist clergy provides a unique occupational subpopulation to examine because of the structure of the workplace and because of the muted differences in the rates of depression among men and women clergy. United Methodist clergy networks are not typical workplace networks. Because most clergy are not physically located in the same place, church clergy do not inhabit a traditional occupational setting. However, as evidenced by our data, despite the lack of face-to-face interaction, United Methodist clergy still rely on each other for social support.
Further, as a male-dominated occupation (Reedy-Strother 2011; Sullins 2000), clergy provide an interesting case for analysis. Participation in religious leadership roles remains low for women within the United Methodist church (adams 2007; Sullins 2000). Although the United Methodist church assigns placements of their clergy, women typically hold positions that are lower in the leadership structure (Reedy-Strother 2011). Women clergy confront challenges that are unique to their profession and may feel vulnerable within this male-dominated occupational space (LeGrand et al. 2013).
Additionally, men clergy participants report higher rates of depression than the general population (Proeschold-Bell et al. 2013), likely because of the significant emotional labor required in their work. Given the muted differences in depression rates among men and women clergy, a sample of clergy provides a unique subpopulation to test previous theorizing on gender and social networks. This article explores whether social networks will operate similarly for both men and women clergy given their similar rates of depression. Given the previous work on gender, social networks, and depression, we propose the following hypothesis:
Hypothesis 1: There will be a significant difference in the effects of social network characteristics on men’s depression and women’s depression.
Data and Methods
Data Collection and Sample
Our analysis uses data from the Clergy Health Initiative Longitudinal Survey. The first wave of the survey was conducted in 2008 and included all active United Methodist Clergy in North Carolina. The survey was repeated in 2010, 2012, 2014, and 2016 with all previous respondents plus any new clergy in the state. This study used data from the 2016 wave, which collected 1,802 responses with a response rate of 72.7 percent.
1
After removing missing cases, bad responses, and retired clergy, our final sample included 1,680 clergy participants. This sample included 1,145 men clergy (68 percent) and 535 women clergy (32 percent). The survey took 60 to 75 minutes to complete and included a broad range of items on mental and physical health. Using an online name generator, the 2016 survey asked participants to: Please list the first and last name of current or former United Methodist clergy in North Carolina whom you turn to for support. We are asking you to provide specific names. Through linking our study data with other UMC conference members’ data, we hope to understand how people support each other and the characteristics of people closely associated with each other.
Participants could list an unlimited number of names.
Using the name generator, 3,577 total (nonunique) names were listed by clergy participants; 3,017 (85 percent) of those names were matched with current or former United Methodist clergy within our data set. Based on these data, we were able to create an occupational network of United Methodist clergy in North Carolina.
Dependent Variable
The main dependent variable for our analysis is the number of elevated depressive symptoms. We measure depressive symptoms using the Patient Health Questionnaire. Nine items, which measured the frequency of depressive symptoms in the past two weeks, were included in the scale and were scored 0 (not at all) to 3 (nearly every day). Based on responses to these questions, clergy participants received a score that ranged from 0 to 27, with higher numbers indicating more severe depressive symptoms.
Independent Variables
In our analysis, we focus on both social support through social networks (measured through social network ties) and the respondent’s feelings of social isolation. We include two social network measures, out-degree and in-degree. Out-degree, the number of clergy nominated by the respondent, ranges from 0 to 27. In-degree, the number of clergy that nominated a respondent, ranges from 0 to 9. Feelings of social isolation are measured with a single measure, “How socially isolated do you feel?” Those who responded not at all were coded 0; those who responded slightly to extremely were coded as 1.
Control Variables
We also include several control variables in our analysis that may be related to both depressive symptoms and network measures—age, race, education, marital status, and rurality. We measure age as a continuous variable, marital status as a dichotomous variable (0 = not married 1 = married), education as a categorical variable (associate’s degree or lower was the reference, with categories for bachelor’s, master’s, and doctoral degree), race as a dichotomous variable (0 = nonwhite 1 = white), and rurality as a dichotomous variable (0 = not rural, 1 = rural).
Data Analysis
We estimate cross-group models by gender to assess whether social support had a different association with depressive symptoms for men (n = 1,145) and women (n = 535). After calculating social network measures using UCINET software (Borgatti, Everett, and Freeman 1992), we use these measures in negative binomial regression analyses to predict depressive symptoms. Negative binomial regression was appropriate for the structure of our dependent variable, an overdispersed count variable. Using seemingly unrelated estimation, we use stacked models to test for statistically significant differences in model coefficients between men and women (Karlson, Holm, and Breen 2012; Zellner 1962). This test was done in Stata using the suest command.
Results
In Table 1, we report descriptive statistics. Among this group of clergy, the average PHQ score for men is 3.78, and the average PHQ score for women is 4.39. In terms of social network measures, in-degree was similar for men (1.49) and women (1.85). Out-degree was lower among men (1.34) than women (2.21). Men and women clergy reported feeling not at all socially isolated at similar rates (86.1 percent for women and 88.7 percent for men).
Summary Statistics for Men and Women Clergy.

In terms of demographic variables, men and women clergy had similar average ages and ethnic makeup. Women were more likely to have a master’s degree (74.4 percent for women vs. 64.9 percent for men), much more likely to be unmarried (26.7 percent for women and 7.3 percent for men), and more likely to be in an urban versus rural congregation (53.5 percent for women vs. 46.6 percent for men).
In Table 2, we present three models. Model 1 is a reduced model that includes feelings of social isolation and all control variables, and Model 2 is a reduced model that includes the social network measures and all control variables. Model 3 is the full model, which includes the measure for feelings of social isolation and the social network measures. We ran all models separate for men and women. 2
Negative Binomial Regression Predicting Personal Health Questionnaire Score among Clergy.
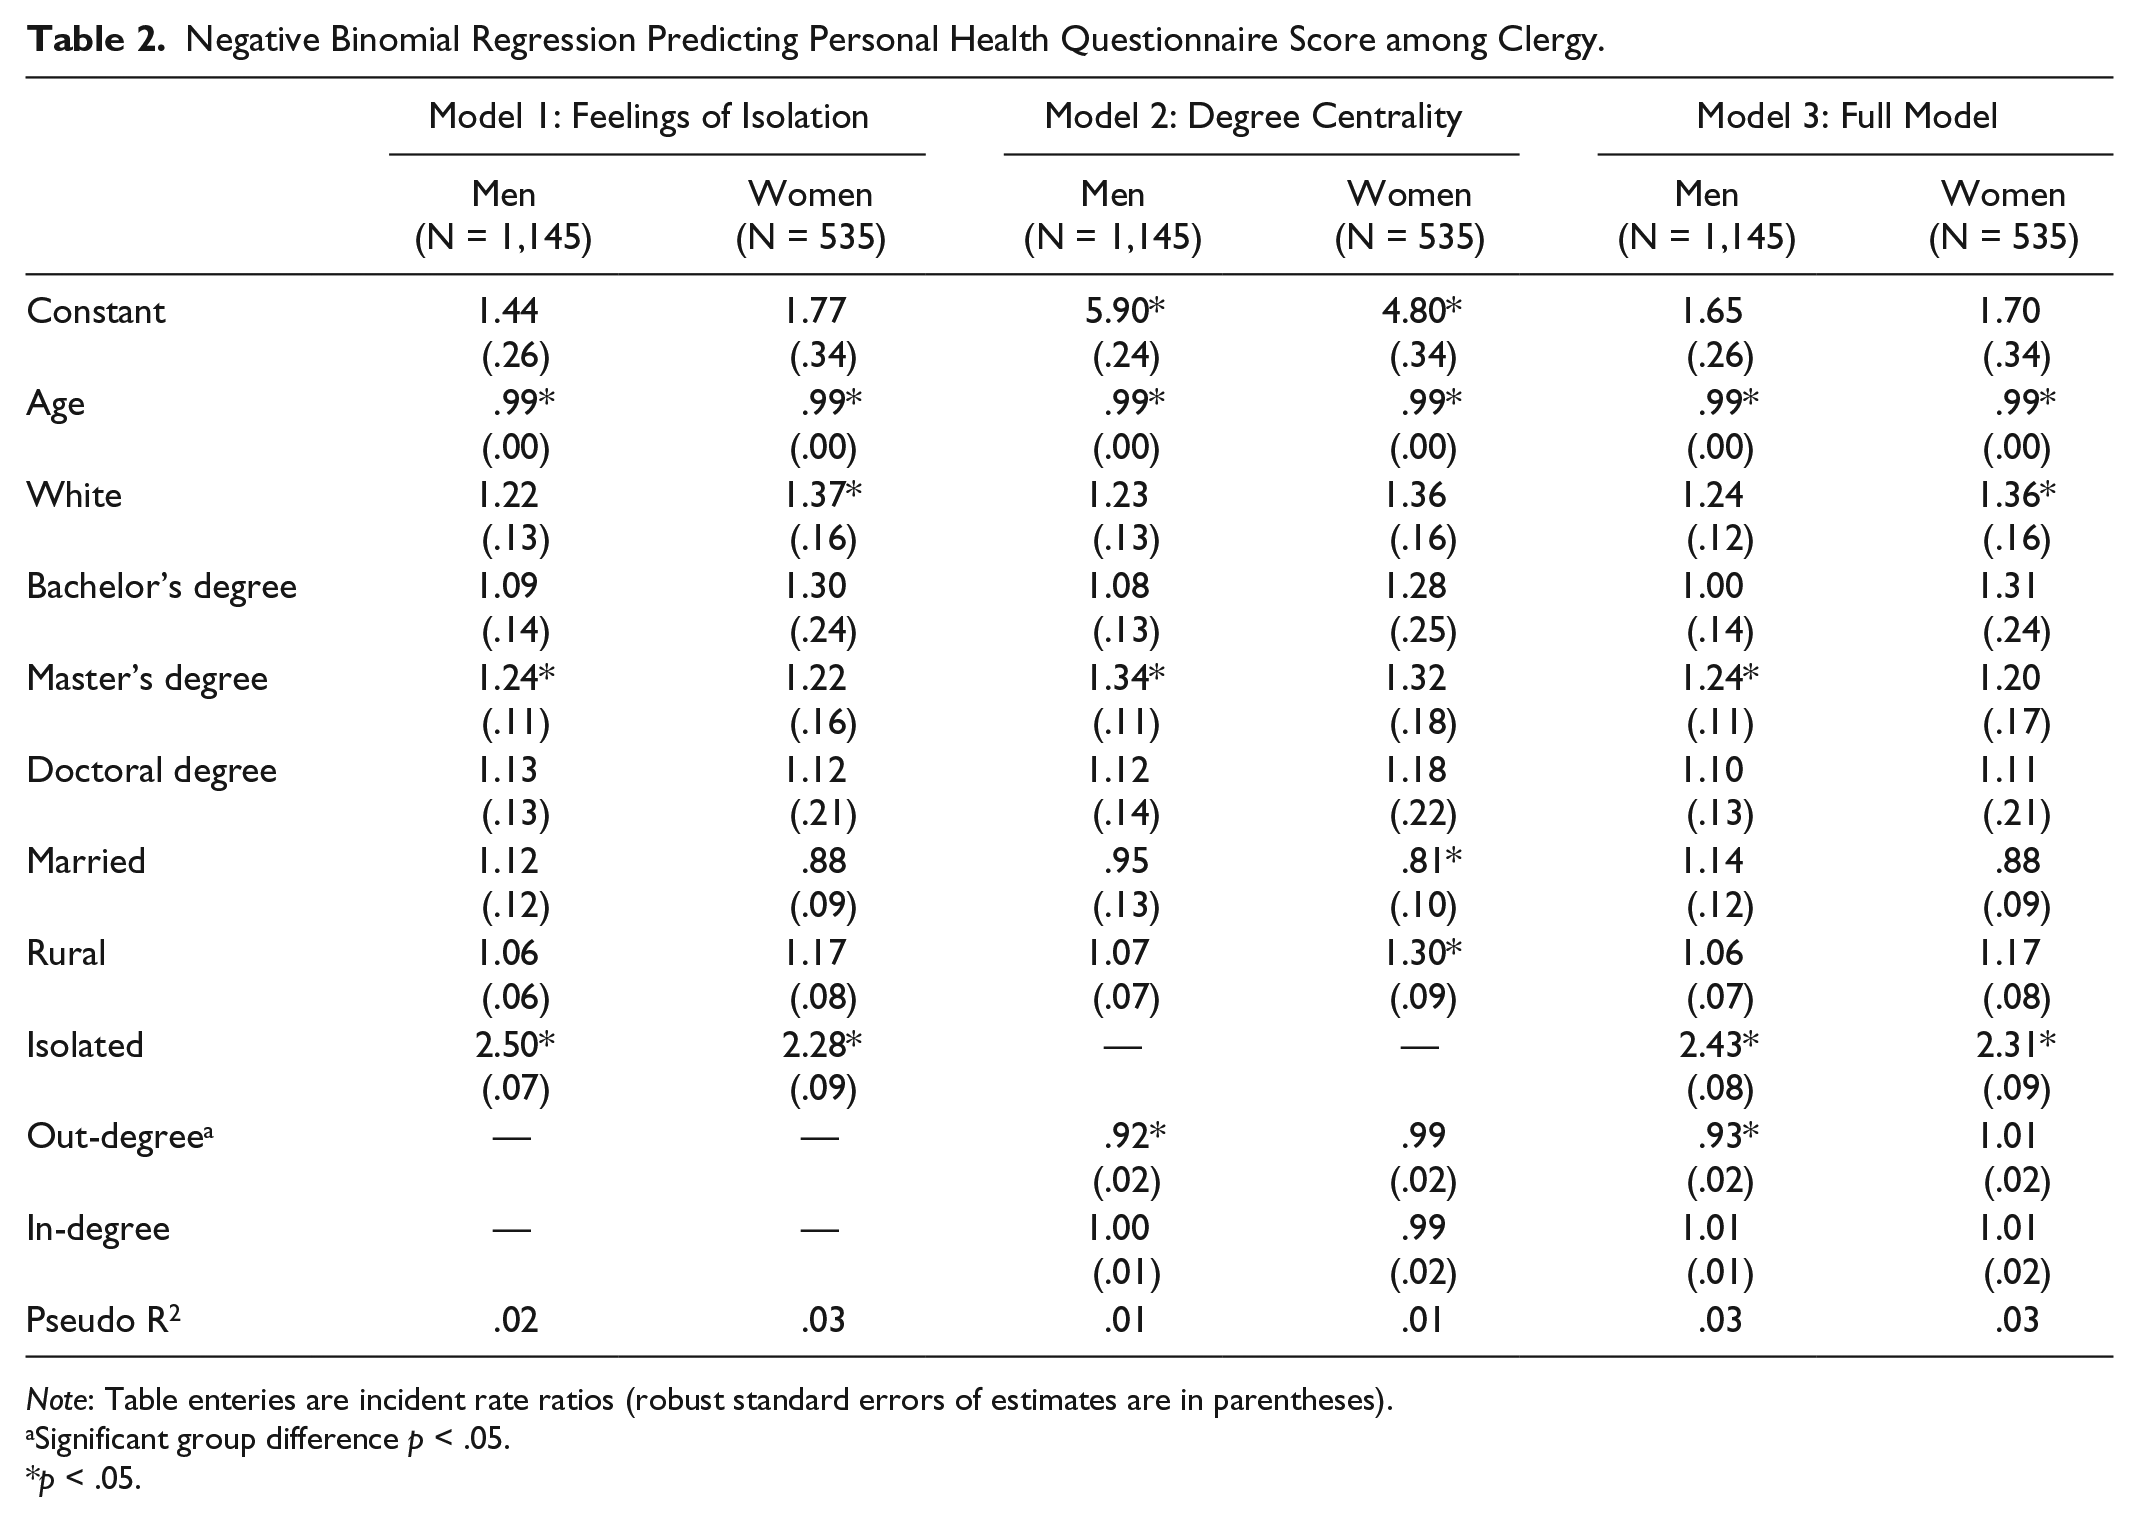
Note: Table enteries are incident rate ratios (robust standard errors of estimates are in parentheses).
Significant group difference p < .05.
p < .05.
Unlike their women counterparts, among men clergy, social network variables are related to fewer depressive symptoms. In terms of degree centrality, out-degree is associated with lower depressive symptoms among men but not women. In-degree was nonsignificant for either men or women. Feeling socially isolated had a positive relationship with depression. In terms of the control variables, among men and women clergy, we found that age bore a negative relationship with depressive symptoms.
Figure 1 displays the network graph of men and women clergy. Blue nodes represent men clergy, and pink nodes represent women clergy. The sizes of the nodes are scaled according to PHQ-9 scores. Smaller nodes represent a lower PHQ-9 score, and larger nodes represent a higher PHQ-9 score. Importantly, the network graphs also show that there are several central nodes that despite their centrality also have high depressive symptoms.

Network of men and women clergy by depression.
Cross-Group Comparison
An assessment of the equality of coefficients across models for men and women revealed several differences in how social network variables relate to depressive symptoms. Confirming Hypothesis 1, the social network variables had different associations across models for men and women clergy. Specifically, we found cross-group differences for out-degree. Out-degree was related to lower depressive symptoms in men clergy but not in women clergy.
Discussion and Conclusions
In this study, we sought to investigate if measures of social connectedness had different associations with depressive symptoms in women and men clergy. The focus of this article is on how the correlates of depression, especially those dealing with social networks, differ between men and women. Previous research on gender and depression suggests women are more likely than men to be diagnosed with psychological distress and depressive disorders (Girgus and Yang 2015). However, among clergy, men and women exhibit similar levels of depressive symptoms (although average symptoms are higher for women).
Given the unique sample of analysis, we found that social network characteristics had different associations with depressive symptoms in men and women. As this analysis revealed, measures of the extent of clergy social networks had different associations with depressive symptoms for men and women. Importantly, our analysis showed that for men, the social network measure—out-degree—was associated with fewer depressive symptoms. For men, the more clergy they reported as connections in their social networks, the less likely they were to be depressed. However, we found that for women clergy, the social network measures did not have a significant association with depressive symptoms.
There are several possible explanations for this pattern. It is possible that women may have had larger networks outside of United Methodist clergy circles and women with larger nonclergy social networks may have exhibited lower depressive symptoms. It is also possible that as a part of a male-dominated workplace, women may feel, overall, more guarded about sharing their vulnerabilities with men, who might have positions of authority over them, or with other women, with whom they might be in competition for a relatively few number of positions. Finally, it may be possible that due to masculine norms, men withdrew from support-seeking behaviors when they were struggling with depressive symptoms, whereas women, on the other hand, may continue to have sought support.
This finding may also speak to the curvilinear relationship between social support and depression. Among our clergy participants, women clergy had, on average, larger networks. Again, having too many social ties can be detrimental to one’s mental health because of the time and energy obligations of having too many friends outweigh the benefit of the friends (Falci and McNeely 2009). Therefore, women clergy may have given too much of themselves to reap the benefits of these social relationships. Additionally, organizational studies on emotions reveal that women perform more emotional labor in the workplace than men do (Hochschild 2012; Pierce 1999). So, women clergy may be providing too much support to others, such that their own ties are no longer beneficial.
These results may also provide insights into how social support operates within a male-dominated workplace. The fact that leadership roles in the United Methodist church are male-dominated (adams 2007; Reedy-Strother 2011; Sullins 2000) presents unique challenges for women. An environment where men hold the majority of powerful, decision-making positions may push women together in solidarity; but solidarity might not create openness as women may not feel as free to speak openly about emotional struggles in fear of appearing weak among other women colleagues, with whom they are competing for relatively fewer opportunities. This is supported by evidence from the analysis of a focus group of women pastors where it was revealed that women pastors were hesitant to share their struggles with other women clergy because they did not want to appear vulnerable within their male-dominated occupation (LeGrand et al. 2013). In this study, one woman clergy participant stated, “I think we’re concerned about being judged by another clergy person and our image changes to them. Or, if I reveal something that someone is going to think differently of me, if I’m honest about something” (LeGrand et al. 2013: 310). This suggests that even when women have large social networks, they may not be using them in ways that could reduce depressive symptoms. Additionally, as they occupy a nontraditional role, women clergy may put a lot of pressure on themselves to be the exemplar, and so this may prevent them from receiving the support offered. However, it is also important to consider that pastoral work occurs in a nontraditional workplace. That is, pastors that connect with one another do not necessarily see each other every day within the walls of their church. Unlike other occupations where coworkers may see each other several times a week, pastors are unlikely to see other clergy face-to-face during their workday.
Previous research also speaks to the importance of perceptions of social support in reducing depressive symptoms (Cacioppo and Cacioppo 2014). We found this to be true among our clergy participants. Among both men and women clergy, feelings of isolation increased depressive symptoms (Eagle et al. 2019). However, our analysis revealed a salient finding regarding structural social network support and feelings of social isolation. For men, both actual support through social networks and feelings of social isolation were associated with reduced depressive symptoms. However, for women, feeling socially isolated was related to fewer depressive symptoms.
Limitations
This research is not without limitations. First, our analysis relied on cross-sectional rather than longitudinal data. This limited our ability to make causal arguments regarding our findings. Cross-sectional data also limit our ability to disentangle the complex relationship between social networks and depression. As previously discussed, social networks not only shaped depression, but depression also shapes characteristics of social networks and friendship selection (Schaefer et al. 2011). Therefore, without longitudinal data, we cannot identify causal relationship between social networks and depression.
Further, our analysis focused on one specific occupational group within one state. This situation could be different in other locations and denominations, especially those where there is less gender imbalance and women are more heavily represented in senior-level positions.
The limitations of the present study speak to the areas of future research in this field of inquiry. First, future research should consider using longitudinal data to further explore the complex relationship between social networks and depression and should also capture the changes that occur in networks over time given that networks tend to be dynamic. Since clergy tend to relocate for their jobs quite often (Eagle, Miles, and Proeschold-Bell 2017), there is reason to believe that their networks may also shift and change frequently (Marin and Hampton 2019). If pastors are relocating frequently, they may not be able to create meaningful relationships with clergy that are geographically close. However, since pastoral work happens in a nontraditional setting, where clergy do not see each other every day, clergy’s networks may be less susceptible to the frequent geographic changes that Methodist clergy make.
Despite these limitations, this analysis answers important questions about the association between social connectedness and depressive symptoms for women and men clergy. Recall, in these data, we found gender differences in the association between social network characteristics and depressive symptoms. Higher depressive symptoms in men were associated with fewer outgoing ties in their social network, but the same was not true for women. Similarly, lower reachability in the network corresponded with higher depressive symptoms in men but not women. These findings have important implications for understanding the emotional support role of women within a male-dominated workplace.
Supplemental Material
SRD873821_SM – Supplemental material for Social Networks, Support, and Depressive Symptoms: Gender Differences among Clergy
Supplemental material, SRD873821_SM for Social Networks, Support, and Depressive Symptoms: Gender Differences among Clergy by Jennifer Lutz and David E. Eagle in Socius
Footnotes
Acknowledgements
We would like to thank Celia Hybels, Glen Milstein, Rae Jean Proeschold-Bell, and Jia Yao for their helpful comments and feedback.
Funding
The author(s) disclosed receipt of the following financial support for the research, authorship, and/or publication of this article: This project was funded by a grant for the Rural Church Area of The Duke Endowment.
Supplemental Material
Supplemental material for this article is available online.
1
The social networks question was first asked in the 2016 wave. The structure of the question allowed participants to nominate any clergy that they use for support. To keep as much data as possible, we include in our analysis any clergy who were nominated and participated at any wave of the survey rather than limiting our sample to only 2016 respondents. This could bias the number of clergy with zero outgoing ties given that those who did not take the 2016 survey would have no outgoing ties.
2
Author Biographies
References
Supplementary Material
Please find the following supplemental material available below.
For Open Access articles published under a Creative Commons License, all supplemental material carries the same license as the article it is associated with.
For non-Open Access articles published, all supplemental material carries a non-exclusive license, and permission requests for re-use of supplemental material or any part of supplemental material shall be sent directly to the copyright owner as specified in the copyright notice associated with the article.