
Abstract
Integrating ideas about intersectionality with life course theories, we explore how trajectories of gender earnings inequality vary across race and education. Past research suggests that gender earnings gaps by race and education are narrower for more disadvantaged groups, yet it remains unknown whether these key differences amplify, decline, or remain constant over the life course. Using data from the National Longitudinal Survey of Youth 1979, we estimate growth curve models of annual earnings, examining differences between blacks and whites and by educational attainment in the levels and slopes of men and women’s earnings from ages 22 to 47. Findings show that holding multiple forms of gendered, racial, and/or educational advantage has an interactive effect that accumulates across life. Accordingly, the gender gap expands most with age for whites and the college-educated, where the male premium is compounded by racial and/or educational advantages.
Research on labor market inequality has revealed that disparities by gender, race, and education grow with age (e.g., Goldin 2014; Tharenou 2013; Thomas, Herring, and Horton 1994), but less is known about how these forms of status interact to produce inequalities across life. Scholars of intersectionality argue that social statuses are “interlocking,” not additive, systems of inequality—individuals experience unique combinations of (dis)advantage based on various dimensions of status (Browne and Misra 2003; Collins 2002; Crenshaw 1989). Past research suggests gender earnings gaps by race and education are narrower for more disadvantaged groups (Autor 2014; Greenman and Xie 2008; Mandel and Semyonov 2016), yet it remains unknown whether differences amplify, decline, or remain constant over the life course.
We advance scholarship on gender inequality by documenting how lifetime trajectories of gender earnings inequality vary across race (black and white) and education groups (high school [HS] or less, some college, college or more). Using data from the National Longitudinal Survey of Youth 1979 (NLSY79), we estimate growth curves of earnings trajectories for a cohort of men and women, examining differences in levels and rates of earnings growth by gender, race, education, and the intersections therein. Using this single cohort enables tracing earnings patterns by age, with limited influence from variation across cohorts or historic periods. The NLSY79 cohort entered the labor market when there were dramatic increases in employment of married women with young children, and the majority of the women from this cohort also expected to remain employed throughout adulthood (Goldin 2006). Thus, we situate our examination of intersectional differences in earnings trajectories within this late baby boomer cohort’s experiences.
Our study has two key contributions. First, we conceptualize gender inequality as a product of life course processes that evolve over time rather than a product of a static difference, broadening our analysis of inequality beyond standard cross-sectional estimates. Second, our intersectional approach to gender inequality complements the cumulative (dis)advantage literature. Integrating ideas about intersectional characteristics with life course theories, we uncover whether multiple inequalities are exacerbated or undone with age. We provide empirical support for the notion that gender, race, and education intersectionally shape earnings trajectories over the life course. Our findings are aligned with past research using historical and cross-sectional data, showing that the gender gap is largest for more advantaged educational and racial groups (Autor 2014; Greenman and Xie 2008; Mandel and Semyonov 2016). However, our results suggest that conclusions about a growing gender gap across the life course drawn from highly advantaged samples are not universal (Bertrand, Goldin, and Katz 2010; Gorman and Kmec 2009; Noonan, Corcoran, and Courant 2005). Gender interacts with educational and racial advantage with age, leading to a comparably muted divergence for less advantaged groups.
Annual Earnings as a Measure of Gender Inequality
Departing from past literature that primarily studies hourly wage earned by full-time, year-round workers (e.g., Blau and Kahn 2017), we examine annual earnings across the entire working-age population (including those reporting zero earnings) because our interest is in gender inequality’s overall magnitude across the life course. Research using hourly wages aims to eliminate disparities driven by gender differences in employment rates, often to identify discrimination effects (Blau and Kahn 2017). Yet, broader contexts influencing hourly wages or separating them from total take-home pay, such as union membership or bonuses, often differ systematically by gender, suggesting hourly wages is a less unbiased measure than some argue (Lips 2013).
Another reason given for using hourly wages rather than overall earnings is that hours worked and employment itself are considered a choice (Goldin 2014; Noonan et al. 2005). Yet hours and employment are often less of a choice than many assume (Cha 2010; Damaske 2011; Stone 2007). Analyses including only men and women who work, especially if they include only full-time, year-round workers, risk understating inequality and its development across the working-aged years, given gender’s link to employment patterns over the life cycle. Often, transitions in and out of full-time employment are intimately tied to gender-specific processes, some of which may vary by race and/or education, directly contributing to the intersectional gender gap and its change with age (Florian 2018b; Hewlett 2007; Lu, Wang, and Han 2017). We thus aim to document the full gender earnings gap across the life course, not the gap conditional on various characteristics that are often controlled when modeling the wage gap, such as hours worked or accumulated work experience, which are themselves influenced by gender and gendered processes (Lips 2013). We argue that this approach provides a more complete view of gender differences in individual financial standing.
A Life Course Approach to Gender Inequality
Prior research on gender inequality often adopts a “static” approach (Cheng 2016), estimating point-in-time gender differences. These measures average across the entire working-aged years, including across family- and work-related transitions, which can push men’s and women’s earnings together or apart (Cotter, England, and Hermsen 2007; Gorman and Kmec 2009; Lu et al. 2017). A life course perspective emphasizes a dynamic approach accounting for how these factors shape gendered patterns and shifting the focus from a single estimate of gender inequality to how that inequality’s magnitude evolves with age.
Life course scholars have investigated cumulative (dis)advantage as a mechanism for growing intra-cohort inequality. Those with an initial advantage not only maintain their advantage but also accrue more benefits over time, compounding their advantage (DiPrete and Eirich 2006). Regarding gender, the pay gap may be present at labor market entry but widens as men’s advantage accumulates across life (Tharenou 2013). One explanation for such a pattern is that masculinity is a valued work characteristic (Hodges and Budig 2010; Kanter 1977) that benefits men from the start of their careers. The values associated with masculinity translate into the “male competitive model” (Hewlett 2007) that is dominant in the workplace, valuing high levels of work devotion, lock-step approaches to careers, and full-time employment with an emphasis on face time. It also assumes rapid career growth during workers’ thirties. Men make efforts to uphold this ideal, reinforcing masculine norms in the workplace (Thébaud and Pedulla 2016).
Exacerbating disparities arising from masculinity’s advantages, crucial family transitions, such as getting married or becoming a parent, differentially shape men and women’s employment (Damaske and Frech 2016; Sanchez and Thomson 1997) and returns from the labor market (Cheng 2016; Hodges and Budig 2010; Killewald 2013). Family transitions benefit men as they fulfill their breadwinner expectations (Hodges and Budig 2010; Killewald 2013). Women instead encounter more setbacks, experiencing or being perceived to experience more work-family conflict, especially if they have children (Blair-Loy 2003; Hewlett 2007; Stone 2007). Because pathways veering from the model are less rewarded in the labor market, either through lower returns per hour worked, fewer opportunities for advancement, or fewer opportunities to work more hours (Correll, Benard, and Paik 2007; Gorman and Kmec 2009), men’s labor market advantage likely grows across life.
Intersecting Dimensions of Inequality: Differences by Subgroups
Glass ceilings occur when inequalities are exacerbated among the most advantaged, result from differential advancement rates, and grow across the duration of a career (Cotter et al. 2001). This predicts more pronounced gender earnings divergences among more advantaged education and race groups. Because masculinity is an advantage that may intersect with other social advantages to shape labor market inequality (McCall 2005), those in both advantaged race and education groups (i.e., college-educated, whites) may have the greatest divergence by gender. For groups with fewer forms of advantage (black men, low-education whites), male privilege may be less accentuated. Less advantaged men may begin with and retain a smaller edge in earnings over same-race, same-education women, creating a smaller divergence over time.
Empirical evidence for a diverging gender gap has been found predominantly among college and advanced degree holders, where glass ceilings are most likely present, indicating that educational advantage intersects with male advantage to produce divergent trajectories (Bertrand et al. 2010; Goldin 2014). Less is known about whether men and women’s earnings trajectories diverge, converge, or remain parallel at lower levels of education. Two recent studies suggest the degree of divergence is muted, though neither uses a nationally representative cohort from longitudinal data (Barth, Kerr, and Olivetti 2017; Goldin et al. 2017).
Race may also interact with and enhance male advantage. Whiteness is a privilege, providing benefits in the labor market and within socioeconomic stratification more broadly (Gaddis 2015; Neal 2004; Thomas et al. 1994). Even whites with other labor market disadvantages hold this privilege (Pager, Western, and Sugie 2009). Minorities achieving high education reap some benefits of their privileged status, but they do not fully experience the advantages enjoyed by similarly educated whites (Gaddis 2015). Regarding gender, black women’s earnings are closer to those of same-race men than are white women’s (Chetty et al. 2018; Mandel and Semyonov 2016), indicating black men’s lack of white advantage may hamper their ability to outearn same-race, same-education women to the same extent as white men. In fact, Chetty et al. (2018) found that black-white differences in men’s employment rates and wages drive the racial income gap. Women have no racial disparities, suggesting that this race gap may be uniquely shaped by the interaction of racial and male privilege. Hewlett (2007) accordingly referred to the male competitive model as the white male career model, suggesting a weaker influence among minorities.
The male advantage identified in the broader gender disparities literature may thus be a uniquely white and college-educated advantage. This variation is likely masked without an intersectional approach, and empirical examination of these intersectional perspectives has been limited, especially in the quantitative literature (McCall 2005). Drawing on previously documented variation in men and women’s earnings trajectories and its components, labor force participation and wage trajectories, we advance testable hypotheses.
Hypotheses and Review of Past Empirical Findings
Gender Differences in Earnings Trajectories by Education
Higher educational attainment is associated with higher labor force participation and more continuous employment for both men and women. Within education levels, men are more likely to work and work more hours than women (Autor 2014). The education gradient in hours worked is wider for men, largely because highly educated men are very likely to work continuously and full-time. Women are more likely to have interrupted work histories or work part-time across all levels of education, but there is likewise an education gradient advantaging more-educated women (Aisenbrey and Fasang 2017; Cotter et al. 2007; Damaske and Frech 2016; Lu et al. 2017). Although highly educated women are more likely than less educated women to remain employed, they may have lower labor force attachment if they are married to men who overwork or are at the top of the earnings spectrum (Cha 2010; Cotter et al. 2007). This suggests the gender employment gap increases with education.
Parallel with hours, higher education is associated with steeper wage growth, especially for men (Tomaskovic-Devey, Thomas, and Johnson 2005). Women’s education is also correlated with wage growth, but family transitions shape this growth and are the focus of much past research on variation in women’s wage trajectories. High-skill, high-wage mothers may experience larger wage penalties compared to less advantaged mothers, although accounting for experience attenuates the difference (England et al. 2016). Conversely, men, particularly those who are married and co-reside with their children and those who are college educated, enjoy a fatherhood premium (Hodges and Budig 2010; Killewald 2013). If college-educated men receive uniquely high wage growth and the largest fatherhood premium, college-educated women may experience the greatest relative parenthood penalty, implying the widest wage divergence for the most educated as well.
Overall, prior empirical work suggests the gender earnings gap likely widens more with age for men and women with more education. This increased growth in gender inequality at the top is consistent with the concept of glass ceilings (Cotter et al. 2001) and two recent studies (Barth et al. 2017; Goldin et al. 2017). We thus hypothesize:
Hypothesis 1: The gender gap in earnings grows across the life course, but the divergence between men and women will be greater among those with more education.
Gender Differences in Earnings Trajectories by Race
Past studies of black-white gaps in wages and employment have often taken a single-sex approach, focusing on men or women but rarely both (e.g., Alon and Haberfeld 2007; Black et al. 2006; Neal 2004). Research on racial differences in the gender gap has predominantly used cross-sectional rather than longitudinal data (e.g., Greenman and Xie 2008; Kilbourne, England, and Beron 1994), and existing longitudinal research has focused on historical patterns rather than patterns by age within a single birth cohort (Bernhardt, Morris, and Handcock 1995; Mandel and Semyonov 2016). While this work does not speak directly to our research question, it motivates our hypotheses.
Research on women’s employment trajectories has shown that black women are more likely than white women to maintain continuous employment through life course transitions such as marriage and childbirth (Florian 2018b; Lu et al. 2017). This may result from necessity because black women may face more economic and family-related constraints than white women (Montez et al. 2014; Neal 2004). Others find white women are more likely to increase their employment across the life course, whereas work pathways of minority women are characterized by more interruptions (Damaske and Frech 2016). Similarly, white men have the highest probability of maintaining full-time, continuous employment across the working years (Antecol and Bedard 2004). Black men are more likely to accumulate time out of the workforce across the early career years, and this gap widens with age (Antecol and Bedard 2004; Tomaskovic-Devey et al. 2005).
Research on wage growth mirrors findings for employment. White women have faster wage growth than black women (Alon and Haberfeld 2007). The same is true for men, particularly during their early career and middle-aged years (Thomas et al. 1994; Tomaskovic-Devey et al. 2005). However, crucial to our work is how relative outcomes for men and women differ within race. White men are especially likely to maintain continuous, full-time employment and have the highest wage growth, but white women’s work pathways are considerably more heterogeneous (Damaske 2011). Black men and women both have more intermittent or interrupted work pathways and face slower rates of wage growth compared to same-gender whites. Consistent with cross-sectional studies of gender-by-race pay disparities (Greenman and Xie 2008; Kilbourne et al. 1994) and parallel to our hypotheses regarding educational differences, where the most advantaged group has the largest divergence (Browne and Misra 2003; Cotter et al. 2001), we hypothesize the following:
Hypothesis 2: The gender gap in earnings grows across the life course, but the divergence will be greater among whites relative to blacks.
Race-by-Education Differences
Is college-educated men’s educational advantage persistent across race? Is the racial advantage we expect white men to accrue similar across levels of education? If one type of status holds consistent benefits across groups, we might conclude that a particular status uniquely promotes labor market success (i.e., educational attainment may trump racial disadvantages). However, prior intersectional theories and research suggest that advantages can doubly benefit those belonging to multiple advantaged groups (Crenshaw 1989; McCall 2005), yielding our final hypotheses:
Hypothesis 3a: The increased gender divergence in earnings trajectories by education levels will be more pronounced for whites than blacks.
Hypothesis 3b: The increased gender divergence in earnings trajectories for whites compared to blacks will be more pronounced for college graduates relative to those with less education.
Data and Measures
We use the National Longitudinal Survey of Youth 1979, a large, nationally representative cohort study spanning over three decades, uniquely suited to addressing our research questions. Men and women were aged 14 to 22 at their first interview in 1979 and 47 to 55 in 2012, the final wave in our analysis. NLSY79 conducted interviews every year from 1979 to 1994 and biennially since, so data on employment and earnings histories are consistent and comprehensive across the majority of respondents’ working-aged years. We exclude military and supplemental samples because follow-ups for these groups ended in 1985 and 1991, respectively. This remaining sample of 6,111 men and women was representative of the noninstitutionalized U.S. population ages 14 to 22 in 1979. We drop the 444 Hispanics from our sample due to small cell sizes and focus on black-white comparisons, as is common in the literature (e.g., Cheng 2016; Mandel and Semyonov 2016).
The analytic sample for our main analyses includes respondents contributing at least one wave of earnings information and providing information on all covariates of interest (N = 82,024 person-years of observations from 5,485 respondents). The majority of excluded cases or observations are dropped due to missing earnings, our outcome variable, and thus we choose to use list-wise deletion rather than multiply impute our data. We also exclude the 6,861 person-year observations where respondents were currently enrolled in school. We restrict our analysis to observations from men and women aged 22 to 47 because the oldest respondents in the cohort were 22 at the time of their first interview and the youngest were 47 at the time of the most recent wave, ensuring adequate sample size at all ages of analysis and spanning men and women’s primary working and childrearing years.
A limitation of any longitudinal study with significant follow-up is the possibility of selective attrition. According to NSLY79’s documentation, the overall retention rate is 72.4 percent in 2012, the last year we use, which is relatively high. 1 Yet, nonrandom attrition across groups could bias our estimates. For instance, blacks and less educated whites may be systematically underrepresented at older ages, which would give us conservative estimates of the magnitude and rate of growth in the gender earnings gap for these groups. However, we have no evidence that attrition significantly differs across groups (see Table 1 for a comparison of number of person-years observed vs. individuals in each group). Descriptive statistics are weighted using baseline weights.
Sample Sizes and Distributions by Education, Race, and Gender.

Source: National Longitudinal Survey of Youth 1979, 1979–2012.
Note: Respondents refer to individuals in the data set; observations refer to the total number of person-years in which individuals are observed. For each group, the first row shows the sample size (respondents or observations), the second shows the row percentage, and the third shows the column percentage.
Our outcome variable is time-variant annual earnings, capturing respondent income from wages, salary, commissions, and tips across all jobs worked in the past year. The CPI inflation adjustment sets all earnings to 2012 dollars. Although earnings are often logged (e.g., Goldin 2014), we choose to use linear earnings to keep observations reporting zero earnings in our analytic sample. Taking the natural log would drop these observations because the natural log of zero is mathematically undefined. As discussed previously, one aim of our analysis is including nonearners, which expresses a fuller picture of gender inequality. In addition, we find it more intuitive to express the magnitude of earnings inequality in terms of dollar amounts as opposed to log points. Our findings are robust to this decision—a sensitivity analysis, noted in the following and presented in the Appendix, shows that results are substantively similar when using the natural log of earnings.
Educational attainment is an average of available self-reports from ages 24 to 27 of years of completed schooling. We divide respondents into three groups: 12 or fewer years (HS or less), between 12 and 16 years (some college), and 16 or more years (college or more). Race is based on interviewer reports of race and self-reports of ethnicity at baseline. We use data from respondents who were classified into two groups: black and non-black non-Hispanic, which largely consists of whites. 2 Reports of race do vary over time in the NLSY79 (Penner and Saperstein 2008), and many adults in this birth cohort attain additional education between their twenties and forties (Grodsky et al. 2016). However, we use baseline reports of race and education because we are interested in whether certain early adulthood statuses disproportionately accrue advantages over time. 3
Analytic Strategy
We model earnings trajectories with individual growth curve models predicting annual earnings. This strategy estimates earnings levels and rates of growth as well as deviations from the average rate and level by gender, race, and education. We model the NLSY79 data as having two levels, with repeated measures across age at level one, nested within individuals at level two. The linear growth curve model can be specified as a combination of both level one and level two models, with the following level one model:

where Yit is earnings for individual i at time t, Ait is age at time t, and eit is an individual and time-specific residual assumed to be normally distributed with a mean of zero. We tested both a simple linear growth curve and growth curve that included an age-squared term and found that the latter improved model fit, as indicated by a lower Bayesian information criterion (BIC), so our final models include a quadratic earnings growth rate term (A2
it
). The terms


To estimate parallel models for race differences, we include race in place of education. The equations estimating the intercept (
We include a series of robustness checks in the Appendix. To assess the sensitivity of our findings to including nonearners, we estimate models excluding observations reporting zero earnings. Relatedly, we include an analysis limited to the subset of respondents who were continuously in the labor force across the observation period. We also model the natural log of earnings as our outcome variable to account for the right-skew of the earnings distribution. In a fourth sensitivity analysis, we control for family characteristics. Although we motivate our hypotheses with past findings on variation in parenthood’s effects on earnings, we do not focus our main analysis on understanding parenthood as a mechanism for two main reasons. First, because our interest lies in overall earnings inequality across groups, we consider parenthood effects part of gender’s full effect. Second, most men and women in this cohort do have children (Martinez, Daniels, and Chandra 2012), which increases the selectivity of the men and women who remain childless. Finally, we provide a sensitivity analysis with total household income as the outcome variable to explore how these individual patterns play out at the household level.
Results
Sample Description
Table 2 shows earnings for men and women by race and education at ages 25 and 45, approximating our age range’s endpoints. These descriptive data demonstrate that men and women follow different earnings trajectories and that gender differences vary by education and race. On average, women earn about $10,000 less than men at age 25, but by age 45, women’s earnings have less than doubled, whereas men’s have increased by almost two and a half times. Women of both races have similar earnings trajectories, though black women have lower average earnings at 25 and lower subsequent growth than white women. Men’s patterns are more variable by race. Most striking is the increase for white men, who earn less than $30,000 at 25 and earn more than $70,000 at 45. Black men, by comparison, have somewhat lower initial earnings and considerably slower growth, averaging less than $40,000 at 45. More education is, predictably, also associated with higher earnings growth, especially for men. College-educated men have notably higher earnings growth than women or less educated men, with the annual earnings more than tripling across the period. College-educated women’s earnings, by contrast, less than double. At the intersections of race and education, black women and especially black men are disadvantaged compared to their white counterparts. Education, however, equalizes the race gap among women such that college-educated women have approximately equal average earnings despite a larger gap for less educated women. Men, on the other hand, experience a persistent race gap, reaching approximately $20,000 or more by age 45 at all education levels.
Mean Earnings ($) by Gender, Race, and Education at Ages 25 and 45.

Source: National Longitudinal Survey of Youth 1979, 1979–2012.
Note: Weighted using National Longitudinal Survey of Youth 1979 baseline weights. Estimates for age 45 are taken from either the year in which respondents were age 45 or 46 to account for the biennial structure of the survey in the years respondents were age 45.
The Gender Earnings Gap across the Life Course by Education
Figure 1 shows gender-by-education differences in earnings trajectories predicted from growth curve models. Dotted lines represent men’s predicted trajectories; solid lines represent women’s predicted trajectories. The dark gray lines represent HS or less, the medium gray represent some college, and the light gray lines represent college graduates.

Predicted earnings trajectories by education and gender.
Trajectories for men and women with HS or less run largely parallel, diverging only slightly across the working years. In Table 3, which presents model estimates, this education category is the reference group, and we find that women with HS or less have a statistically significant baseline earnings disadvantage of about $12,000 compared to same-education men, represented by the coefficient on “Female” (p < .001). Women also have a disadvantage in earnings growth compared to men, shown on the female-age interaction, by about $440 a year (p < .001). Although the gender gap is marked initially upon labor market entry and persists, it grows only slightly with age.
Growth Curve Model Estimates of Earnings.

Source: National Longitudinal Survey of Youth 1979, 1979–2012.
Note: Includes year-specific dummy variable controls. Coefficients are listed above standard errors.
p < .001.
For more educated groups, the initial earnings disadvantage for women is significantly smaller than for women with HS or less, seen in the female-education interactions (p < .001). The gender earnings gap among those with some college is only about $4,300 (p < .001). 4 For college graduates, women actually have a slight advantage of $5,600 (p < .001). Perhaps this is because those with some college and especially those who complete college may have only just entered the labor force, so men’s labor market advantage has not yet been established.
The gender disparity in earnings growth, however, is far more pronounced for groups who attended college, as shown on the female-education-age interactions (p < .001). Figure 1 shows that men and women with some college have a more substantial divergence in earnings across life than those with HS or less. For those with HS or less, women’s earnings growth disadvantage is only $440 a year (p < .001), compared to just over $1,500 for women with some college (p < .001). Figure 1 depicts the starkest divergence for the college-educated—women’s initial slight earnings advantage is quickly reversed as men’s earnings growth outpaces women’s by $3,500 per year (p < .001). College-educated women’s marked disadvantage in earnings growth compared to college-educated men combined with a slower growth rate for non–college educated men lead earnings trajectories to follow more parallel pathways for less educated men and women while they diverge for more educated men and women, supporting Hypothesis 1.
The Gender Earnings Gap across the Life Course by Race
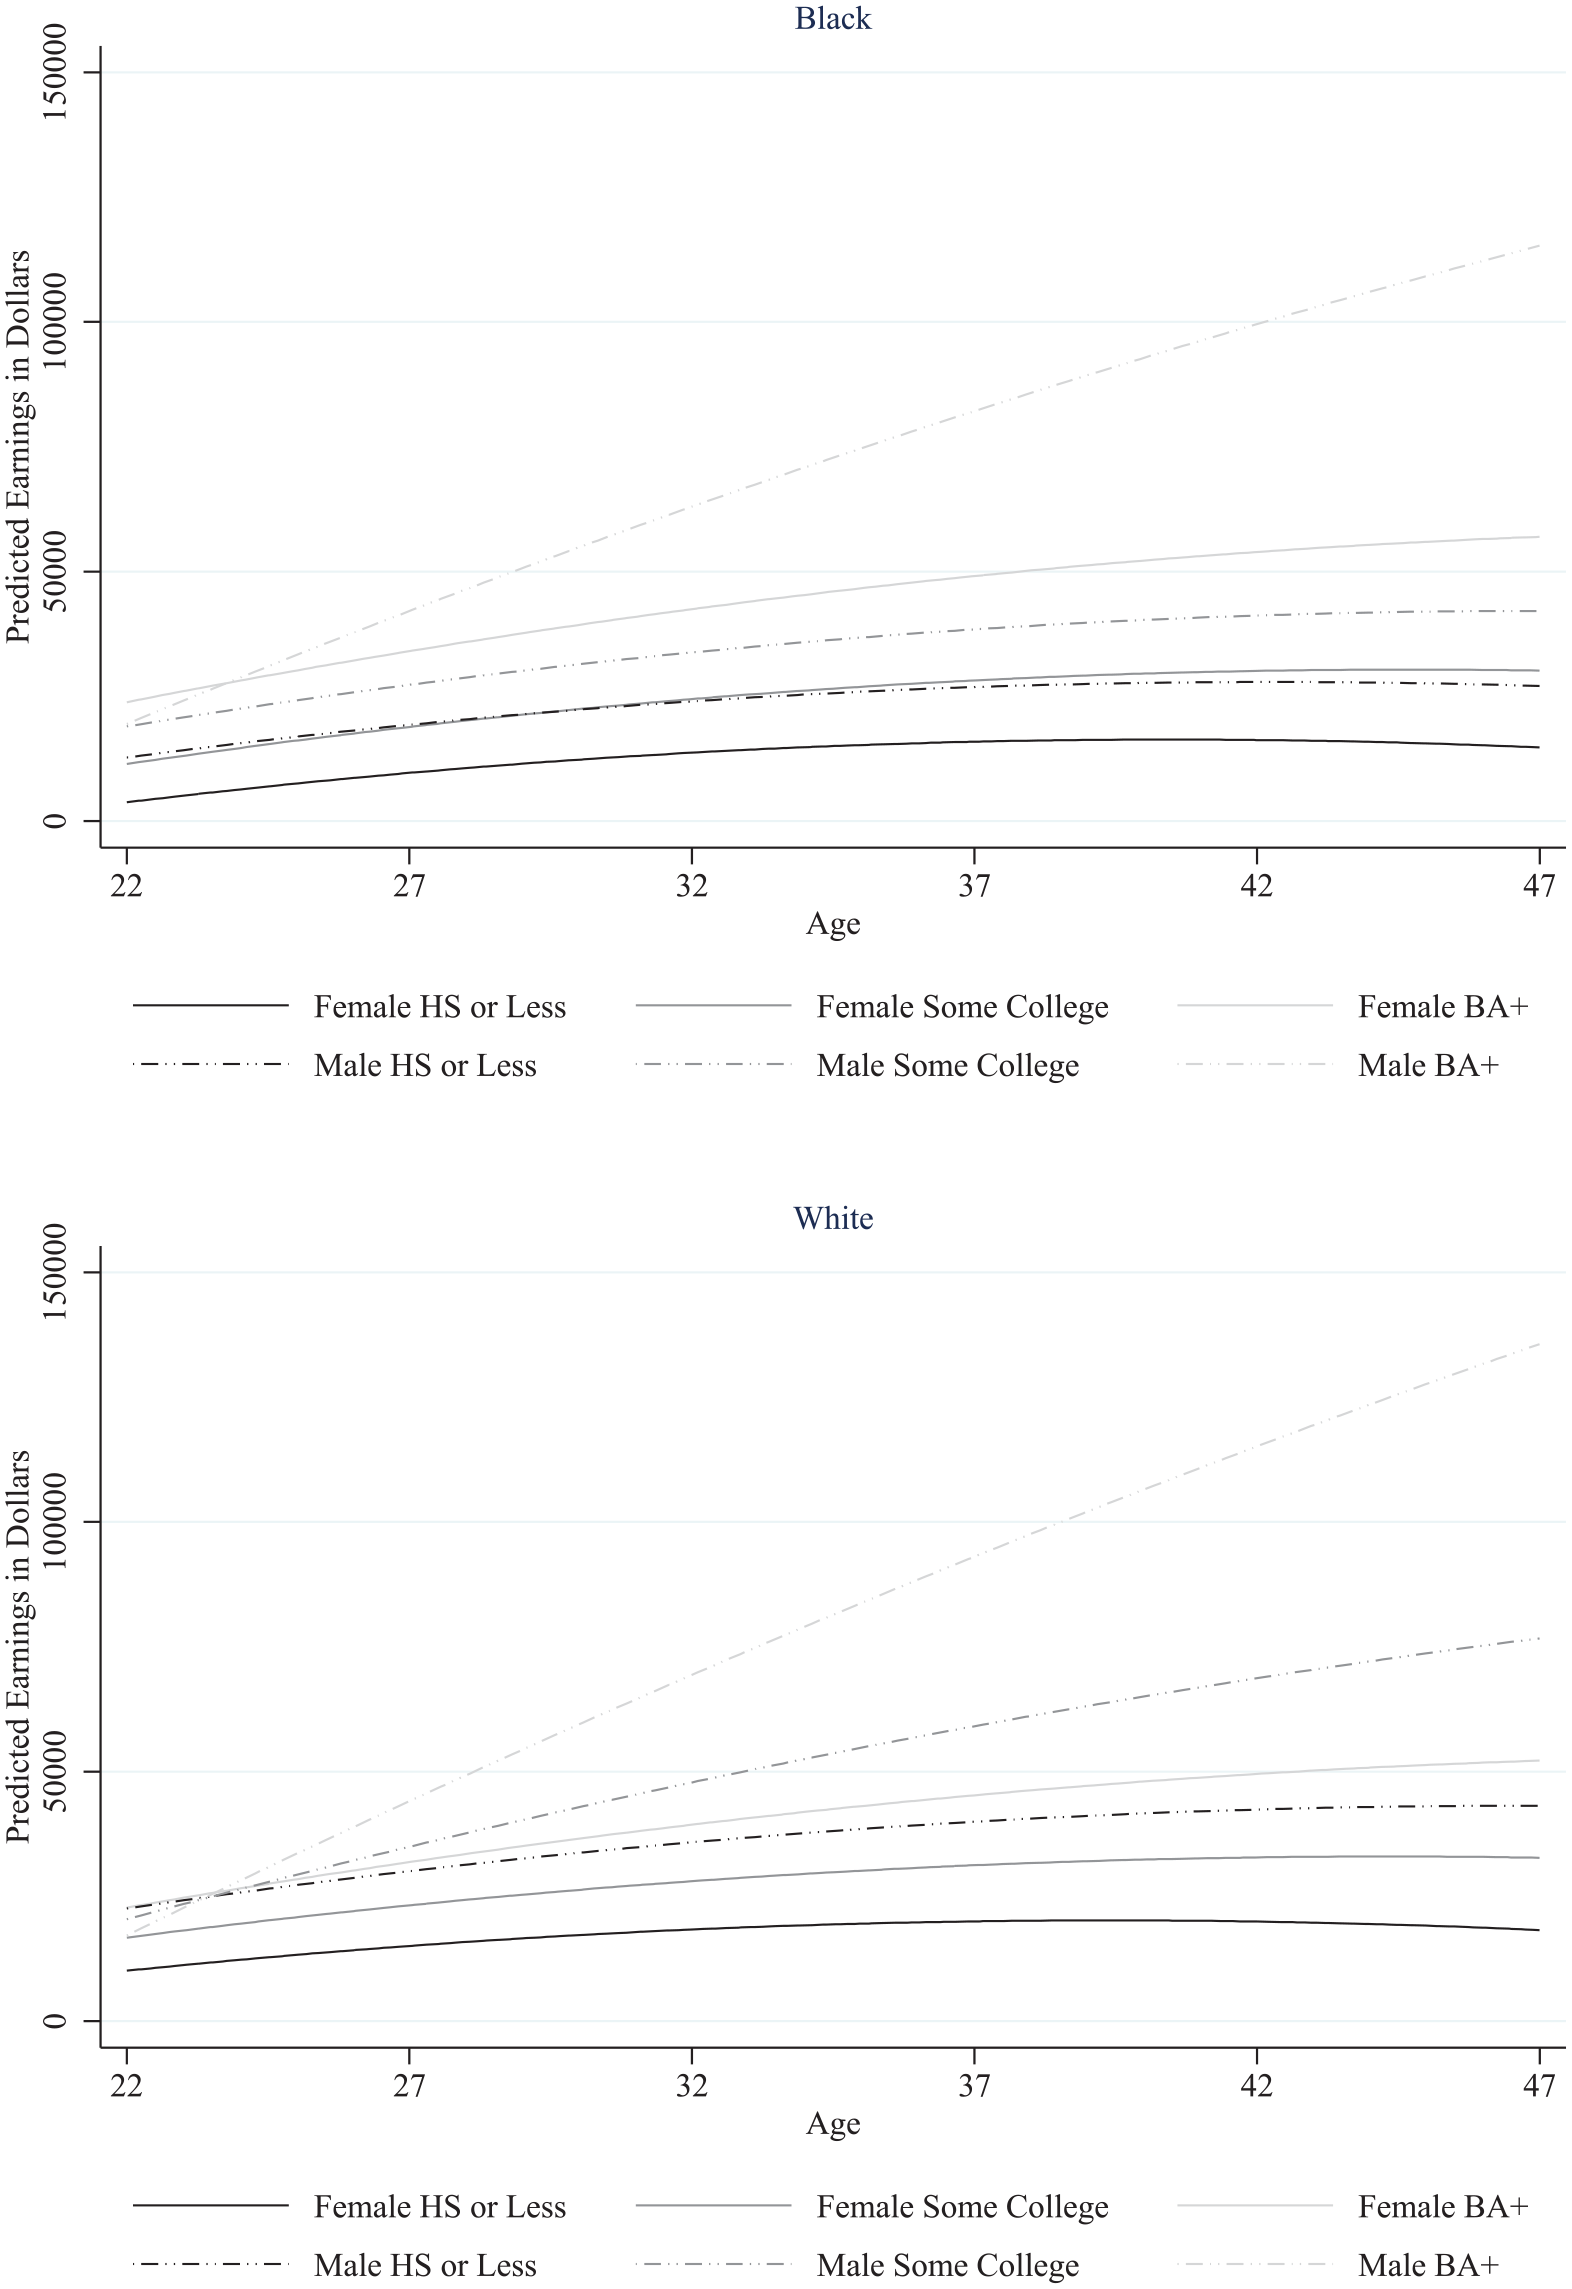
Figure 2 shows predicted earnings trajectories from growth curve models allowing for race-by-gender differences in earnings levels and growth rates. Light gray lines represent earnings trajectories for whites; medium gray lines represent trajectories for blacks. Coefficient estimates are in the second column of Table 3.

Predicted earnings trajectories by race and gender.
As with education, the most advantaged group, whites, observes the most substantial gender divergence, supporting Hypothesis 2. White women earn about $6,900 less than men at baseline (p < .001), and the disparity grows across life, given that their yearly rate of growth, seen on the female-age interaction, is about $1,350 lower than that of white men (p < .001). Black men and women have less change across life. Black men have lower initial earnings compared to white men by almost $6,000, represented by the black coefficient (p < .001), but the difference for black and white women on the race-gender interaction is considerably smaller and not statistically significant. Still, compared to black men, black women earn about $6,800 less at baseline (p < .001), so the gender gap upon labor market entry is similar across race. Yet gender differences in earnings growth for blacks are smaller and not statistically significant.
Together with the education models, these findings suggest that although gender earnings gaps generally widen with age, the divergence is most pronounced for the most advantaged groups: those with a college degree or more and whites.
The Gender Gap by Education, Stratified by Race
We next examine whether and how forms of (dis)advantage interact. Figure 3 presents race-stratified results, the top panel for blacks and the bottom panel for whites. Model estimates are in the Appendix. The shape of earnings trajectories and the degree of gender divergence at each education level differs by race, showing a more pronounced divergence for highly educated whites than blacks and supporting Hypothesis 3a.
Predicted earnings trajectories by education and gender, stratified by race.
Black men and women with HS or less have an initial gender gap of $9,000 (p < .001). For those with some college, the gap is slightly smaller, close to $7,600 (p < .001). Although these gaps persist across life, trajectories remain parallel rather than diverge. Only college-educated black women have a statistically significantly lower earnings growth rate than same-education black men, by about $2,500 per year (p < .001), diverging from initial earnings parity. Education thus amplifies a masculine advantage for black men’s earnings with age relative to black women, creating a growing gap.
For whites, gender differences in earnings trajectories by education are more pronounced. As in the pooled models, college-educated white women have a baseline earnings advantage of about $5,600 over men (p < .001). Less educated white women have lower baseline earnings than men, with a $3,600 gap for those with some college (p < .05) and a $12,500 gap for those with HS or less (p < .001). In comparison to less educated white women, white college-educated women have significantly slower earnings growth relative to same-education men, shown on the female-by-education-by-age interaction. Despite the initial female advantage, this annual male advantage of $3,600 in earnings growth creates the substantial gender earnings divergence for college-educated whites (p < .001). Smaller male advantages in earnings growth of $1,600 for those with some college and $500 for those with HS or less create a slower gender divergence for less educated whites (p < .001). Unlike for blacks, however, white women of all education levels have lower rates of earnings growth than same-education men, so earnings diverge for all.
The Gender Gap by Race, Stratified by Education
Figure 4 displays predicted earnings by age, gender, and race, with results for men and women with HS or less, some college, and college or more in the top, middle, and bottom panels, respectively. Model estimates are in the Appendix. These analyses provide partial support for Hypothesis 3b, with some caveats.
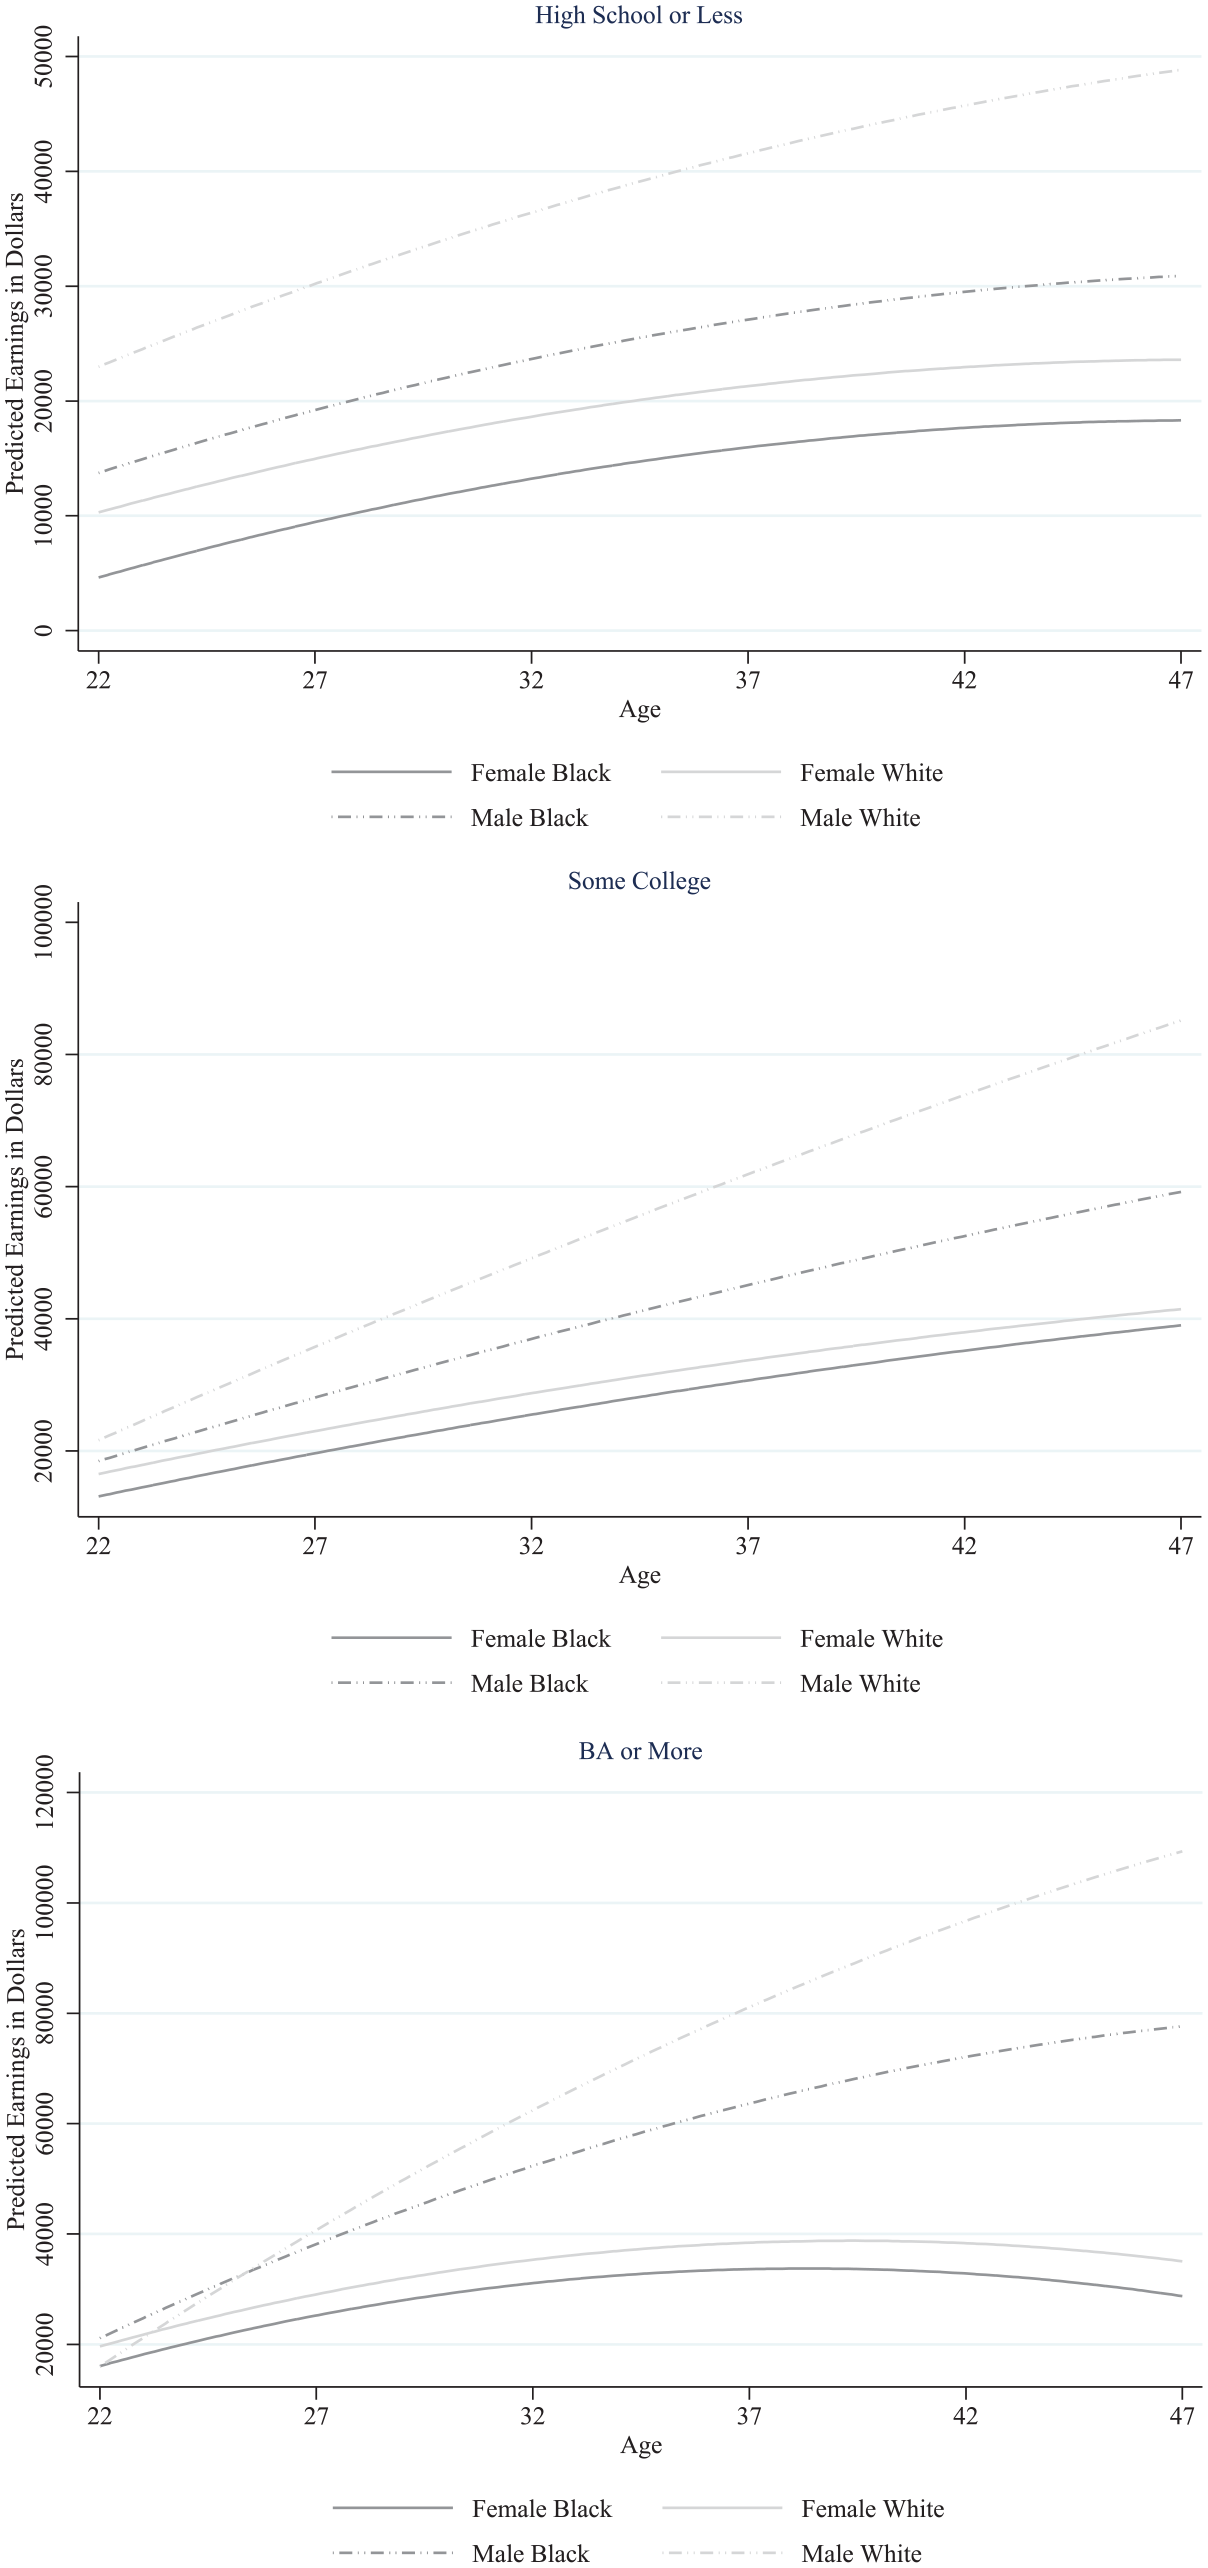
Predicted earnings trajectories by race and gender, stratified by education.
Although the levels of earnings differ drastically by race and gender among those with HS or less, there are few gender-by-race differences in earnings growth rates, creating more parallel trajectories. White men have higher baseline earnings than black men, but men’s earnings growth rate only slightly amplifies their advantage with age, with less than a $500 annual growth advantage over white women (p < .001). Black men and women have a slightly smaller initial gender gap than whites, but they have no statistically significant gender difference in growth, resulting in parallel paths with a persistent female disadvantage. Among less educated groups, whiteness seems to confer a consistent, rather than cumulative, advantage especially to men.
White and black women with some college have statistically similar patterns (with a small race gap), but white men’s earnings trajectories diverge notably from black men’s trajectories, with a yearly $1,400 earnings growth advantage (p < .001). Male-female trajectories are thus more parallel for blacks than whites. While white women lag behind white men’s earnings growth by almost $1,600 per year (p < .001), the black gender gap in earnings growth is small and not statistically significant. For those with some college, being both white and male affords an advantage that accumulates over the working-aged years in a way that neither characteristic alone allows.
For white college-educated men, we find evidence of cumulative advantage. Yet college-educated black men have neither a statistically significant disadvantage in baseline earnings nor earnings growth compared to same-education white men. They fall only somewhat behind in their earnings trajectories, suggesting that at high levels of education, racial disadvantage in earnings trajectories appears to fade. Gender disadvantage, however, remains and is especially strong. Compared to white men, white women’s earnings growth lags by nearly $3,600 each year (p < .001). Women of both races, however, see statistically comparable baseline earnings and trajectories. Among college graduates, our findings suggest white privilege is less pronounced—statistically undetectable in our models—both at baseline and as it grows across the life course than is the case for less educated groups. Male privilege, instead, is amplified, combining with educational advantage to expand across the life course, creating a substantial gender earnings gap despite initial gender parity (or even female advantage).
Discussion and Conclusions
Guided by life course and intersectional perspectives, we enhance our understanding of gender inequality by documenting variation in earnings trajectories across the working-aged years in a nationally representative cohort, across race and education. As we hypothesize, the patterns identified in the literature, which predominantly focus on the highly educated, are not universally observed across race and education. The gender gap expands or persists for all across life, but the expansion is largest among advantaged race and education groups. With few exceptions, less educationally or racially advantaged groups see more parallel trajectories. The expansion of the gap for some groups and the lack of expansion for others is largely attributable to wide variation in men’s rates of earnings growth.
Our approach highlights how various forms of social advantage interact and accumulate across life. Past research has focused either on life course patterns without attention to intersectionality or cross-sectional intersectional differences. Our findings are generally aligned with our hypotheses, which were primarily based on cross-sectional and historical data and synthetic cohort approaches (e.g., Greenman and Xie 2008; Mandel and Semyonov 2016), combined with intersectional theories about interactive forms of advantage (e.g., Browne and Misra 2003; Crenshaw 1989; McCall 2005). In particular, we support findings that group variation across men’s pay is larger than across women’s pay and drives differences in gender disparities (Autor 2014; Chetty et al. 2018; Mandel and Semyonov 2016). This indicates that point-in-time estimates do not provide misleading conclusions, but they do tell an incomplete story about how these patterns evolve with age. Additionally, our findings suggest that insights about the gender gap’s life course patterns drawn from studies focusing on advantaged groups may not be generalizable to less advantaged populations (e.g., Bertrand et al. 2010; Noonan et al. 2005). Finally, this evidence supports theories that holding multiple forms of gendered, racial, and/or educational advantage has a multiplicative effect (e.g., Browne and Misra 2003; Crenshaw 1989; McCall 2005) and that these forms of advantage accumulate across life (e.g., DiPrete and Eirich 2006), with male advantage being most pronounced when holding racial and/or educational advantages as well.
Our findings are consistent with a gendered glass ceiling in that gender inequality increases more among groups with more social advantages. Men’s earnings have much wider inequality across education and race groups than do women’s, suggesting that male privilege is magnified more when combined with another form of advantage than is women’s lack of privilege. Although white women and college-educated women are most disadvantaged relative to their male counterparts, they still have higher or equal earnings and faster or equal growth compared to less advantaged women. Even when considering within-gender life course inequality, men’s racial and educational advantages accumulate in ways that women’s do not.
Education especially magnifies the male advantage. College-graduate men have notably faster earnings growth than less educated men or even same-education women, substantially accumulating advantage with age. Although this advantage for college-educated men holds for both racial groups, it is larger among whites, suggesting that men with a college degree reap both male and educational advantages that interact and accumulate across the life course. Across racial groups, the gender difference in earnings growth for whites is larger at all levels of educational attainment, again suggesting the gender gap’s divergence is largest where male advantage can interact with racial advantage even when educational advantage is not present.
College-educated black men also have steep earnings trajectories, creating a divergence from black women more similar to the growing gap experienced by same-education whites than is present for other education groups. Among college graduates, earnings growth and levels and the gender gaps therein are most similar across race, suggesting that educational advantage enhances male advantage more than racial disadvantage suppresses it. Perhaps the career structure and value systems of the jobs most often occupied by both black and white college graduates facilitate this male advantage and its strong life course accumulation (Hewlett 2007; Kanter 1977). Women of both races in these kinds of jobs may struggle to follow the traditional male career model, which values continuous, committed work through the early childbearing and childrearing years. Less educated groups may be less likely to be employed in jobs subscribing to this model, regardless of gender (Correll et al. 2007; Gorman and Kmec 2009).
Still, our small sample of black college graduates leaves us cautious in our interpretation of this finding about black college-educated men’s cumulative advantage. Past research that does not look at the race gaps within education groups would not suggest that some black men would receive this sort of advantage (e.g., Chetty et al. 2018; Mandel and Semyonov 2016), but pooling across education groups may be hiding this variation. A fruitful avenue for future research would be to investigate whether these patterns for black men persist in longitudinal data sets with larger sample sizes of black college graduates. From there, researchers could explore racial similarities and differences in the mechanisms behind highly educated men’s cumulative advantage.
Our analysis is not without limitations. We have a somewhat small sample, especially for blacks when divided by education, and attrition leads our subsamples to further decline as respondents age. Data and sample size limitations also preclude further exploring variation within our specified education and racial categories. NLSY79 defines only three race/ethnic groups: blacks, non-black non-Hispanics, and Hispanics (who we exclude from our analysis due to small cell sizes). Ideally, we would have larger subsamples for each and consider more fine-grained race/ethnic groups, as do studies that use larger cross-sectional samples, such as the census (e.g., Greenman and Xie 2008). Given past findings from cross-sectional studies and single-gender longitudinal studies, we expect that minority groups, especially Hispanics, would follow patterns more similar to those of blacks than whites (Florian 2018a; Greenman and Xie 2008; Lu et al. 2017; Tomaskovic-Devey et al. 2005). Future work should explore these life course dynamics across more fine-grained racial categories. Regarding education, recognizing gradients within our education levels, including assessing variation in the meaning of “some college” and separating graduate degree holders from college graduates, would highlight further heterogeneity and is an area for future research using larger data sets.
Our findings are likely cohort-specific, but we can hypothesize how patterns may differ in more recent cohorts. Rising gender equality in the family and workplace suggests lower gender disparities among today’s younger adults. Wage gaps have attenuated over time (Blau and Kahn 2017), and rising rates of female employment (especially among college-educated women) suggest the earnings gap has attenuated too (Blau and Winkler 2017; Cotter et al. 2007). If men hold a smaller baseline advantage, it may be less likely to accumulate as drastically with age. Still, increased prevalence of and returns to overwork among men may indicate that even as the gender gap narrows, masculine norms may ensure that patterns of divergence and convergence persist (Cha 2010). Conversely, falling pay and rising unemployment for men with low education may promote even less expansion among the disadvantaged due to weakened male advantage (Autor 2014). Documenting these patterns in other cohorts (e.g., NLSY 1997) once they have completed their working and childbearing years is a promising avenue for research.
Footnotes
Appendix
Acknowledgements
We thank David Pedulla, Jim Raymo, Tim Smeeding, Christine Schwartz, Myra Marx Ferree, Eric Grodsky, Sasha Killewald, and Lindsay Stevens for comments on previous drafts. We presented an earlier version of this project at the 2017 Population Association of America conference in Chicago, Illinois.
Funding
The author(s) disclosed receipt of the following financial support for the research, authorship, and/or publication of this article: This research was supported in part by a National Institutes of Aging (NIA) training grant (T32 AG00129) to Center for Demography of Health and Aging (CDHA) and by a Eunice Kennedy Shriver National Institute of Child Health & Human Development (NICHD) training grant (T32 HD07014) to the Center for Demography and Ecology (CDE), both at the University of Wisconsin-Madison. The authors gratefully acknowledge use of the services and facilities of UW-Madison’s CDHA (P30 AG17266) and CDE (P2C HD047873).
1
2
NLSY79 does not include information allowing differentiation among non-Hispanic non-black racial groups, but the documentation indicates the number of nonwhites is low.
3
Results are similar with measures of completed education measured at ages 44 to 47.
4
Model estimates with alternate reference groups for both education and race models are available on request. However, those point estimates can be derived from the tables provided.
5
Note that observations where respondents are enrolled in school are not dropped in this analysis. The growth curve models would not converge without these observations. However, given that the analysis is at the household level, not the individual level, individual enrollment for the respondent (without attention to enrollment status of other possible earners in the household) is less important.