
Abstract
Participation in extracurricular activities (ECAs) is positively related to cognitive and socioemotional outcomes for children and adolescents. The authors argue that because of methodological limitations, prior research failed to address the self-selection of advantaged families into ECAs, which raises concerns regarding whether ECA participation is causally related to student outcomes. In this article, the authors present an analytical model that provides a stronger test of causal relationships. The authors analyze data from six waves of the Early Childhood Longitudinal Study–Kindergarten Class of 1998–99 (K–8) and construct a cross-lagged panel model with student fixed effects. Overall, the findings suggest that participation in ECAs during elementary school has small but positive causal effects on academic ability, which grow larger in later grades (third grade through eighth grade). The findings provide little evidence that greater ECA participation improves students’ socioemotional skills in either early or later grades. Overall, the findings validate some prior research while raising questions about the internal validity of other findings.
Research on extracurricular activities (ECAs) has consistently documented positive relationships between ECA participation and cognitive, psychological, and social outcomes for children and adolescents. In particular, many studies have shown that ECA participation is associated with higher test scores (Covay and Carbonaro 2010; Feldman and Matjasko 2005; Fredricks and Eccles 2006, 2010; Marsh and Kleitman 2002; Morris 2015), better psychological and behavioral outcomes (Denault and Déry 2015; Fredricks and Eccles 2010), and a higher likelihood of attending college (Barber, Eccles, and Stone 2001; Gardner, Roth, and Brooks-Gunn 2008; Mahoney, Cairns, and Farmer 2003; Morris 2016). Some authors have explicitly identified access to and participation in ECAs as a source of advantage that contributes to socioeconomic status (SES) and racial/ethnic inequality in school outcomes (Covay and Carbonaro 2010; Lareau 2011; Nelson 2017).
Despite the volume of studies on this topic, questions remain regarding whether this body of research convincingly demonstrates that ECA participation is causally related to student outcomes. Given the self-selection of advantaged families into ECAs, skepticism about causality is warranted. In addition, numerous methodological limitations in prior research raise legitimate questions regarding whether ECA participation is causally related to student outcomes. In particular, much prior research in this area has relied on cross-sectional analyses, often relying on nonrepresentative, convenience samples of high school–aged students (Holland and Andre 1987; e.g., Barber et al. 2001; Cooper et al. 1999; Eccles and Barber 1999; Eccles et al. 2003). Studies in the past decade that analyzed panel data offer greater leverage in making causal inferences, but typically, these studies relied on simple pre- and posttest designs that are still vulnerable to unobserved confounding variables that make causal inference difficult (Fredricks 2012; Fredricks and Eccles 2010; Marsh and Kleitman 2002; Morris 2015).
In this article, we present an analytical model that addresses many of the methodological limitations of prior studies and provides a stronger test of causal relationships between extracurricular participation and student outcomes. Using structural equation modeling (SEM), we analyze data from six waves of the Early Childhood Longitudinal Study–Kindergarten Class of 1998–99 (ECLS-K:98) (K–8) and construct a cross-lagged panel model (CLPM) with student fixed effects. As described below, a major virtue of this model is that it accounts for between-student confounding by including student fixed effects, which is especially important given concerns regarding confounding due to unobserved differences across families. The model also allows us to simultaneously estimate multiple outcomes (academic ability and socioemotional skills) in the same model, using a lagged and cross-lagged design, to address concerns about time ordering and time-varying confounders. By using SEM to estimate our parameters, we also introduce measurement models into the analysis to correct for possible measurement error when estimating the parameters. Finally, our model allows us to test whether ECA participation has varying effects on students’ outcomes at different stages of students’ elementary and middle school careers.
Overall, our findings suggest that participation in ECAs during elementary school has small but positive causal effects on academic ability. The effects grow larger for students in later grades (third grade through eighth grade). In contrast, our findings provide little evidence that greater ECA participation improves students’ socioemotional skills in either early or later grades. Indeed, some evidence suggests that there might be negative effects of ECA participation on socioemotional skills. Overall, our findings validate some prior research while raising questions about the internal validity of other findings.
Research on ECA Participation and Student Outcomes
Roughly 80 percent of students are involved in some sort of ECAs, ranging from sports to music to clubs, beginning in elementary school and continuing throughout middle and high school (Mahoney, Harris, and Eccles, 2006). Most studies have found positive associations between ECA participation and educational and socioemotional outcomes. Fredricks and Eccles (2005, 2006, 2010) have consistently found positive academic outcomes from participation in ECAs in numerous studies (Eccles and Barber 1999; Eccles et al. 2003), a finding that has been replicated by other scholars (Cooper et al. 1999; Gerber 1996; Im et al. 2016; Metsäpelto and Pulkkinen 2012; Morris 2015). Additionally, ECA participation has been linked to higher college attendance rates and occupational success (Gardner et al. 2008; Morris 2016). The timing and consistency of ECA participation may affect academic outcomes; a study using the National Institute of Child Health and Human Development’s Study of Early Child Care and Youth Development data indicated that consistent participation throughout elementary and high school and activities begun during the transition to high school had a significant relationship with academic achievement during high school (Crosnoe, Smith, and Leventhal 2015).
Similarly, ECA participation has been linked to psychological and social outcomes for students. More frequent ECA participation has been linked to better social skills and fewer behavioral problems, including higher self-esteem and interpersonal competence skills and lower rates of depression and self-isolation (Barber et al. 2001; Denault and Déry 2015; Holland and Andre 1987; for a review, see Mahoney et al. 2003). Similar to their analysis of academic outcomes, Fredricks and Eccles (2005, 2006, 2010) also consistently found an association between ECA participation and increased psychological adjustment and fewer behavioral issues within the classroom. Finally, early ECA participation has been linked to better teacher and parent reports of behavior at the end of elementary school (Posner and Vandell 1999).
There is some indication that participation in specific ECAs can be linked with socioemotional outcomes (e.g., performing arts with persistence in the classroom, club attendance with fewer internalizing behaviors, service with social capital, and sports with “development of initiative”; Larsen, Hansen, and Moneta 2006; Metsäpelto and Pulkkinen 2012). On the other hand, some negative consequences for behavioral outcomes have been documented, particularly between sports participation and underage alcohol consumption and performing arts with suicide attempts (Barber et al. 2001; Eccles and Barber 1999). Furthermore, there is some evidence that very intense participation in ECAs may have diminishing returns. That is, when there is extreme involvement in ECAs, measured both as cumulative number of activities and hours spent doing these activities or intensity of involvement, children reap fewer academic benefits (Marsh and Kleitman 2002) or may even face negative consequences (Fredricks 2012).
Socioemotional Skills as Both an Outcome and a Mechanism
More recent research has tried to identify the mechanisms that link ECA participation with achievement outcomes. Typically, ECA participation is expected to help students develop better socioemotional skills, which in turn improves students’ cognitive and academic outcomes (e.g., Covay and Carbonaro 2010). Many ECAs, including sports, music, drama, and clubs, involve socioemotional skills such as teamwork, persistence, and goal-oriented behavior, which may translate into success in the classroom. ECA participants are also exposed to high-stakes evaluation situations that may mimic achievement test environments in the classroom (Covay and Carbonaro 2010). The relationship could also be indirect, with the socioemotional skills gained from ECA participation facilitating a better teacher-student relationship that leads to greater academic growth and attachment to school and school-based authority figures (Eccles et al. 2003).
Additionally, ECAs “provide children with an opportunity to interact with more privileged peers, who can model appropriate behavior in educational settings” (Covay and Carbonaro 2010:22). Early research highlighted this pathway through the hypothesis that ECA participation created “prosocial peer groups” that encouraged positive behaviors and attachment to school while building school-based social capital and mediating “some of the positive associations of activity participation with school engagement and lack of depression” (Eccles and Barber 1999; Eccles and Gootman 2002; Fredricks and Eccles 2005:507, 517).
Morris (2015) found that socioemotional skills were one of several variables (along with educational expectations and parental communication) that mediated the relationship between ECA participation and math test scores (net of family income). Similarly, the results from Covay and Carbonaro’s (2010) analysis of SES and ECA participation revealed a statistically significant relationship between ECA participation and “approaches to learning.” The authors concluded that these skills largely mediated the overarching relationship between ECA participation and achievement (although this varied by SES differently for specific sports).
An additional theorized pathway through which these socioemotional skills are conferred and influence academic success is through teacher-student relationships. Much of the research on socioemotional outcomes has used teacher ratings of behavior as the primary operationalization of psychological adjustment (Dumais 2006; Posner and Vandell 1999), and teacher perceptions and expectations for students on the basis of classroom behavior have been linked to student performance within the classroom (Jussim and Harber 2005; Rosenthal and Jacobson 1968). A lab vignette experiment showed that teachers had higher expectations for students who participated in ECAs than for those who did not or those who had jobs (Van Matre, Valentine, and Cooper 2000). Teacher expectations for students can lead to better outcomes in that they hold students to higher standards (Figlio and Lucas 2004) or may simply be associated with these outcomes because teachers can be fairly accurate in predicting student trajectories (Jussim and Harber 2005).
Parents largely endorse the view that ECA participation has positive effects on their children’s development, which motivates them to enroll their children in numerous ECAs. Lareau (2011) documented how social class shapes parenting practices, and professional-class parents explicitly viewed ECAs as vehicles through which their children would be properly socialized, gain skills important to later success, and become part of essential peer groups. Chin and Phillips (2004) found that both professional and working-class parents viewed summer out-of-school activities as a means for children to develop important skills and talents. However, structural constraints made it more difficult for working-class families to find and enroll their children in these activities.
Methodological Limitations of Prior Research
Although the body of research on ECA participation presents a consistent and positive picture of the benefits of ECA participation, we argue that skepticism regarding causal inference is warranted. First, as discussed above, families (and students themselves) self-select into ECAs (e.g., Lareau 2011). These findings raise the concern that families that enroll their children in ECAs are also actively helping their children succeed in school in ways that are unmeasured by standard indicators of family SES. Thus, even when controlling for SES, ECA participation may be confounded with unobserved parental attitudes and parenting practices, which jointly determine ECA participation and student outcomes, thereby making the associations observed in prior research spurious.
Studies of ECA participation that rely upon cross-sectional analyses are extremely vulnerable to bias due to unobserved self-selection, and this design is fairly common in the foundational literature (e.g., Barber et al. 2001; Cooper et al. 1999; Eccles and Barber 1999). Baseline controls can be added to a cross-sectional model, but any omitted variables that are related to ECA participation and the outcome will bias the estimate of the causal effect of ECA. Figure 1 presents a directed acyclic graph (DAG) to illustrate the challenge in identifying the causal effect of ECA participation with cross-sectional data. In the diagram, ECA participation is causally related to both math scores and socioemotional skills (indicated by the green arrows). However, backdoor pathways (in red) that are connected to a vector of unobserved variables (U) remain open, and these pathways bias the measured association of ECA with the outcomes. Conditioning on U would close these pathways and identify the causal effect, but because U is unobserved, it is not possible to identify the causal effect via conditioning. Cross-sectional studies rely on the assumption that all confounding variables are observed and controlled for through conditioning in the model, a very strong assumption that is unlikely to be met with observational data.
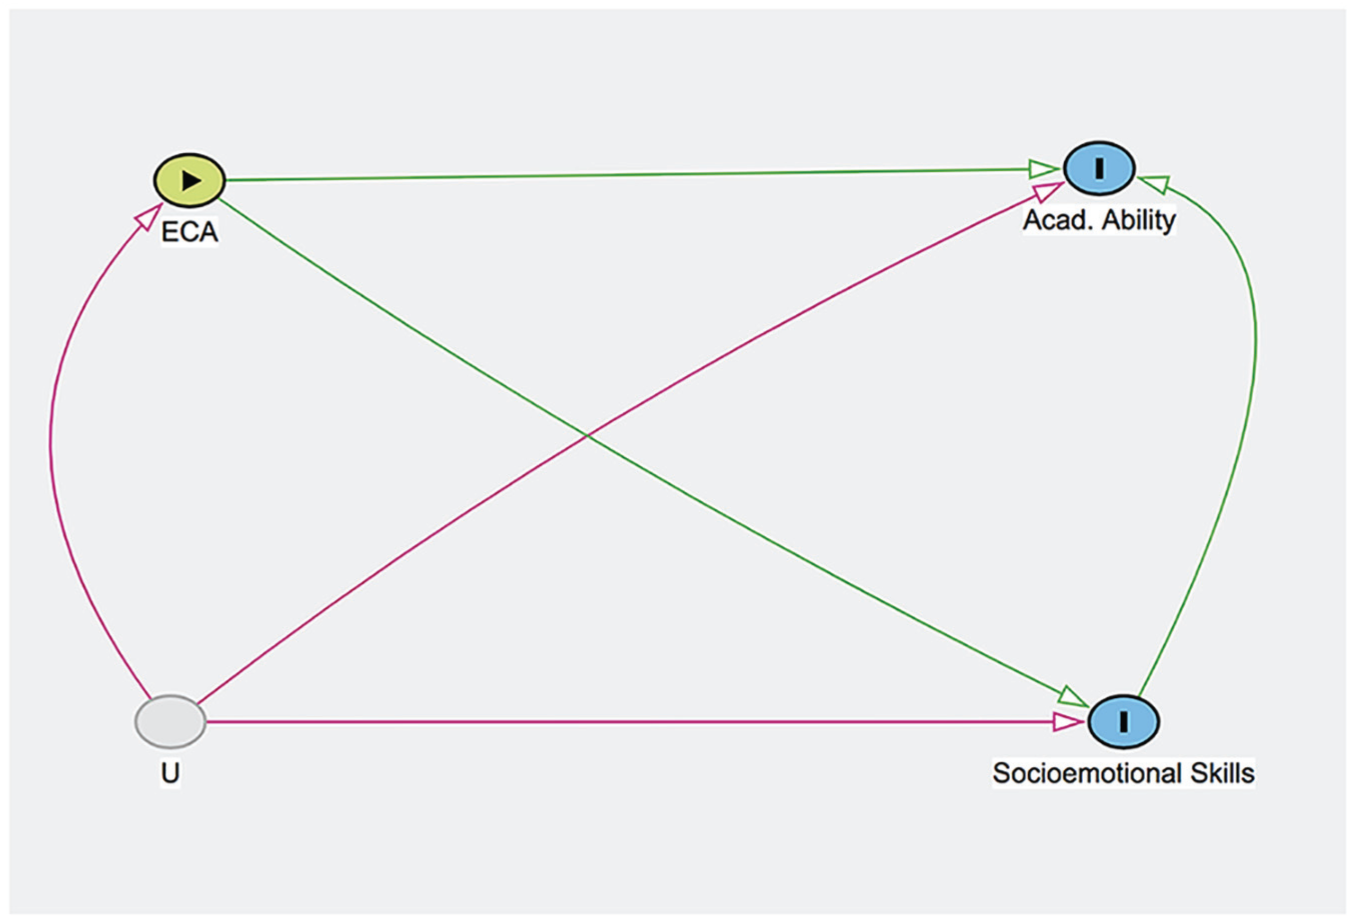
A directed acyclic graph of the causal effect of extracurricular activities (ECAs) on academic ability and socioemotional skills, confounded with a vector of unobserved variables (U).
A growing number of studies have analyzed panel data with at least one or two lagged time points of previous achievement (Covay and Carbonaro 2010; Crosnoe et al. 2015; Fredricks 2012; Morris 2016) to address the problem of self-selection. Panel data offer an opportunity to construct models that are much better suited to estimating causal effects by exploiting the time-ordered structure of the data. Variables at time 1 cannot be caused by variables at later time points. Thus, time-ordered data can establish the direction of causality and eliminate the threat of reverse causation, which plagues cross-sectional designs. In addition, the inclusion of lagged variables to a regression can help close backdoor pathways that might bias causal pathways. For example, Marsh and Kleitman (2002) attempted to resolve some of these methodological issues in the ECA literature by analyzing the National Education Longitudinal Study of 1988 and predicting 12th grade outcomes with controls for previous achievement in 10th and 8th grades. They found that school-based ECA participation was linked with higher educational achievement and educational aspirations. A relatively small number of studies have used “time minus 1” (t – 1) lags to control for possible confounding between ECAs and unobserved variables at baseline (Broh 2002; Covay and Carbonaro 2010; Fredricks 2012; Im et al. 2016; Morris 2015, 2016). These studies generally find significant (albeit substantively smaller) relationships between ECA participation and student outcomes (Covay and Carbonaro 2010), even after lags are included in the model.
Figure 2 shows a DAG that illustrates how lagged variables can eliminate backdoor pathways when estimating the causal effects of ECAs on student outcomes. As the figure shows, a vector of unobserved variables (U, shaded in gray) affects the student outcomes at time 1 and also ECA participation at a later time. If vector U affects the outcomes only at the baseline wave, then conditioning on the outcomes at time 1 (the lagged variables) will produce an unbiased estimate of ECA on the outcomes at time 2. As the DAG shows, conditioning on the lags of the outcome (represented as white circles) at time 1 eliminates bias in the effects of ECA on both outcomes at time 2 (represented by the green arrows, without the biased pathways in red).

A directed acyclic graph of the causal effect of extracurricular activities (ECAs) on academic ability and socioemotional skills at time 2 (T2), confounded by a vector of unobserved variables (U) but conditioned on lags at time 1 (T1).
Conditioning on the lagged values of the outcome at time 1 relies on a much weaker assumption than the cross-sectional DAG presented in Figure 1: vector U is assumed to affect the outcomes only through the baseline scores. The addition of lags to the model is a substantial improvement over cross-sectional models with regard to bias reduction. The model also includes cross-lagged variables, from academic ability at time 1 to socioemotional skills at time 2 (and vice versa), which adjusts for a possible causal relationship between the two outcomes of interest. However, the use of lagged and cross-lagged variables remains vulnerable to unobserved confounding variables that affect ECA participation and student outcomes independently at both time points. For example, if arrows were drawn from U to the time 2 outcomes in Figure 2, the ECA effects would be biased, even after conditioning on the time 1 lags and cross-lags. We believe that it is plausible that unobserved variables (such as parenting attitudes, practices, or familial resources) could affect outcomes at baseline but also continue to have direct effects at later time points that introduce bias when making causal inferences. In this article, we propose a stronger design that addresses concerns about confounding, even when lagged and cross-lagged variables are included in the analysis.
Research Questions and Analytical Plan
Our main goal in this article is to examine an important but unanswered question: does ECA participation causally affect socioemotional skills and academic achievement? We propose a CLPM with student fixed effects that addresses numerous limitations in prior research. The addition of student fixed effects allows us to isolate variation within students, while holding unobserved between-student differences constant in our model. Given that unobserved variation between families is the most plausible source of confounding, we believe that our model provides much a stronger and appropriate design for making causal inferences regarding ECA participation.
Our second research question addresses the timing of exposure to ECA participation. Do students benefit similarly from ECA participation during elementary and middle school, or are the effects of ECA participation limited to certain periods of childhood and early adolescence? Life course theory (Elder, Johnson, and Crosnoe 2003) emphasizes that developmental factors often shape how life experiences matter for outcomes, and we suspect that this is true for ECA participation, given that the level of commitment, the physical, cognitive, socioemotional demands, and overall engagement in ECAs increase with age.
To address these questions, we construct a multiwave panel model that overcomes several limitations of the two-wave CLPM (presented in Figure 2). As noted above, the cross-lagged panel design is powerful but remains vulnerable to unobserved variables that may affect both the treatment (ECA participation) and the outcomes (academic ability and socioemotional skills), net of the lagged controls. To control for these unobserved factors, a student-level fixed effect can be added to the CLPM. The addition of student fixed effects to the model removes all between-person variation from the estimates and thereby eliminates the effect of both observed and unobserved time-invariant confounders from our estimate of the effect of ECA participation on student outcomes at each time point. Another advantage of the CLPM is that equality constraints can be imposed or relaxed across time. Thus, our treatment, ECA participation, can have varying effects on the outcomes over time. Another major advantage of using SEM is that we can adjust for measurement error in our analysis, which can lead to attenuation bias and contribute to confounding bias when estimating causal effects (Wooldridge 2016). Finally, we can examine the causal ordering of our key variables by including t – 1 lags to the model to eliminate the threat of reciprocal causation and time-varying confounding in our model.
Data
We analyze data from ECLS-K:98, a nationally representative sample of 21,260 children who entered kindergarten in the fall of 1998. Data collection occurred in seven separate waves: fall and spring of kindergarten, fall and spring of first grade, and spring of third, fifth, and eighth grades. The data includes measures of cognitive ability and socioemotional skills, teacher and parent reports of child behavior and achievement, demographic information, and school characteristics (National Center for Education Statistics 2009). Our analyses include variables from six of the seven survey waves; only wave 3 (data collected in the fall of first grade) is excluded from our analysis, because it does not contain information about ECAs. Descriptive statistics for all variables used in our analyses are presented in Table 1.
Descriptive Statistics for Variables Used in the Analyses, by Survey Wave.
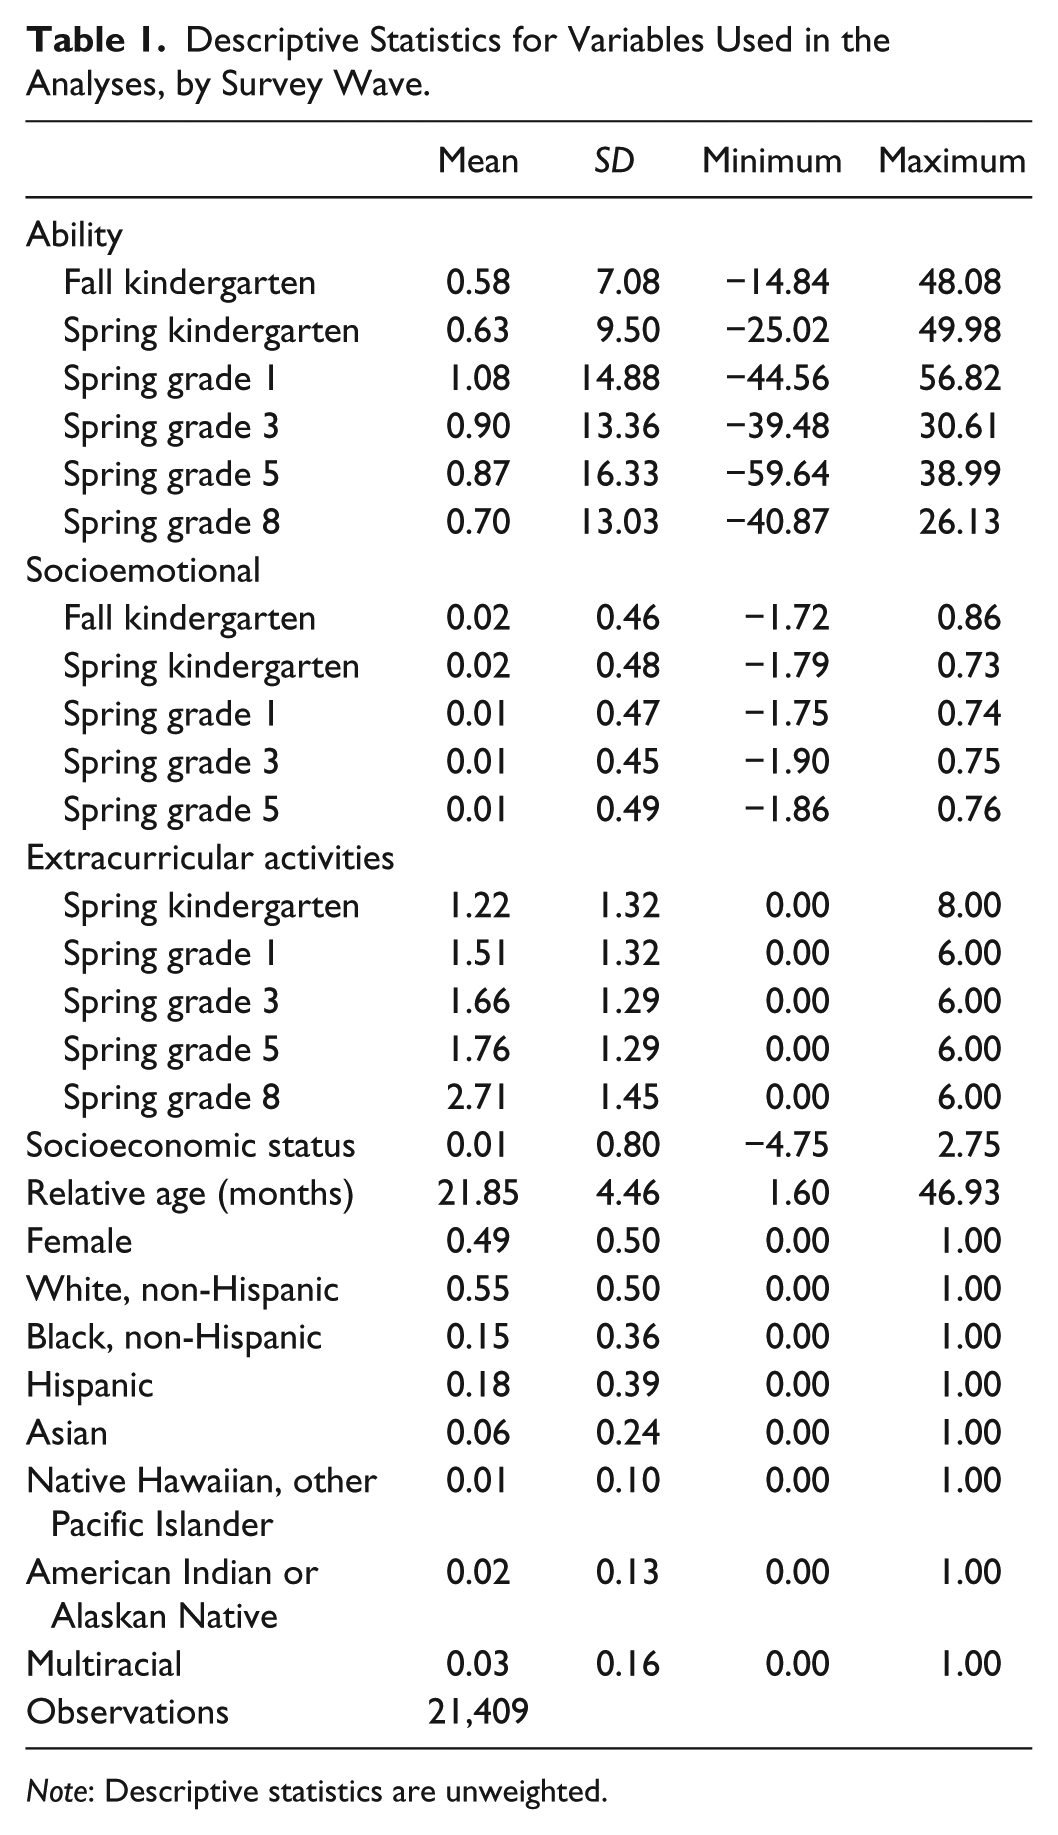
Note: Descriptive statistics are unweighted.
The ECLS-K:98 data set is well suited to answer our research questions because it has multiple measures of extracurricular participation, academic ability, and socioemotional skills, which are the main focus of our study. The longitudinal design of the data set provides multiple waves of data that allow us to use time ordering to build models that eliminate numerous threats to internal validity (such as selection bias and reverse causality) (Holland and Andre 1987; Marsh and Kleitman 2002).
Additionally, these data measure children’s experiences, behaviors, and abilities in early childhood, predominantly in elementary school. Most of the previous research has centered on adolescent participation and outcomes later in life, including college attendance and even workforce outcomes (Gardner et al. 2008; Morris 2016). Although this research is important, the relative scarcity of studies of ECA participation in elementary and middle school is a notable omission in the literature because later ECA participation in adolescence is predicted by early ECA participation (McNeal 1998). Additionally, early childhood is a time of significant cognitive and socioemotional growth, so ECA participation in elementary school could have substantively important effects on these outcomes that translate into later achievement gains. Furthermore, as research has shown, educational inequality begins early (Downey 2001; Entwisle, Alexander, and Olson 1997), so this data set permits us to assess the effect of extracurricular participation on achievement when they begin participation in these activities. By focusing on early childhood participation, we are likely identifying the initial effects of participation on achievement and socioemotional development.
Dependent Variables
The two dependent variables in our analyses are academic ability and socioemotional skills. Although ECLS-K:98 includes measurement of academic achievement at every survey wave, socioemotional skills are not measured in the third wave (fall of first grade) or the final wave (spring of eighth grade) of the panel. Although prior research has focused on separate skill domains (e.g., reading, math), we do not have a theoretical expectation regarding why ECA participation would differentially affect skills in one subject area relative to another. Thus, we decided to create a latent factor of “academic ability” that includes reading and math item response theory scores at each survey wave. To further adjust for possible measurement error in student tests in each subject, we also included teacher reports of students’ academic ability in each subject area in each survey wave. Student’s “general knowledge” scores are included in the waves where they are available (waves 1, 2, and 4).
The results of our confirmatory factor analyses (CFAs) at each wave are presented in Table 2. The table shows that the factor loadings for our predictors are in the expected direction (positive) and statistically significant at each survey wave. In addition, the measures of model fit are satisfactory at each wave, with a root mean square error of approximation (RMSEA) of less than .06 and Tucker-Lewis index (TLI) and confirmatory fit index (CFI) greater than .90. Finally, we should note that models that examined math and readings scores separately yielded largely the same results. Although the model fit for waves 5, 6, and 7 does not quite meet typical standards, there is some evidence that in models with a small degree of freedom such as these, the RMSEA can falsely indicate a poorly fitting model (Kenny, Kaniskan, and McCoach 2015:486).
Coefficients from Measurement Model for Ability, Wave 1 through Wave 7.

Note: Values in parentheses are t statistics. CFI = confirmatory fit index; IRT = item response theory; RMSEA = root mean square error of approximation; TLI = Tucker-Lewis index.
p < .001.
There are many different measures of “socioemotional skills” available in the ECLS-K:98 data set. For most of the waves in ECLS-K:98, teachers were asked to report each student’s classroom behavior on a social rating scale, from which several measures were drawn, including approaches to learning, self-control, interpersonal behavior, externalizing problem behaviors, and internalizing problem behaviors (National Center for Education Statistics 2009). These items are all measured on a scale ranging from 1 to 4, and each captures a different aspect of socioemotional skills that are often deemed helpful for success in the classroom via the “hidden curriculum” (Covay and Carbonaro 2010; Farkas 2003). Some scholars have analyzed these measures as separate variables in their analyses (Duncan et al. 2007; Morgan et al. 2009), while others have created composite variables that combine multiple measures into one or more scales (e.g., DiPrete and Jennings 2012). We argue that that participation in ECAs is related to multiple dimensions of children’s socioemotional skills, because most ECAs foster the development of attention skills, teamwork, and self-control. Thus, we decided to treat socioemotional skills as an unobserved latent factor that affects numerous different observable behavioral and affective dimensions.
Accordingly, we performed some preliminary principal-component factor analyses on the five measures of socioemotional skills in ECLS-K:98 and found that four of the five items loaded highly on a single factor. (“Internalizing problem behaviors” loaded poorly on the factor and was therefore omitted.) We used SEM to fit a CFA model with four remaining teacher-reported measures at each time point. The results for the models that we fit are presented in Table 3. As Table 3 shows, the CFA models at each wave surpass the thresholds for indices of model fit (below or around .06 for the RMSEA and above .90 for the CFI and TLI).
Coefficients from Measurement Model for Socioemotional Skills, Wave 1 through Wave 6.
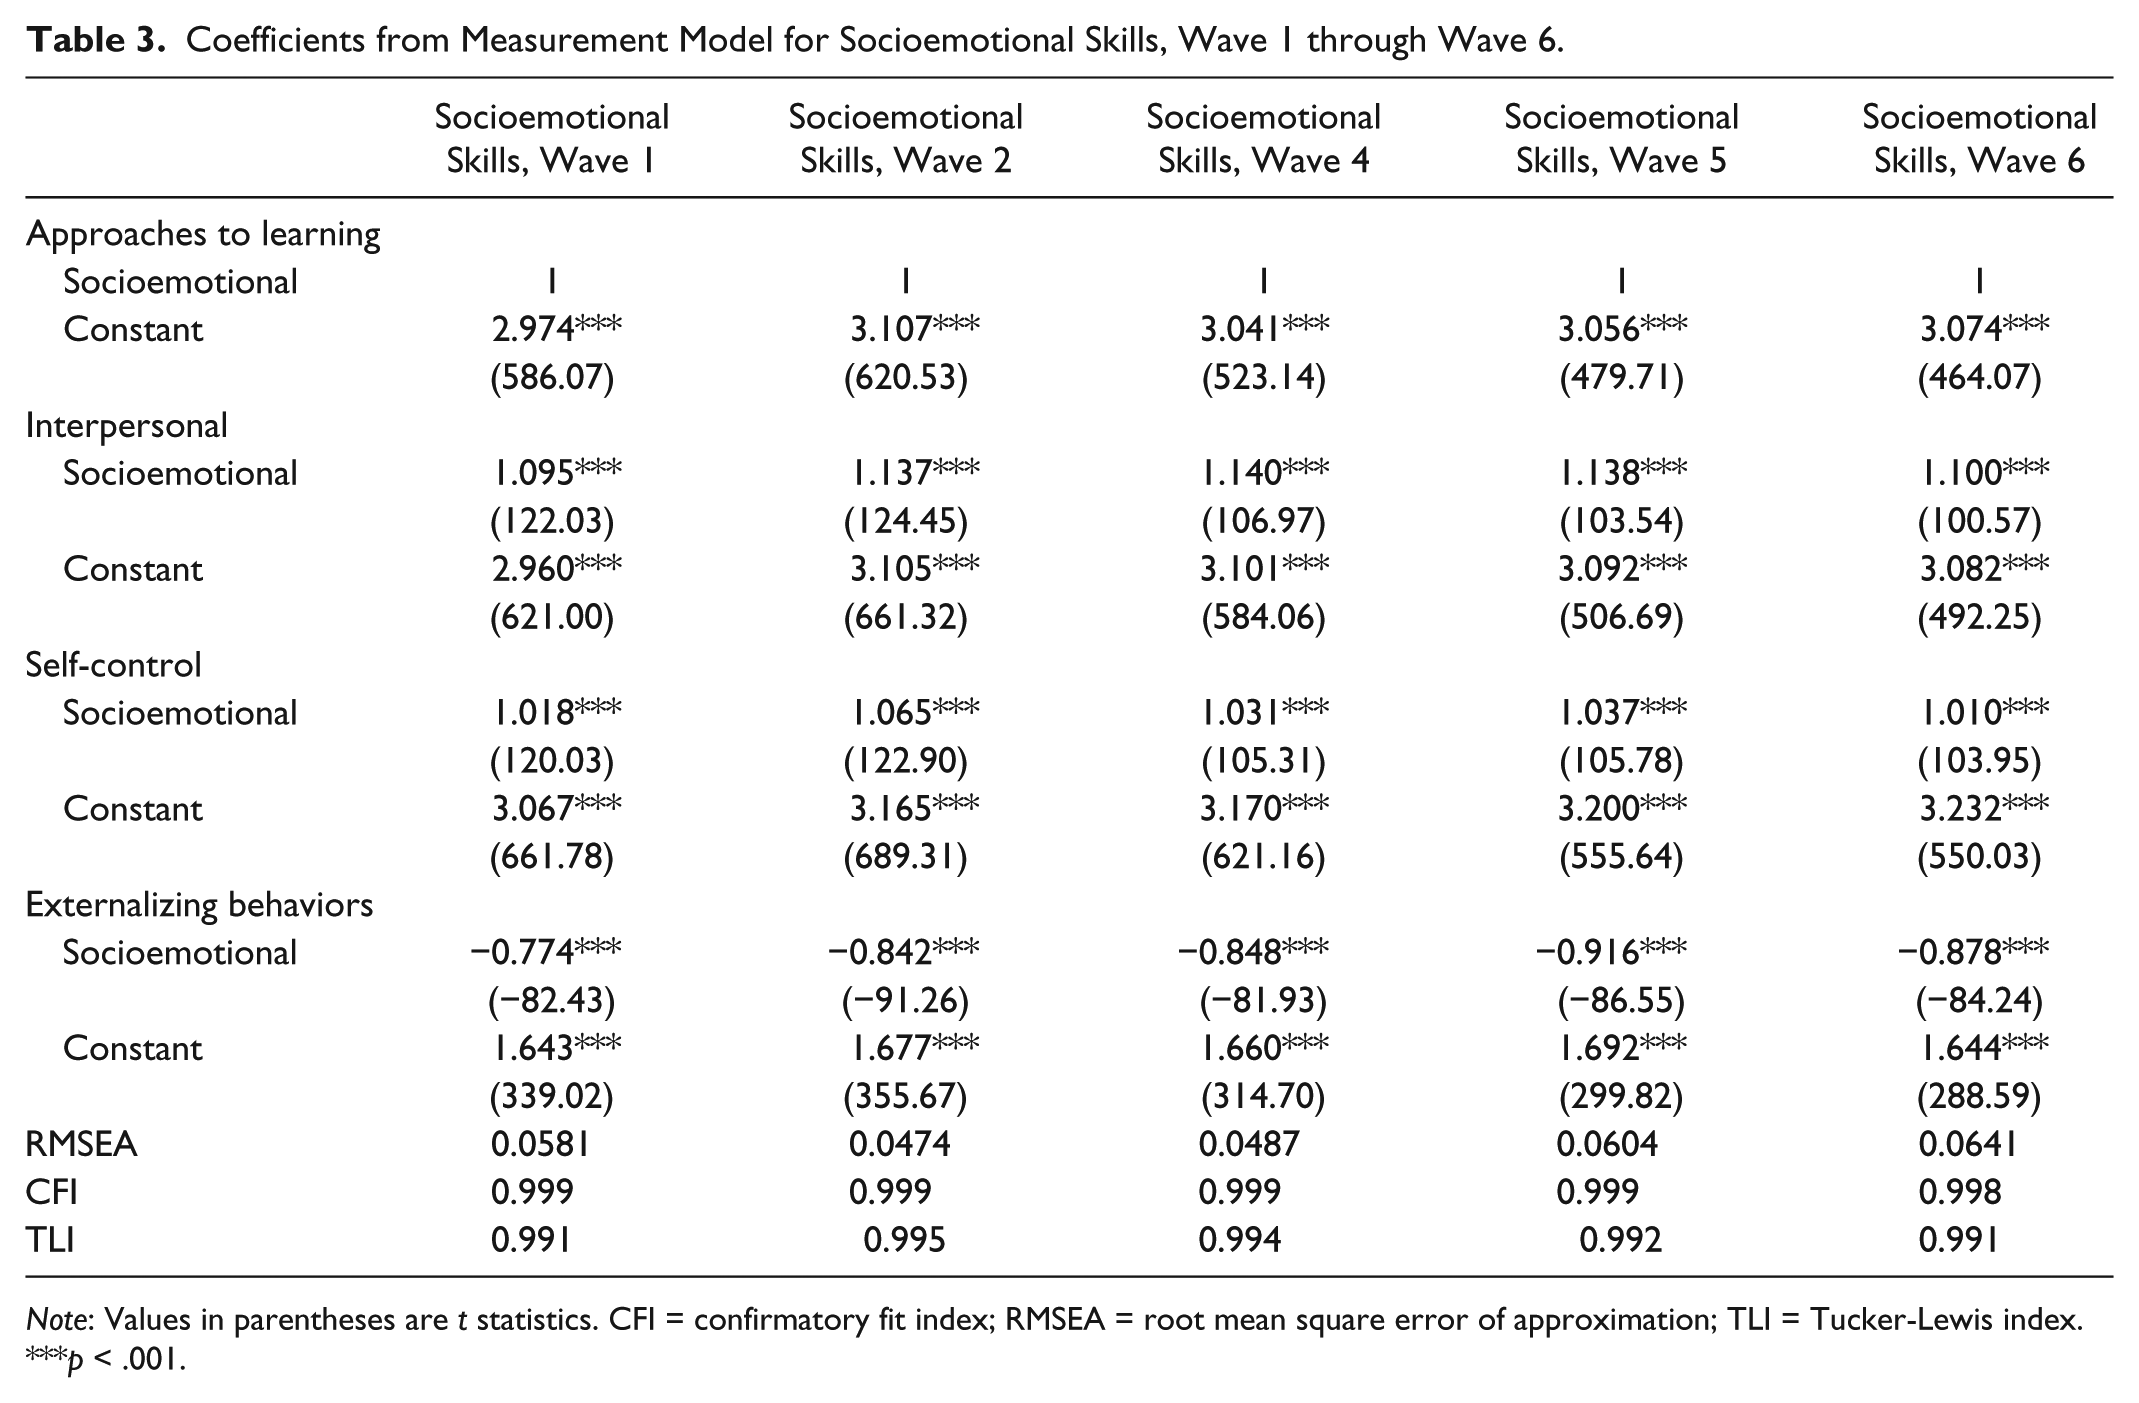
Note: Values in parentheses are t statistics. CFI = confirmatory fit index; RMSEA = root mean square error of approximation; TLI = Tucker-Lewis index.
p < .001.
The latent measures of academic ability and socioemotional skills we estimated bring two main advantages to our analyses. First, the composite measures of academic ability and socioemotional skills have greater measurement validity because they represent multiple dimensions of the underlying constructs. Second, our CFA models can be directly incorporated in the structural equation models that we estimate. In doing so, we are able to account for random measurement error associated with each construct in our analysis. This is an important component of our strategy to estimate causal effects because random measurement error among covariates can lead to attenuation bias (for the error-prone variable) and confounding bias (due to poorly measured controls) when estimating regression parameters (Wooldridge 2016). This is an underappreciated limitation of models that rely on lagged variables as controls: lagged variables that have measurement error will not fully account for relationships with confounding variables, which can lead to biased estimates of explanatory variables.
Independent Variables
The main explanatory variable of interest in our study is participation in ECAs. At waves 2, 4, 5, and 6, parents were asked about their children’s participation in a number of out-of-school activities. In each of these waves, parents were asked to report whether their children participated in each of the following six activities: dance lessons, athletic events, organized clubs, music lessons, art lessons, and performing arts. At wave 2, parents were also asked if their children had participated in seventh and eighth activities: drama classes and crafts classes. The response categories for all of these items were dichotomous (did not participate vs. did participate).
In wave 7 (spring of eighth grade), students rather than parents reported on their extracurricular participation. The questions and response categories were different from those used on the parent questionnaire from previous waves. For the school-sponsored activities (sports, drama or music, and clubs), students were asked, “Have you participated in the following school-sponsored activities this school year?” and the response categories were “did not participate,” “participated,” and “participated as an officer, leader, or captain” (National Center for Education Statistics 2009). For arts classes, nonschool sports, and nonschool organized activity, the question was formatted, “How often do you spend time . . .,” and the answer choices were “rarely or never,” “less than once a week,” “once or twice a week,” and “every day or almost every day” (National Center for Education Statistics 2009).
ECA participation has been operationalized in numerous different ways in past research. Some studies have focused on the intensity of ECA participation by measuring the amount of time (e.g., hours per week) students spend engaging in ECAs (Fredricks 2012; Fredricks and Eccles 2005; Gardner and Brooks-Gunn 2008; Morris 2015). Other studies have focused on the breadth of ECA participation, by measuring the number of different activities in which students engage (Dumais 2006; Fredricks and Eccles 2010; Marsh and Kleitman 2002). Finally, some scholars have used separate indicators of specific activities (e.g., sports, arts, academic clubs) to examine whether different activities have different effects on student outcomes (Broh 2002; Covay and Carbonaro 2010; Eccles et al. 2003; Fredricks and Eccles 2006, 2010; Larsen et al. 2006).
The items in the ECLS-K:98 data largely allow measures of the breadth of ECA participation, as well as the use of separate indicators of participation in different activities, at each survey wave. The dichotomous response categories for the parent-reported ECA items do not indicate the intensity of participation by students. We experimented with a measure of breadth of ECA participation (described below), as well as separate indicators of different activities in our models. Although prior research has suggested that certain activities have larger associations with student outcomes than others (e.g., Eccles and Barber 1999), our preliminary analyses did not find consistent differences among activities across survey waves. The only noticeable trend was that clubs, sports, and performing arts occasionally had positive effects on cognitive scores (in “t – 1” lagged models), but not reliably across waves. Ultimately, we decided to use the simpler additive measure that captures the breadth of extracurricular participation by students at each survey wave. 1
To create our measure of ECA participation, we added the dichotomous items for each activity at each survey wave into a scale. As noted above, there are two additional items of ECA participation at wave 2 ranging from 0 (no activity) to 8 (participates in every activity listed above). For waves 4, 5, and 6, the variable for ECA participation ranges only from 0 to 6. For the student-reported items in wave 7, we recoded these variables so that they resembled the responses from the parent-reported items as closely as possible. The three-category in-school items (described) were recoded such that 0 corresponded to “did not participate” and 1 was both “participated” and “participated as an officer, leader, or captain.” In a similar fashion, the three nonschool activities were recoded such that 0 corresponded to “rarely or never” and 1 to the other three responses. Thus, the final ECA participation measure for wave 7 ranges from 0 to 6, indicating the number of activities the student participated in during the spring of eighth grade. The average number of ECAs a child participated in between kindergarten and fifth grade ranged from 1.22 to 1.76, with incremental increases between each wave. At eighth grade, this number jumps to 2.71, likely because middle school has more opportunities for extracurricular involvement and because the questions were asked differently than in preceding waves, as discussed previously.
We used a linear specification of ECA participation in our models, but we also conducted some preliminary analyses to test for nonlinearity, with a specific focus on whether there was a threshold effect of at least one activity versus no activities (e.g., Marsh and Kleitman 2002). Using indicator variables to allow a nonparametric specification of ECA participation, we found that ECA participation was largely linear in its association with academic ability and socioemotional skills.
Control Variables
In preliminary ordinary least squares (OLS) analyses of the relationship between ECA participation and cognitive and noncognitive outcomes (reported below), control variables were included in the regressions to account for possible confounding. The demographic variables included SES, race, gender, and age. Each of these variables were selected as controls, based on findings from previous research.
Methods
The main goal of our analysis is to test whether participation in ECAs causally affects academic ability and socioemotional skills. We present three types of analyses to estimate the ECA effect on our outcomes: (1) OLS regression models, (2) student fixed-effects models, and (3) a CLPM with student fixed effects added. The OLS and student fixed-effects models each have key weaknesses that are addressed by the CLPM that we describe below.
The most common model in the literature on ECA participation (aside from cross-sectional analyses) is an OLS regression with controls variables and a t – 1 lagged dependent variable (and sometimes a cross lag) added. Below, we present the model that predicts academic ability in wave 2 (AAt=2,i):

The subscript t denotes time (or survey wave), and i denotes individuals, in this case students. Predictors include a lagged measure of academic ability (AAt=1,i), as well as a “cross-lagged” measure of socioemotional skills (SSt=1,i), and a vector of student-level characteristics (
To overcome this limitation, we present a student fixed-effects model, which pools the survey waves into one model. It is specified by the following equation predicting academic ability:

where AAti is a time-varying measure of a student’s academic ability, which is predicted by time-varying measures of socioemotional skills (SSti) and ECA participation (ECAti). (The model predicting socioemotional skills is the same, except that AA and SS switch places.) The strength of the fixed-effects design is that it includes α i , which represents a student-level constant that captures unobserved time-invariant differences between students that might confound the relationship between ECA and the outcome. The fixed-effects model provides a powerful design that, to our knowledge, has not been used to estimate ECA effects on student outcomes. However, the main limitation of the fixed-effects model is that unobserved time-varying confounders threaten inferences about causality.
To overcome the limitations of the OLS and FE models, we build on the two-wave cross-lagged model (presented in Figure 2) and construct a multiwave panel model. In Figure 3, we present a simplified version of our CLPM. We follow the conventions of SEM diagrams, whereby ovals represent latent variables and rectangles represent observed variables. In addition, single-headed arrows indicate effects represented by slopes, whereas double-headed arrows represent covariances between variables. To simplify the presentation, we omit the error terms for latent and observed variables in the figure, but they are included in the model that we estimate. We also omitted the observed variables that are predicted by each latent variable (academic ability and socioemotional skills measured at each wave) from the figure.

Representation of the Cross-Lagged Panel Model (without Student Fixed Effects) Estimated for Table 6.
The CLPM includes three exogenous variables, which are shown on the left-hand side of the model: baseline scores for academic ability, socioemotional skills, and ECA participation, all of which are allowed to covary in the model. As the figure shows, academic ability and socioemotional skills are predicted by contemporaneous ECA participation at each time point, as well the t – 1 lag and the t – 1 crossed lag. Following are the equations for the academic ability and socioemotional skills models, which are estimated at each wave (t) (starting at wave 2) 2 :


We estimate the contemporaneous effect of ECA on the academic ability and socioemotional skills outcomes at each wave because the ECA indicators are reported retrospectively by respondents relative the current school year (“In the past school year, has . . .?”). The ECA effects are specified as contemporaneous (rather than lagged) for two reasons. First, ECA participation occurs during the school year, whereas the measures of academic ability and socioemotional skills are reported at the end of the year. It is unreasonable to expect a lagged effect of ECA participation across waves (e.g., first grade participation to affect third grade test scores). Second, we can safely assume that neither students’ academic abilities nor socioemotional skills cause contemporaneous ECA participation, thereby eliminating the need to account for reverse causality with a lagged measure of ECA.
ECA participation is predicted by the t – 1 lag of ECA and the t – 1 crossed lags of academic ability and socioemotional skills at each time point, which is displayed in equation 5:
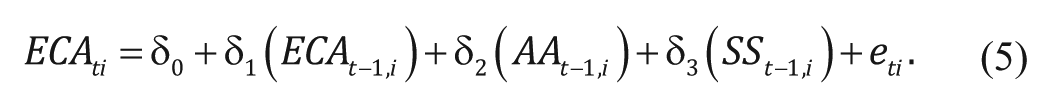
This regression allows us to estimate the selection effects into ECA on the basis of prior academic ability and socioemotional skills.
As noted above, the cross-lagged panel design is powerful because it allows lags and cross-lags to address possible time-varying confounding at each survey wave. However, it is still vulnerable to unobserved variables that may affect both the treatment (ECA participation) and the outcomes (academic ability and socioemotional skills), net of the lagged controls. To control for these unobserved factors, a student-level fixed effect can be added as a latent construct to the CLPM. We can make equations 3 through 5 fixed-effects models by adding α i , which represents a student-specific effect, to each one. The addition of a student fixed effect to the model removes all between-person variation from the estimates and thereby eliminates the effect of both observed and unobserved time invariant confounders from our estimate of the ECA effect on student outcomes at each time point. We do not include student fixed effects to Figure 3, to retain some simplicity in our presentation. However, the CLPM with student fixed effects adds a latent variable (α) which has single-headed arrows drawn to each endogenous variable in Figure 3, along with double-headed arrows that connect to the exogenous variables. Thus, if α were drawn in the figure, it would appear as an unobserved factor that shapes each variable in the figure, which is equivalent to a student fixed effect.
One major advantage of the CLPM is that equality constraints (i.e., fixing slopes in the model to be equal) can be imposed so that a given variable can have the same effect across time. Unconstrained coefficients allow the effects of a variable to be relaxed (and thereby vary) across time. Thus, SEM allows our treatment, ECA participation, to have varying effects on the outcomes over time, which allows us to examine an important substantive question regarding whether ECA effects vary at different grade levels in our sample. We can formally test whether the model fit is worsened when the coefficients for ECA participation are constrained to be equal across time points.
There are many possible equality constraints that could be imposed in the model. The final models we present in this article do not impose equality constraints at the level of measurement (CFA) or other structural relationships within the model, because these constraints worsened the fit of the model. As recommended, we included covariances among the error terms for variables that are repeatedly measured at different waves for our measurement models (Little 2013). For example, the residual for the math score variable within the academic ability factor at wave 1 was allowed to covary with residuals for the math scores in the academic ability factors at later survey waves. We included these correlated errors for each variable within our measurement models across waves, which contributed to improved model fit.
Finally, one major advantage of SEM is the ability to use full information maximum likelihood (FIML) to estimate model parameters on the basis of missing data. FIML relies on the assumption that the data are missing at random. If this assumption is met, FIML will produce estimates that are both efficient and unbiased (Allison 2001).
Results
OLS Models with Lags
We begin with OLS regression models for each wave, which are presented in Table 4. Each model includes control variables, along with a t – 1 lag of the dependent variable and a t – 1 cross-lag (e.g., t – 1 socioemotional skills on academic ability and vice versa). For the analyses in Table 4, our dependent variables are the CFA measurement models for academic ability and socioemotional skills at each wave. These analyses were estimated using SEM to use FIML to handle missing data, which is the strategy used in the later fixed-effects models and CLPMs. Because the scaling for the CFAs of academic ability and socioemotional skills are arbitrary, we present standardized coefficients in our tables.
Ordinary Least Squares Regression of Academic Ability and Socioemotional Skills on ECAs and Other Control Variables.

Note: All coefficients are standardized, and standard errors are presented in parentheses. Coefficients for other covariates in each model are omitted from the table. Control variables include socioeconomic status, race/ethnicity, gender, and relative age (in days). Each model also includes a t – 1 lagged measure of academic ability and socioemotional skills. ECA = extracurricular activity.
p < .01. ***p < .001.
The first column (model 4.1) includes the models predicting academic ability at each wave. For wave 2 (end of kindergarten), participation is not significantly related to academic ability. However, there is a positive, statistically significant relationship between ECA participation and academic ability, and the relationship grows stronger in later survey waves. In wave 4, one additional ECA increases academic ability by .020 standard deviations, but for wave 7 (eighth grade), the relationship grows to .028 standard deviations. This significant positive association between ECA participation and achievement is consistent with prior studies that use lagged OLS models (e.g., Broh 2002; Covay and Carbonaro 2010; Im et al. 2016).
The second column (model 4.2) shows the ECA coefficients predicting socioemotional skills in each wave. Wave five (third grade) is the only one with a significant ECA coefficient: an increase of one ECA is associated with a 0.023 standard deviation increase in socioemotional skills. The other waves show positive but small and statistically insignificant associations between ECA and socioemotional skills.
Fixed-effects Models
One weakness of the OLS models presented in Table 4 is that unobserved differences between students may create biased estimates of ECA effects on academic ability and socioemotional skills. One approach for addressing this threat to internal validity is to eliminate variation that resides between students and focus solely on explaining change within students. Thus, we estimate student fixed-effects models that examine whether change in ECA participation across time points in the panel is associated with change in the outcome measures. The student fixed effect act as a person-level constant that accounts of all unobserved differences between students in the analysis and is a stronger design for making causal inferences than the OLS models presented in Table 4.
Although a fixed-effects model is typically estimated using a pooled OLS regression with “time-demeaned” data, we present an equivalent fixed-effects model that is estimated in a SEM framework. 3 SEM provides a few important advantages in this context. First, we can use measurement models to estimate academic ability and socioemotional skills as latent variables, thereby correcting for random measurement error. Second, we can use FIML to account for missing data with the sample. Finally, and most important, we can compare the fixed-effects models to the CLPMs that follow, to examine whether the CLPM (which imposes fewer constraints) is a better fitting model than the simpler fixed effects (which imposes more constraints). 4
The results of our fixed-effects model are presented in Table 5. Model 5.1 examines the effect of ECA participation and socioemotional skills on academic ability. Once again, for the sake of comparability with other analyses, we present standardized coefficients. ECA participation has a positive and statistically significant effect (0.027) on academic ability. As expected, the coefficient for socioemotional skills is also positive and significant. Thus, when students experience an increase in their ECA participation by 1 standard deviation, their academic ability increases by 0.027 standard deviations. However, for model 5.2, a change in a student’s level of ECA participation is not associated with any change in his or her socioemotional skills.
Fixed-Effect Panel Models Predicting Academic Ability and Socioemotional Skills by ECA Participation.
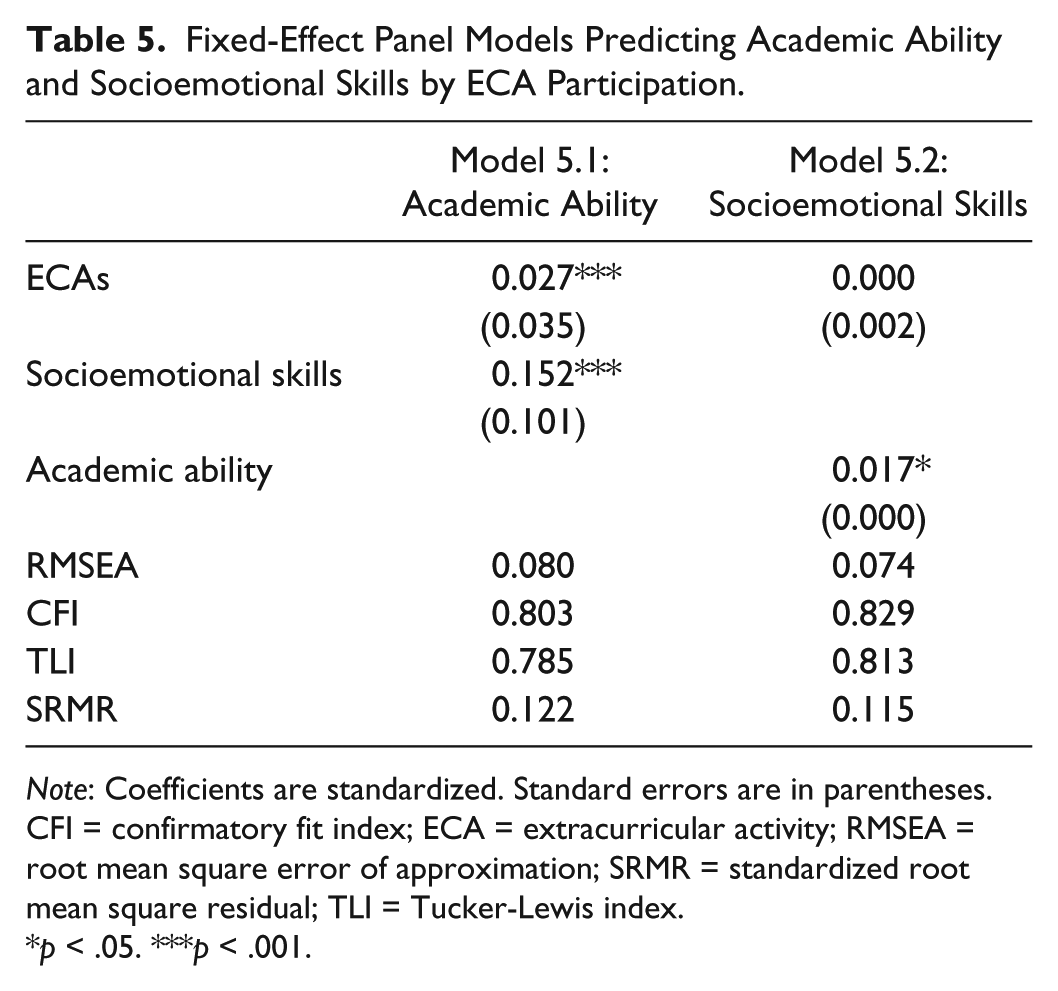
Note: Coefficients are standardized. Standard errors are in parentheses. CFI = confirmatory fit index; ECA = extracurricular activity; RMSEA = root mean square error of approximation; SRMR = standardized root mean square residual; TLI = Tucker-Lewis index.
p < .05. ***p < .001.
The results of our fixed-effects models provide compelling evidence that ECA participation increases academic ability but does not change students’ socioemotional skills because, unlike our OLS models, student fixed effects control for all unobserved differences between students and thereby address the problem of selection bias. However, this model still has some shortcomings. First, the fit statistics (included at the bottom of the table) for models 5.1 and 5.2 indicate that neither model fits the observed data very well: the RMSEA for the models is right at the borderline of acceptable fit (0.08), but the CFI and TLI are not close to commonly accepted thresholds for these statistics (0.90) (Little 2013). The poor fit of the model reflects the fact that we have imposed too many constraints in the model. Second, the ECA effect is assumed to be constant across time in our fixed-effects model, and the question of time-varying effects is key to our model. Finally, the fixed-effects model controls for unobserved confounders between students, but bias may still emerge because of omitted time-varying confounders. Fortunately, CLPMs estimated in an SEM framework allow us to address all of these limitations.
CLPMs
In the final set of analyses, we use a more robust strategy, a CLPM, to test whether ECA participation is causally related to academic ability and socioemotional skills among students. We estimated two models: model 6.1, which does not include a student fixed effect, and model 6.2, which adds a student fixed effect. We argue that model 6.2, with a student fixed effect added, offers the best strategy for identifying the causal effect of ECA on student outcomes. The crossed lagged design allows us to overcome the limitations of the conventional fixed-effects model: it allows us to (1) relax constraints imposed in the fixed-effects model to improve the model fit to acceptable levels, (2) include time-varying effects of ECA participation, and (3) adjust for possible time-varying confounding in the model by including lags and crossed-lags across survey waves.
The results from the CLPM (without fixed effects) are reported as model 6.1 in Table 6. The values in boldface type in the top section of the table show the effects of ECA participation on the two outcomes at each wave. To clarify the presentation of the results in Table 6, we describe the coefficients in the top row, left-hand side of the table. The first column shows the lagged effect of ECAs at wave 2 on itself (0.598) at wave 4 (indicated by “t + 1”). The coefficients of 0.012 and 0.021 in the top row represent the contemporaneous effect of ECA participation on academic ability and socioemotional skills (respectively) at the end of kindergarten (wave 2). Thus, academic ability and socioemotional skills increase by 0.012 and 0.021 standard deviations, respectively, for each standard deviation increase in ECA.
CLPMs Predicting Academic Ability and Socioemotional Skills by ECA Participation.

Note: Coefficients are standardized. Standard errors are in parentheses. Values in boldface type in the top section of the table show the effects of ECA participation on the two outcomes at each wave. N = 21,321. AA = academic ability; CFI = confirmatory fit index; CLPM = cross-lagged panel model; ECA = extracurricular activity; RMSEA = root mean square error of approximation; SRMR = standardized root mean square residual; SS = socioemotional skills; TLI = Tucker-Lewis index.
p < .05. **p < .01. ***p < .001.
ECA participation has consistently positive significant effects on academic ability at each wave (other than wave 4). The magnitude of the coefficients is smaller than those presented in the OLS models in Table 4 (which include a lag and cross-lag), particularly at later waves. Interestingly, the coefficients are also smaller at each time point than the ECA effect from our fixed-effects model (model 5.1) in Table 5. For socioemotional skills, ECA participation also has effects that are positive and significant, unlike our findings from our OLS and fixed-effects models (models 4.2 and 5.2). Generally, the lags and crossed lags in the model (presented in the middle section of the table) are robust and in the expected direction across survey waves. Fit statistics for model 6.1 are presented at the very bottom of Table 6, and they all meet generally accepted thresholds, which indicates that our model has acceptable fit relative to the fully saturated model.
Model 6.2 is a CLPM with a crucial addition: a latent variable that represents a student fixed effect is included in the model. This latent variable is allowed to affect ECA, academic ability, and socioemotional skills at each time point, which thereby eliminates between-person differences that might affect these covariates in the model. Thus, model 6.2 is well designed for making causal inferences because of the combination of time-ordered data (the cross-lagged structure) and person-level fixed effects.
The coefficients for model 6.2 are presented in Table 6. Overall, ECA has positive and significant effects on academic ability in later survey waves (5, 6, and 7; i.e., grades 3, 5, and 8), and the effects are only slightly smaller than model 6.1 (which does not include a fixed effect). As the OLS models suggest, the largest effect is observed for the final survey wave (0.028). Thus, model 6.2 indicates that the relationship between ECA participation and academic ability is causal, but only as children grow older.
Interestingly, ECA has significant effects on socioemotional skills, but the effects have become negative in model 6.2. This surprising finding suggests that increased ECA participation actually worsens students’ socioemotional skills in the classroom. Table 6 also shows the fit statistics for model 6.2, and there is little improvement from model 6.1. The similarity of the fit statistics for the two models suggests that the CLPM without fixed effects fits the data about as well as the model when a fixed effect is included.
Models 6.1 and 6.2 suggest that the ECA effects vary across time. To formally test this conclusion, we estimated comparable models that constrain the ECA effects on each outcome to be the same across survey waves. We then performed a χ2 test to determine whether the equality constraints worsened the model fit. For both models, we found that constraining the ECA effects across time worsened the model fit, which indicates that models 6.1 and 6.2 are preferable. Thus, we conclude that ECA effects vary in magnitude over the course of students’ academic careers.
Discussion
Many prior studies have concluded that ECA participation is associated with better school performance and improved social skills. Our analyses focused on two key questions about ECA participation on student outcomes: (1) Are the well-established relationships between ECA participation and cognitive and socioemotional skills causal? and (2) Does ECA participation have varying effects as students progress through school? Unlike most prior research in this area, we analyze panel data with multiple time points to construct a model that is well suited for making causal inferences. In addition, our analyses address the problem of measurement error. Overall, these methodological improvements to prior research produce findings that are only partially supportive of conclusions from prior research. We see this as a major contribution of our work: although most research in this area is cross-sectional, the more rigorous design of OLS regression with lagged variables produces upwardly biased estimates of ECA effects on student outcomes. Thus, we argue that claims of causal effects in past research on ECA participation should be treated with some skepticism.
Like other studies (e.g., Covay and Carbonaro 2010), we find that ECA participation has a positive, albeit modest, effect on academic ability. However, we find that the ECA effect is only significant for students in later grades (third grade and later), which suggests that the timing of the exposure to ECA matters, in terms of the expected gains in achievement. It is important to resist the temptation to extrapolate from our findings to the experiences of young people attending secondary school. Although eighth grade students experience the largest (albeit still modest) effects of ECA participation on academic outcomes, it is unclear whether secondary school students experience similar or perhaps even larger effects. In secondary school, most ECAs are fully aligned with and contained within the school context, which makes them fundamentally different in character than the out-of-school activities that constitute the bulk of ECAs for younger children. (Recall that our measures of ECA participation capture out-of-school activities until the last wave, when students are asked about in-school activities.) In addition, secondary school students typically are more committed to ECAs, in terms of the time spent within them, their identity, and their peer relations. Thus, more research with different data is needed to address the question of ECA effects in secondary school.
Our findings do not support the claim that ECA participation improves socioemotional skills, as other studies suggest. Indeed, none of the various models that we estimated showed strong support for this relationship, and our final model even suggests that the relationship is negative. How can we explain this somewhat surprising finding? One possibility is that our measure of socioemotional skills differs from those used in other studies. Other studies that have analyzed other data sets have used different measures (see Mahoney et al. 2003 for a review), and that may account for the disparity. Covay and Carbonaro (2010) analyzed ECLS-K:98 but used “approaches to learning” as their only observed measure of socioemotional skills. It is possible that our multidimensional measure includes certain skill domains that are either unaffected by or are negatively affected by ECA participation, although it should be noted that “approaches to learning” was the most heavily weighted indicator in our measurement models (see Table 3).
Another possibility is that the effects of ECA participation are domain specific and do not spill over into other contexts. It is important to emphasize that our measures of socioemotional skills are measured in the classroom, and not the ECA itself. Thus, it may be that attributes such as self-control and interpersonal skills are developed in ECAs (as predicted), but these improvements do not positively affect students’ behaviors and habits within the classroom context. Rather, it could be that the behaviors that are observed and reported by teachers are influenced by local classroom conditions (e.g., teacher characteristics, classroom conditions, and peer attributes). This explanation is consistent with a body of evidence that suggests young people are especially sensitive to contextual clues about behavior, rather than displaying fixed behavioral patterns across contexts (e.g., Harris 2006). Because we do not have direct measures of student behaviors within ECAs, we cannot directly test this explanation. Perhaps future research could explore this question.
One final question is raised by our findings. Numerous authors argue that ECA participation affects achievement outcomes through the improvement of socioemotional skills (Covay and Carbonaro 2010; Morris 2015). Our findings are not consistent with the causal chain underlying this argument, because we do not find support for ECA effects on socioemotional skills. This raises the question: if ECA does not raise academic ability through improved socioemotional skills, what mechanism accounts for this effect? The strongest predictor of academic ability is exposure to direct instruction (Hassrick, Raudenbush, and Rosen 2017). Given that, it is not surprising that the effects of ECA on academic ability are quite small. The most likely explanation is that ECAs work through other proposed mechanisms, such as teacher expectations, educational expectations, and peer relations in the classroom (e.g., Fredericks and Eccles 2005; Mahoney et al. 2003; Morris 2015). Future research can explore these possible mechanisms of ECA effects.
Our findings are relevant to larger debates about educational inequality. Although some authors argue convincingly that ECA participation is a source of class advantage (e.g., Dumais 2006; Lareau 2011), our findings suggest that the benefits of ECA participation are, at best, modest. It is important to emphasize that our analysis focuses largely on out-of-school ECAs, which presumably would be the most unequally distributed on the basis of family income (given their cost). Thus, our findings suggest that the modest and time-varying effects of ECA participation on student outcomes are a relatively minor source of class advantage in schooling.
We conclude with a few thoughts about the limitations of our work, and implications for future research. First, the ECA items in ECLS-K:98 do not capture the variation in the frequency of participation. Respondents who participated in sporting events once a week are counted the same as others who are on competitive teams that practice multiple times per week. It is likely that ECA “intensity” matters for student outcomes, and future research should examine that question. In addition, prior research suggests that different ECAs (e.g., sports, arts) might have differing effects, but our analyses only estimate an “average” ECA effect across these different domains. Our preliminary analyses did not suggest clear patterns by type of ECA, but future studies might examine these differences more precisely. Finally, some studies (e.g., Covay and Carbonaro 2010) indicate that nonwhite and low-SES students experience differential effects of ECA participation. This is an important question, particularly when it comes to policies regarding access to both in-school and out-of-school activities for children. Unfortunately, it was beyond the scope of our analysis, and future research should examine whether different groups experience varying ECA effects on cognitive and socioemotional outcomes.
Footnotes
1
We also used a different operationalization of ECA participation, as cumulative participation in each type of activity over time, but this proved difficult, with the lack of consistency in questions asked about ECAs across waves of the sample.
2
Note that data for socioemotional skills were not collected in wave 7, so it is not present in the model.
3
To estimate a fixed-effects model within the framework of SEM, we created a model in which ECA had a contemporaneous effect on each outcome (with no lags added). The relationship between ECA and each outcome was constrained to be identical across all waves. A latent variable (α) was created to affect the endogenous latent outcome at each time point. Alpha was correlated with the exogenous variables in the models, which were all allowed to covary with each other. Finally, the error terms for each variable were constrained to be equal across waves.
4
It is worth noting that we estimated the model using a conventional pooled OLS specification, and the results were nearly identical to those produced by the SEM model.