
Abstract
In the 1970s and 1980s, researchers argued that a new dimension of racial prejudice, termed “symbolic racism” and later “racial resentment,” emerged among white Americans as their endorsement of traditional prejudice declined. Recently, Carmines, Sniderman, and Easter have challenged this conceptualization. Relying on American National Election Surveys data, they argue that racial resentment and the attitudes about racial policy that it presumably explains are part of the same latent construct (labeled racial policy attitudes). This conclusion undermines theories that racial prejudice among white Americans is a primary determinant of their continued opposition to racial policies. We replicate their analyses and test an alternative model using five additional samples. We find that an alternative model that specifies racial resentment as distinct from racial policy attitudes was a better fit to the data, and additionally, we find preliminary evidence that it is inappropriate to consider racial policy attitudes as a single dimension using traditional indicators.
Expressions of traditional racial prejudice by white Americans have declined since the 1940s, but the average level of support for policies and initiatives that would reduce racial inequality has remained largely unchanged (Bobo et al. 2012; Schuman et al. 1997). Starting in the 1970s, some researchers argued that the reason for this apparent inconsistency was that a new and distinctive dimension of racial prejudice had emerged to replace traditional racism (McConahay and Hough 1976; Kinder and Sears 1981; McConahay 1982, 1986; Kinder and Sanders 1996). Proponents claimed that this new form of racism replaced traditional beliefs about blacks’ biological deficiencies with beliefs about cultural deficiencies that undermine blacks’ will and motivation to overcome their disadvantages. 1 The argument made by these researchers was that whites tend to oppose racial policies such as affirmative action because of these contemporary racial views (Kinder and Sanders 1996; Sears and Henry 2003, 2005; Tarman and Sears 2005).
Debate regarding this new racism emerged in the 1980s (Bobo 1983; Kinder 1986; Sniderman and Tetlock 1986a, 1986b), evolved over time (Sniderman and Piazza 1993; Kinder and Sanders 1996; Hughes 1997; Sears and Henry 2005), and resulted in modest changes in conceptualization and measurement (Kinder and Sanders 1996; Sears and Henry 2005). A key concern that emerged in the early debates was that survey items measuring the new racism were confounded with attitudes about racial policy that the new racism presumably sought to explain (Sniderman and Tetlock 1986a, 1986b; Sniderman and Piazza 1993; Tetlock 1994; Hurwitz and Peffley 1998; Stoker 1998; Schuman 2000). Although Kinder and Sanders (1996), Sears and Henry (2005), and Tarman and Sears (2005) addressed and attempted to dismiss this criticism, the issue has not been settled. In 2011, Carmines, Sniderman, and Easter raised this concern again and examined it empirically using data from the American National Election Surveys (ANES). Based on a set of confirmatory factor analyses, they argued that the primary contemporary measure of this new racism, labeled as “racial resentment,” is actually a measure of racial policy attitudes, not racial prejudice. This conclusion, however, undermines theories arguing that racial prejudice among white Americans is a primary determinant of their continued opposition to racial policies.
In the present article, we replicate the confirmatory factor analyses designed by Carmines et al. (2011) using the three years of the ANES originally analyzed by them. We propose an alternative model to that fit by Carmines et al. We then fit this alternative model on three additional waves of ANES data along with two other samples that are not part of the ANES program. Based on our analyses, we question the conclusion of Carmines et al. that racial resentment items are measures of racial policy attitudes. In addition, we critique the measurement of racial policy attitudes as a single latent dimension, and we demonstrate how racial resentment and traditional prejudice predict attitudes about specific racial policies.
Background
The New Racism
White Americans’ support for de jure segregation and their belief in the innate inferiority of blacks declined dramatically from the 1940s to the present (Schuman et al. 1997; Bobo et al. 2012). In the 1970s and 1980s, Sears and Kinder (1971), McConahay and Hough (1976), and McConahay (1982) argued that white Americans could no longer express old-fashioned racist views in polite society due to fear of social ostracism and that a new form of prejudice, which McConahay (1986) termed “modern racism,” had replaced these old-fashioned views. Kinder and Sears (1981) conceptualized this new form of racism as “symbolic racism,” defining it as the confluence of anti-black affect and traditional American values of individualism and self-reliance embodied in the Protestant ethic. In the mid-1990s, Kinder and Sanders (1996) refined this measure and relabeled it as “racial resentment.”
Critique and Response
Researchers in the 1980s leveled several important criticisms against the various conceptualizations of new racism. For example, Bobo (1983) argued that Kinder and Sears’ (1981) theory ignored realistic group-conflict motives. Sniderman and Tetlock (1986b) claimed that measures of symbolic racism were confounded with both racial policy attitudes and political conservatism. Sniderman and Tetlock (1986b), Bobo (1988), and Schuman et al. (1997) argued that the new racism did not appear to be much different from old-fashioned prejudice. Hughes (1997) questioned whether symbolic racism could be the confluence of anti-black affect and American individualism by showing that individualism and anti-black affect were poor predictors of symbolic racism and that they did not explain the impact of symbolic racism on affirmative action attitudes in either additive or interactive models. Similar findings were reported by Sniderman, Crosby, and Howell (2000).
Proponents of the new-racism concept responded to these criticisms in a variety of ways (Kinder and Sanders 1996; Sears, Van Laar, Carrillo, and Kosterman 1997; Sears and Henry 2003; Tarman and Sears 2005; see Sears and Henry [2005] for a review, including responses to all major criticisms of the symbolic-racism concept). They argued that group-conflict motives might be one, but not the only, important factor in the new racism (Kinder and Sanders 1996). They showed that the effects of the measure were independent of political conservatism, and they specified that racialized individualism, rather than individualism in general, was a primary factor in the new racism (Sears and Henry 2003). Using factor analyses, Sears and Henry (2005) showed that symbolic racism was empirically distinct from, but correlated with, old-fashioned prejudice (see also Hughes 1997). Modern-racism researchers also acknowledged that racial prejudice was not the only factor behind whites’ reluctance to support ameliorative racial policies. Yet they argued that in its contemporary form, it is the critical element that has “taken over the political role played in pre-Civil Rights days by old-fashioned racism” (Sears and Henry 2005:97). As noted by Kinder and Sanders (1996:301), the new racism is “the primary ingredient in white opinion on racial affairs.” Research shows that the new racism, variously defined, is the most important predictor of racial policy attitudes (Hughes 1997; Bobo 2000; Tuch and Hughes 2011).
The Primary Measurement Critique
A critical concern regarding research on the new racism that has yet to be resolved or convincingly attended to is the confounding question. The primary measurement critique revolves around the idea that the measurement items of the new racism reflect the measures of racial policy attitudes that they are designed to explain. Critics have noted that items measuring symbolic racism and racial resentment specifically refer or allude to racial policy or government involvement. There are two facets to this critique.
First, in some early studies of modern or symbolic racism, researchers included items tapping support for ameliorative racial policies in indices of racism. In other studies, they used different indices of modern racism to predict attitudes about those same ameliorative racial policies (Sniderman and Tetlock 1986a, 1986b). The reasoning was tautological. If support for racial policy was an indicator of modern racism, how could modern racism explain such support? This practice was largely abandoned in the early 1980s (Sears and Henry 2005).
Second, refined symbolic racism and racial resentment indices that excluded items tapping attitudes about racial policies were criticized because the content of some items, while not specifically about racial policy, overlapped with measures of racial policy attitudes. For example, a standard symbolic racism item asks whether blacks who receive welfare could get along without it. A typical racial policy attitude item asks about government support to help improve the socioeconomic position of blacks. Though the items are not the same, they both may be tapping the same underlying attitude. In response to this concern, Kinder and Sanders (1996), Sears and Henry (2005), and Tarman and Sears (2005) removed items referring to actual or possible government action from indices of what Sears and his colleagues continued to call “symbolic racism” and Kinder and Sanders relabeled as “racial resentment.” Analyses by these researchers with the refined indices yielded the predicted associations with racial policy attitudes.
In 2000, Schuman criticized the measurement of racial resentment as prejudice in a way that suggested that such refinements would not solve the problem of confounded measures: . . . the two types of items labeled “prejudice” and “racial policy”—are so close in implication that a strong association between them might be thought of as indicating somewhat different aspects of the same general construct, negative attitudes toward the need to help blacks, rather than as distinguishing cause from effect. (Schuman 2000:305)
An Empirical Question
Schuman’s (2000) argument raises the question of whether the standard items of racial resentment used to tap “prejudice” and those items used to capture racial policy attitudes measure two distinct concepts or one. Carmines et al. (2011) turned this into an empirical question that they could answer using confirmatory factor analysis (CFA). They argued that racial resentment items are not measures of prejudice but instead are measures of racial policy attitudes. Using CFA, they estimated and compared various measurement models that included racial resentment, racial policy, and traditional racial prejudice (stereotypes) items.
Carmines et al. (2011) reasoned that if racial resentment items were measures of racial prejudice, then the best-fitting model would be one in which traditional prejudice items and racial resentment items constituted a single latent variable, with racial policy items loading on the other. However, if racial resentment items were measures of racial policy attitudes, then the best-fitting model would be one in which racial resentment and racial policy items made up one latent variable, with traditional prejudice items making up the other.
The data came from three separate survey years of the ANES. The best model among the Carmines et al. (2011) analyses was the two-latent-variable model in which racial resentment items and racial policy items constituted a single dimension (labeled “racial policy attitudes”), and traditional prejudice (stereotypes) constituted a separate dimension. Their conclusion was that racial resentment items do not measure prejudice; rather, they are measures of racial policy attitudes. Their finding that the original racial resentment items loaded on a factor distinct from traditional prejudice was consistent with the findings of Sears and Henry (2005) and Hughes (1997), but their claim that these items were really measuring racial policy attitudes was new. 2
A Problem in the Measurement of Racial Policy Attitudes
Sniderman and Piazza (1993) and Sniderman et al. (2000) made a more fundamental theoretical critique of the new-racism theoretical and conceptual framework. They argued that there are at least three issue agendas—a race-conscious agenda, an equal treatment agenda, and a social welfare agenda—that shape whites’ racial policy views. Because each of these agendas is embedded in a distinct political context that shifts over time, racial prejudice should have a substantially different impact on each agenda. For example, prejudice may play a small role in affirmative action because many people oppose preferences for reasons other than prejudice. On the other hand, prejudice may have a greater impact on welfare issues because they are perceived to be more clearly linked to race (Sniderman et al. 2000). As political contexts change over time, policy agendas change, as well, leading to shifts in whites’ policy concerns and the linkages among them.
The Problem
In the present study we examine two research questions. First, is the two-latent-variable model that Carmines et al. (2011) present an adequate representation of the data? We examine this question by using CFA within the structural equations modeling framework to test a series of models of racial attitudes. Specifically, we explore the two models investigated by Carmines et al., but we also estimate three-latent-variable models that include racial resentment, racial policy attitudes, and traditional prejudice as three separate factors. We use a mixture of lavaan 0.5 and Mplus 8 for estimation. We begin with three waves of the ANES (1992, 2000, 2004) in a replication of analyses performed by Carmines et al., and then we test our alternative three-variable CFA model on these same data. Next, we examine model fit for the alternative model in other waves of the ANES (2008, 2012, 2016) and two other studies, one of white students at the University of Alabama in 2013 and one of an online sample of white U.S. adults in 2016.
Second, in light of the argument by Sniderman et al. (2000) that racial policy includes three distinct agendas, is it reasonable to represent attitudes about racial policy empirically as a single dimension? To examine this question, we report results of CFAs on racial policy items in ANES surveys. In addition, we present analyses showing how two dimensions of racial prejudice—traditional prejudice and racial resentment—predict whites’ attitudes about specific policy items (affirmative action, fairness in employment, and government help to improve the social and economic position of blacks).
Data and Methods
We use data from three sources: the ANES, a survey of University of Alabama students in 2013, and an online survey from 2016. The ANES data are from six separate survey years of 1992, 2000, 2004, 2008, 2012, and 2016. The Institute for Social Research at the University of Michigan conducts the ANES research program and employs full-probability sampling designs that produce data representative of the non-institutionalized adult population of the continental United States. For a complete discussion of ANES methodology, see American National Election Studies and Stanford University (2015).
The University of Alabama student survey was conducted in the spring of 2013 by the Institute for Social Science Research at the University of Alabama with the approval of the university’s institutional review board. Participation was voluntary, and students provided informed consent before responding to the survey. The goal of sampling was to obtain a reasonably representative sample of the 28,026 students enrolled on campus for the 2012–13 academic year using a classroom survey and an online survey. Because the response rate for the online survey was 10 percent, the present study uses only the classroom data. Researchers distributed questionnaires in classes across academic levels in each college in the university. The response rate for the classroom sample was 74 percent, and the sample size was 2,140, including 1,639 white students. Given the specificity of our research questions, our analyses are limited to the use of data from white respondents in the two previous data sources.
The 2016 online data were collected with a cross-sectional, randomized, survey-based experiment on the SENSYS 6.0 platform in July 2016. The data were collected by the Kent State Survey Lab, which used a panel provided by Survey Sampling International (SSI). 3 Participants were selected through a nonprobability proportional sampling method: SSI develops panels of samples tailored to capture the respondents who fit the researcher’s parameters, and it also tries to match the sample as closely as possible to the makeup of the American adult population in terms of age, gender, and geographical makeup. To participate in the survey, respondents had to identify as singularly white or white in conjunction with another ethnoracial identification. Incentives were offered for participation, and all respondents provided consent prior to completing the survey. One hundred six cases were replaced for speeding, and duplicate cases were removed. 4 The completion rate of those who started the survey was 56.7 percent, while the overall response rate was 45.5 percent. The sample size was 1,344. However, respondents who experienced experimental treatment conditions (which were not a part of these analyses) were excluded, yielding a final sample of 277.
Variables
Racial policy attitudes
The ANES includes four items tapping racial policy attitudes. These items concern affirmative action, fair treatment in jobs, government action to improve black people’s socioeconomic status (SES), and support for government spending to assist black people. The items are worded as follows 5 : (1) AFFACT (affirmative action): “Some people say that because of past discrimination, blacks should be given preference in hiring and promotion. Others say that such preference in hiring and promotion of blacks is wrong because it gives blacks advantages they have not earned. What about your opinion—are you for or against preferential hiring and promotion of blacks?” Respondents who reported being either for or against the policy were then asked how much they favored or opposed the policy. We coded responses to this variable as follows: agree (and strongly favor) = 1; agree (and favor not strongly) = 2; neither agree nor disagree = 3; disagree (and oppose not strongly) = 4; disagree (and oppose strongly) = 5. (2) FAIRJOB (fair treatment in jobs) 6 : “Should the government in Washington see to it that black people get fair treatment in jobs or is this not the federal government’s business?” Responses to this question are coded from 1 to 5, as follows: strongly favor fair treatment = 1; favor fair treatment not strongly = 2; not enough interest in the issue to favor one alternative over the other = 3; believe (not strongly) this is not the government’s business = 4; strongly believe this is not the government’s business = 5. (3) HELPBLK (government help to improve blacks’ SES): “Some people feel that the government in Washington should make every effort to improve the social and economic position of blacks. Suppose these people are at one end of a scale, at point 1. Others feel that the government should not make any special effort to help blacks because they should help themselves. Suppose these people are at the other end, at point 7. And, of course, some other people have opinions somewhere in between, at point 2, 3, 4, 5, or 6.” The response that the government in Washington should make every effort to improve the social and economic position of blacks was coded 1; the response indicating that blacks should help themselves was coded 7; other responses were coded from 2 to 6 as indicated in the question. (4) SPENDBLK (spending to assist blacks): “If you had a say in making up the federal budget this year, on which of these programs would you like to see spending increased and which decreased? Should federal spending on programs that assist blacks be increased, decreased, or kept about the same?” Responses were coded as follows: increased = 1; kept the same = 2; decreased = 3.
Not all the racial policy items are available in every year of the ANES. In 1992 and 2000, we have the items on affirmative action, government help to improve SES, and support for spending to assist black people. In 2004, 2008, and 2012, we have items on affirmative action, government help to improve SES, and fair treatment in jobs. In 2016, we have items on affirmative action and government help to improve SES.
Traditional prejudice
In the ANES, traditional prejudice is measured by items asking about racial stereotypes. The questions were prefaced with the following statement: “Next are some questions about different groups in our society. Please look, in the booklet, at a 7-point scale on which the characteristics of the people in a group can be rated.” Respondents were asked to rate whites and blacks on several continua: an intelligence continuum (BLKWHTINTL; intelligent [coded 1] to unintelligent [coded 7]), a hardworking continuum (BLKWHTLAZY; hardworking [coded 1] to lazy [coded 7]), a violence continuum (BLKWHTVIO; peaceful [coded 1] to violent [coded 7]), and a trustworthiness continuum (BLKUNTRST; trustworthy [coded 1] to untrustworthy [coded 7]). For each stereotype, we subtracted the white rating from the black rating. Therefore, the resulting variable taps how much more unintelligent, lazy, violent, or untrustworthy the respondent thought blacks as a group are in comparison to whites as a group.
Not all the stereotype measures are available in every year of the ANES. In 1992, we have lazy, unintelligent, and violent. In 2000 and 2004, we have lazy, unintelligent, and untrustworthy. In 2008 and 2012, we have lazy and unintelligent, and in 2016, we have lazy and violent.
Racial resentment
Racial resentment in the ANES data is an index of four items: (1) IRISHUP: “Irish, Italians, Jews, and many other minorities overcame prejudice and worked their way up. Blacks should do the same without any special favors.” (2) SLAVERY: “Generations of slavery and discrimination have created conditions that make it difficult for blacks to work their way out of the lower class.” (3) DESERVE: “Over the past few years, blacks have gotten less than they deserve.” (4) TRYHARD: “It’s really a matter of some people not trying hard enough; if blacks would only try harder, they could be just as well off as whites.” Responses for all four items were agree strongly, agree somewhat, neither agree nor disagree, disagree somewhat, and disagree strongly. The items were coded from 1 to 5, with 5 indicating the greatest degree of resentment.
Variables in the University of Alabama student survey
Nearly identical items were included in the University of Alabama student survey to measure racial policy attitudes, traditional prejudice, and racial resentment. For racial policy attitudes, the Alabama survey included items on affirmative action, government help to improve SES, and fair treatment in jobs. The stereotype items included unintelligent, lazy, violent, and a fourth continuum of rich (coded 1) to poor (coded 7). The racial resentment items were identical to those in the ANES.
Variables in the 2016 online survey
Nearly identical items were included in the online survey to measure racial policy attitudes, traditional prejudice, and racial resentment. For racial resentment, the online survey included all four items. For racial policy attitudes, it included items on affirmative action, government help to improve SES, and fair treatment in jobs. The stereotype items included unintelligent, violent, lazy, and untrustworthy.
Sample sizes, means, standard deviations, and ranges of all variables are presented in Table 1.
Descriptive Statistics for 1992, 2000 to 2016 Waves of the ANES, Alabama Sample, and 2016 Online Sample.

Note: See text for variable descriptions.
Fit Statistics
Model comparisons here are based primarily on the Schwarz-modified Bayesian information criterion (SBIC), which is both a stand-alone fit index and a comparative one (Schwarz 1978; Roos 2014). The SBIC is calculated with the formula: χ2 – df*nl(N), or the chi-square test statistic minus degrees of freedom multiplied by the natural log of the sample size. This fit statistic penalizes model complexity and is devised to give a comparison of the saturated to hypothesized model, or to compare any two models with the same set of manifest variables and sample. SBIC values less than zero show varying support for the model versus the saturated model, and when the observed variables are the same, two models may be compared by the difference in their SBIC scores (Raftery 1995:139). This feature of the SBIC allows the comparison of models that are not otherwise comparable with the model chi-square, provided they make use of the same manifest variables and sample. Final models also report several other standard indices of model fit (the model chi-square, the root mean square error of approximation [Hu and Bentler 1999], the Tucker-Lewis index [Tucker and Lewis 1973], and the comparative fit index [Bentler 1990]), but assessment of best fit is made with the SBIC.
Analytic Procedure and Results
The analyses examining the first research question followed two discrete stages of analysis and results. The first stage entailed a replication of analyses presented in Carmines et al. (2011) and a comparison of their two-dimensional model (traditional prejudice and racial policy attitudes) with a three-dimensional model (racial resentment, traditional prejudice, and racial policy views). In this stage, we replicate the models presented by Carmines et al. as well as a version of their models where we have added correlated errors similar to those in the three-dimensional model. The second stage involves testing this three-dimensional model in five additional samples. Unless otherwise specified, all models fit to ANES data use survey weights.
To investigate the second research question, we used CFA to examine the fit of a model that included racial policy items as a single latent variable. We also ran models to assess whether racial resentment predicted each racial policy item differently than it does in analyses that specify racial policy attitudes as one dimension (e.g., Tuch and Hughes 2011).
Question 1, Stage 1
First, we replicated the models in Carmines et al. (2011) using the original three waves of the ANES from their study. In some cases, this required recoding variables present in the ANES, and care was taken to follow the analytic choices made by Carmines et al. whenever enough detail was made available to do so. Carmines et al. compare two models; we refer to these as the Kinder and Sanders model (KS; because it is based on reasoning in Kinder and Sanders [1996] that is discussed in Carmines et al. [2011]) and the Carmines, Sniderman, and Easter model (CSE). We then test a third model, referred to here as the three-dimensional model (3DM), because it differs from both KS and CSE by partitioning the racial policy items into a third dimension. These three models, as fit with the 1992, 2000, and 2004 waves of the ANES, are represented in Figure 1. While the racial policy item FAIRJOB was available in 2004, we omit it in this stage to more closely replicate models presented by Carmines et al.
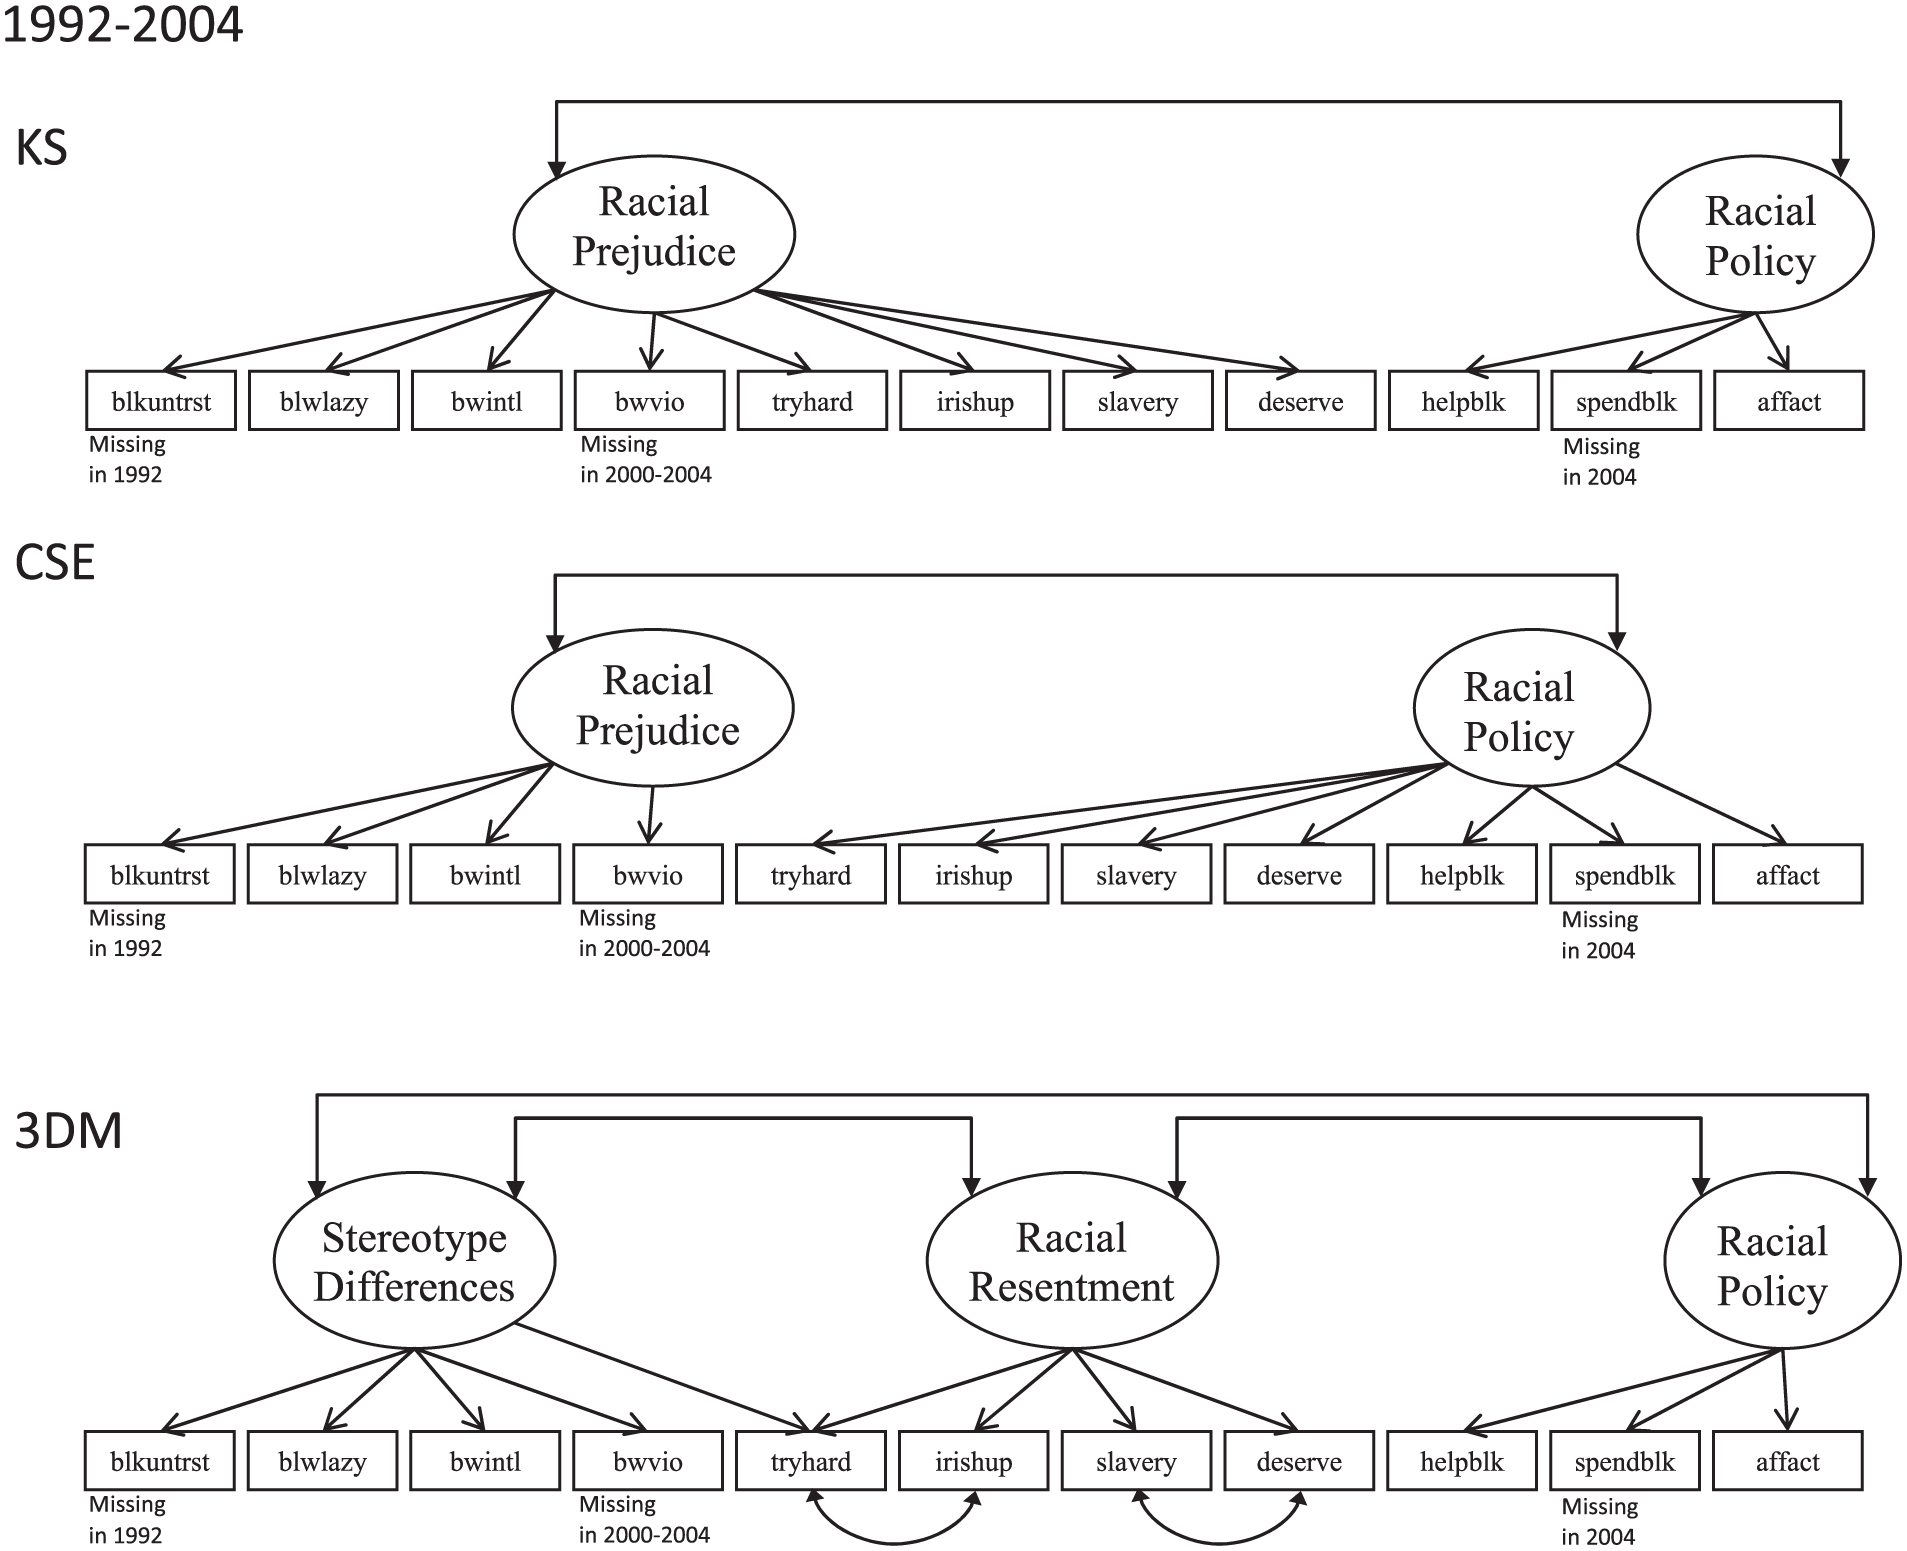
Measurement models for American National Election Surveys data, 1992 to 2004.
The 3DM allows items originally intended to measure policy views (HELPBLK, SPENDBLK, and AFFACT) to load on the third, “racial policy” dimension (Rpol), rather than alongside the racial resentment items (as in CSE). In addition, unlike KS, it splits the two forms of racial attitudes, traditional prejudice (stereotype differences) and racial resentment, into two separate dimensions. Last, the 3DM allows TRYHARD to load on both racial resentment and stereotype differences.
This 3DM allowed the parameter for the correlation of two error terms to be freely estimated rather than set to zero. 7 With this design, it had superior fit to either CSE or KS in all three of the original waves (see Table 2). 8 It is important to note that the available items for analysis differed from wave to wave on the ANES. Some indicators present in 1992 were missing in 2000 or 2004, and vice versa. Carmines et al. (2011) solved this issue by running models with available indicators for each wave and comparing fit within each wave. We followed that logic here. Also, we added a modified version of the Carmines et al. model (CSEw/CE) with the correlated error structure specified in the 3DM, shown in Figure 1. This was a marked improvement over CSE, but it did not yield a better fitting model than the 3DM. This is not the model presented in Carmines et al., but we included it in this stage for a complete and thorough evaluation of their model.
Model Fit Statistics from Stage 1.

Note: All models fit to American National Election Surveys data make use of survey weights. CFI = comparative fit index; TLI = Tucker-Lewis index; RMSEA = root mean square error of approximation; Obs = observations; SBIC = Schwarz-modified Bayesian information criterion; KS = Kinder and Sanders (1996) two-dimensional model; CSE = Carmines, Sniderman, and Easter (2011) two-dimensional model; CSEw/CE: CSE with correlated error structure from alternative model added; 3DM = alternative, three-dimensional model.
The correlated errors required for the 3DM applied to the CSE.
The FAIRJOB item was omitted for 2004 year, to replicate as best as possible the models estimated by Carmines et al. (2011).
Making comparisons across waves is difficult because of complete missing cases for these indicators. In some instances, indicators are completely missing with respect to each other (that is, whenever BLKUNTRST is present, BWVIO is missing, which poses estimation problems). For an illustration of these missing data patterns, see Figure 2. We made a conservative attempt to resolve this problem by pooling the data and omitting all indicators that were not present for each of the three waves. No controls for ANES year are included, but the model is estimated with survey weights. This yielded model fit indices that still suggest the 3DM is superior (see Table 2, “Pooled; missing dropped”). A second set of analyses included indicators that were missing only for one wave; estimated with survey weights, this yielded similar results (Table 2, “Pooled; some missing data”). 9 In both cases, after pooling waves 1992, 2000, and 2004, the 3DM was preferred.

Measurement models for 2008-to-2016 pooled data.
Question 1, Stage 2
Once the 3DM was demonstrated as the preferred model for waves 1992, 2000, and 2004, stage 2 involved fitting this model to remaining waves of data, including the 2004 (with FAIRJOB), 2008, 2012, and 2016 waves of the ANES individually as well as the 2008-to-2016 pooled data (see Figure 2). Additionally, we fit this model with two additional samples: the 2016 online sample of adults and the 2013 University of Alabama student classroom sample (Table 3). The 3DM fits reasonably well in all waves, save for the University of Alabama student sample (and it is still fit better than KS, CSE, and CSEw/CE in that sample). No variation of a model with the policy items present yielded acceptable fit for the University of Alabama data. Only a model as shown in Figure 3 approached reasonable fit (SBIC = −16.384). This required allowing for two additional freely estimated error terms (dotted curved arrows in Figure 3). As this is the only sample purely from the U.S. South, we speculate that these may reflect a Deep South effect. The correlations between the BLWLAZY and BWINTL items (.485) and between BWINTL and the (reverse-coded) SLAVERY item (–.158) found in this sample and not in others suggests that among students at University of Alabama, the old-fashioned racist views that black people are lazy and have relatively low intelligence are linked to rejecting the argument that the legacy of slavery and discrimination is a barrier to upward mobility.
Model Fit Statistics from Stage 2.

Note: All models fit to ANES data make use of survey weights. Alternative models not presented here; the three-dimensional model had superior fit in all cases. ANES = American National Election Surveys; TLI = Tucker-Lewis index; RMSEA = root mean square error of approximation; Obs = observations; SBIC = Schwarz-modified Bayesian information criterion;
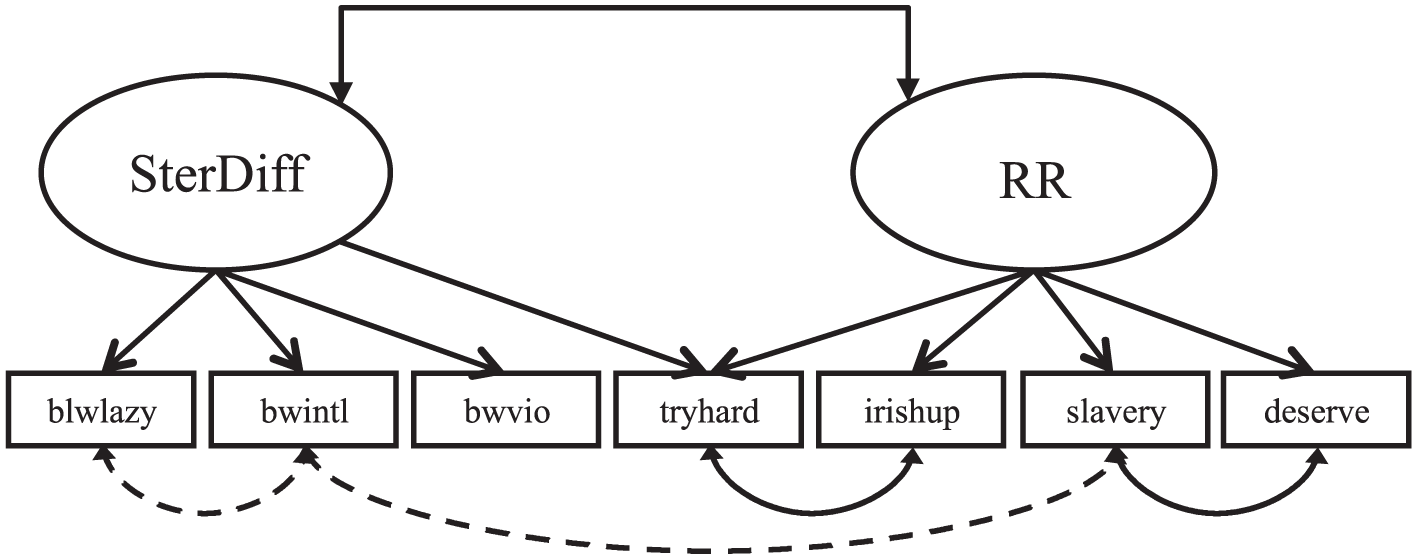
Adjusted Alabama measurement model; policy omitted.
Across all models estimated from single years of the ANES, all models from pooled data, and in the model estimated from the 2016 online sample, the correlations between racial resentment and racial policy attitudes was high, ranging from .82 to .96. These estimates are in line with those reported by Carmines et al. (2011).
Question 2
In the process of assessing local model fit in the 3DM, each latent variable was fit separately, with only indicators measuring it present. While stereotype differences and racial resentment models had adequate fit, a pooled model where the racial policy items (FAIRJOB, AFFACT, SPENDBLK, HELPBLK) loaded on a single latent variable converged; however, the item r-squares (or the degree to which the latent variable explains variance in the indicators) varied from .203 to .568. Such a pooled model requires the maximum likelihood estimator on 1992-to-2004 ANES samples because of missing data patterns, and fit was poor (SBIC = 6.176). Allowing for a correlated error between SPENDBLK and HELPBLK might improve fit, but such a modification yields models that fail to converge. 10 Poor model fit and low item r-squares are evidence against the existence of a single latent construct underlying the racial policy attitudes indicators, as suggested in Carmines et al. (2011).
Furthermore, poor fit of the racial policy dimension suggests that it may not be appropriate to consider racial policy attitudes to be a single, uniform latent dimension in other samples. In addition, if racial policy attitudes do not form a coherent latent construct, then it may be unreasonable to argue that racial resentment is an important predictor of racial policy attitudes (e.g., Tuch and Hughes 2011). Here we explore an alternate specification and show how both racial resentment and stereotypes influence each individual policy indicator, using the 2008-to-2016 pooled data (see Figure 4).

Simultaneous regressions of racial policy items on racial resentment and stereotype differences latent variables.
The varied regression coefficients provide some evidence that the influence of racial resentment differs slightly across each of the four available policy items in 2008 to 2016. However, the differences are not as dramatic as those suggested by Sniderman et al. (2000), and the findings cast doubt on their position that variation in white support for racial policies is largely due to specific policy agendas. Evidence here supports arguments by Bobo (2000) and Kinder and Sanders (1996) that contemporary racial prejudice is an important determinant of racial policy attitudes across the board. Here we would like to draw the reader’s attention to the negative and nonsignificant coefficients for traditional prejudice (stereotype differences). In a model where racial resentment is omitted, these are sizeable and significant, suggesting that whatever influence stereotypes may have on policy attitudes, it is completely explained by racial resentment.
Discussion
Following Schuman’s (2000) argument that racial resentment items and racial policy items appeared to be measuring the same underlying dimension, Carmines et al. (2011) assessed this conjecture empirically by performing CFAs of racial resentment items, racial policy items, and traditional prejudice items. Since the best-fitting model was the one in which racial resentment items loaded on the same factor with racial policy items, they reasoned that racial resentment items are measures of racial policy attitudes, not racial prejudice. In our CFAs, the three-factor model (racial resentment, racial stereotypes, and racial policy attitudes), known as 3DM in this article, fits consistently better than the two-factor model proposed by Carmines et al. These findings show empirically that racial resentment and racial policy attitudes are distinct from each other and from traditional prejudice. This was true whether or not we attempted to include model improvements to the original model in Carmines et al. The 3DM also had good fit on later waves of the ANES and in an independent 2016 sample of U.S. adults. In addition, the 3DM fit better than other models on a 2013 student sample from the University of Alabama, although overall fit was poor due to the uniqueness of this sample.
One interpretation of the high correlations that we observed in our analyses between racial resentment and racial policy attitudes is that Schuman (2000) and Carmines et al. (2011) were essentially correct and that racial resentment and racial policy attitude items are two slightly different ways of measuring racial policy attitudes. A problem with this interpretation is that it relies on racial policy attitudes as the common concept that holds all these items together. Our analyses showed that the items tapping racial policy attitudes do not hold together as a coherent measure, and this may reflect that fact that the racial policy attitudes used in our analyses constitute three distinct policy agendas, not a single dimension (Sniderman and Piazza 1993; Sniderman et al. 2000). In addition, racial resentment items are not explicit measures of racial policy attitudes. At best, they are assessments, evaluations, and stereotypes that blame black people for their socioeconomic position and imply that only blacks themselves should provide any remedies. This suggests that if they do constitute a single dimension, that dimension may have more to do with what racial resentment items measure than with what racial policy items measure.
The alternative interpretation is that traditionally, the empirical test of unidimensionality is comparing models with one factor and with two (or with two factors and constraining the standardized covariance between them to be one) and relying on global model fit. This is analogous to the model comparisons presented here. The fact the 3DM fits better is good evidence that the dimensions are empirically distinct, and it suggests that the high correlations indicate that racial resentment is a powerful predictor of racial policy attitudes.
It is also possible that there are other factors, not included in our analyses, that are responsible for many, if not most, of these high correlations. There has been research on this question (e.g., Sears and Henry 2005), but further research is needed.
Our findings indicating that the shared covariance in the racial policy measures is weak demonstrates that the items are poor indicators of a racial policy latent variable. Such evidence further questions the regular practice of utilizing such items as if they represent a single factor. While this finding supports the notion that policy attitudes may be not be a single dimension, analyses that separately predicted each policy attitude produced results consistent with studies that consider racial policy attitudes as a single dimension. Such findings demonstrate that further thought and attention need to be given to the generation and validation of new and alternative measures of racial policy attitudes.
Future work should also seek to remedy the limitations that hindered this replication. The 3DM allowed one indicator to load on two dimensions (this is sometimes referred to as a model having a factor complexity greater than 1). This poses no problems for model identification or estimation. However, it does lead to bias when using the two scales together without accounting for the way that TRYHARD loads on both dimensions (for example, if a researcher creates summed scales rather than estimating a CFA model). To avoid these problems, further refinement of these scales is necessary, namely, through the creation and validation of additional items.
Stage 1 as presented in this study also suffers because of insufficient detail in Carmines et al. (2011), which was needed to perfectly replicate their models. In addition, as with Carmines et al.’s test, the data we analyze contain multiple, nonmonotonic patterns of missing data, a problem with many data sets but more problematic with replications and generational tests. Last, response categories for many indicators varied (i.e., from four- to five- or seven-category Likert scales) over samples present, making direct comparison more difficult.
In conclusion, in spite of criticisms of the measurement and conceptualization of racial resentment, we find that it is empirically distinct from racial policy attitudes. Our analysis shows that the measurement of racial resentment and racial policy attitudes is not without problems. However, one of those problems is not that racial resentment items are measures of racial policy attitudes. While it is clear that the measure of racial policy attitudes is poorly constructed as a single dimension, we find that racial resentment is an important predictor of each policy variable considered individually. These findings are consistent with arguments that racial resentment is a primary determinant of white opposition to policies that would attempt to ameliorate racial inequality.
Footnotes
Funding
The author(s) disclosed receipt of the following financial support for the research, authorship, and/or publication of this article: This research has received financial support from Virginia Tech’s Open Access Subvention Fund.
1
The new racism has been conceptualized in three slightly different ways: “symbolic racism” (Sears and Kinder 1971; McConahay and Hough 1976; Kinder and Sears 1981), “modern racism” (McConahay 1982, 1986), and “racial resentment” (![]() ). In the present study, we are primarily concerned with the measurement of racial resentment. However, measurement is very similar across the three concepts, and literature regarding all three is relevant to issues raised about racial resentment.
). In the present study, we are primarily concerned with the measurement of racial resentment. However, measurement is very similar across the three concepts, and literature regarding all three is relevant to issues raised about racial resentment.
2
While what the original racial resentment items actually measure is a topic of dispute (and the motivation for the present article), we refer to them henceforth as “racial resentment” items in keeping with older terminology as well as our own findings, and for consistency.
3
Survey Sampling International maintains sampling panels totaling 11.5 million people across the globe.
4
Kent State University Survey Research Lab requests replacements from the sampling vendor for the following reasons: 48% over or under the median completion time, a duplicate respondent (based on personal identification code provided), or an unqualified-then-qualified respondent (if a personal identification number that at first was unqualified provides different information to become qualified in a later completion).
5
The variable names that are indicated here in all capital letters are used in the tables and figures.
6
FAIRJOB is a combination of a tripartite question in the American National Election Surveys; respondents are asked whether or not they have an opinion on the government having a role in fair jobs, then whether or not the government should have a role, and finally, the strength of that position.
7
The default assumption in a confirmatory factor analysis is that error terms for each indicator are uncorrelated with each other. Lack of a curved line (or any line) in a path diagram usually means this assumption is upheld and is the same as setting the value for that parameter to zero.
8
9
An attempt to pool waves including as much data as possible was made, taking advantage of the Bayes estimator in Mplus 8 to handle missingness. This is akin to using maximum likelihood to handle missing data, which is asymptotically similar to multiple imputation, in the case of data missing completely at random. Results were similar (not shown), with the three-dimensional model preferred over CSE, CSE with correlated error structure from alternative model added, or KS. The Bayes estimator in Mplus 8 allows the inclusion of nonzero, freely estimated correlated errors but prevents the use of survey weights.
10
These indicators correspond to the same racial policy agenda (the social welfare agenda) discussed in Sniderman and Piazza (1993) and Sniderman, Crosby, and Howell (2000).