
Abstract
Survey researchers theorize that how whites express racial prejudice changes across time. They argue one of its contemporary forms is racial apathy (i.e., not caring about racial equality). However, few empirical studies characterize racial apathy. To fill this gap, the present study addresses consistency in racial apathy across time at the population level and individual level. Using three waves of panel data (i.e., 2003, 2007–2008, and 2013) from the National Study of Youth and Religion, the authors examine the distribution of racial apathy at each wave. The authors then cross-tabulate racial apathy at wave 1 and wave 3, wave 3 and wave 4, and wave 1 and wave 4. The authors next explore correlates of individual-level consistency in racial apathy across time. Results reveal strong population-level consistency concurrent with weak individual-level consistency in the distribution of racial apathy. Furthermore, few correlates predict individual-level consistency.
Keywords
Whether white racial prejudice is an accurate barometer of intergroup antagonism is debatable because how whites express racial prejudice changes over time (Esposito and Romano 2014; Forman and Lewis 2006; Henry and Sears 2002; Kleinpenning and Hagendoorn 1993; Schuman et al. 1998). In addition, social desirability influences how whites answer survey questions about race and racism (Marlowe and Crowne 1961; Wodtke 2016). Survey researchers respond to this dynamism and such social desirability concerns by developing new ways to conceptualize and measure white racial prejudice (Bobo et al. 2012; Brown et al. 2009; Dovidio and Gaertner 1996; Esposito and Romano 2014; Forman and Lewis 2006; Henry and Sears 2002; Kinder and Sanders 1996; Kleinpenning and Hagendoorn 1993; McConahay and Hough 1976; Meertens and Pettigrew 1997; Pettigrew and Meertens 1995; Sears and Henry 2003; Williams et al. 1999). For instance, the field has moved away from reliance on blatant indicators of white racial prejudice toward reliance on subtle and colorblind indicators (Bobo, Kluegel, and Smith 1997; Bobo et al. 2012; Brown et al. 2009; Forman and Lewis 2006; Mueller 2017). Similarly, cultural and neoliberal explanations have mostly replaced biological explanations for racial inequality (Hunt 2007). If the field did rely on whites’ survey responses to blatant indicators, scholars would conclude that racial tolerance is widespread and increasing (Bobo et al. 1997, 2012; Forman 2004; Kinder and Sanders 1996; Schuman et al. 1998). However, Brown et al. (2019), Forman (2004), and Forman and Lewis (2006, 2015) theorize that racial apathy characterizes contemporary white racial prejudice.
These authors define racial apathy as whites not caring about racial equality. They assert that it is more acceptable for whites today to admit that they do not really care about racial equality than for them to admit that they would not date or marry a person of a different race or vote for a black political candidate, or for them to say that blacks are unintelligent, lazy, and prone to violence, or that blacks and whites should live in separate neighborhoods. However, racial apathy is as insidious as blatant antipathy because it absolves whites of responsibility for racism. Brown et al. (2019) suggested that racial apathy taps white indifference and nonchalance. Racial apathy represents whites covering their eyes when asked to view their privilege. It is similar to belief in a just world (see Jost and Hunyady 2005) such that racial inequality exists supposedly as a natural by-product of meritocracy, not as its contradiction.
Empirically, Forman and Lewis (2015) found that racial apathy correlated positively with opposing interracial marriage, cold feeling thermometer ratings toward blacks and Latinos, symbolic racism, perceived threat, and negative stereotypes about blacks and Latinos (i.e., they are unintelligent, prefer to live off welfare, are hard to get along with, and do not supervise their children). Pearson correlation coefficients between racial apathy and those measures averaged .29. Moreover, racial apathy directly predicted opposition to race-targeted, ameliorative policies. We hypothesize that racial apathy’s closest conceptual analog is social alexithymia (Feagin 2006:28), where whites feel neither empathy for blacks nor responsibility for racial inequality.
Because racial apathy is new, there are few empirical studies of it, and that fact motivates this study. For instance, to our knowledge, there are no longitudinal studies of racial apathy. Prior studies (e.g., Forman and Lewis 2006, 2015) analyzed cross-sectional data or repeated cross-sectional data. In addition, prior studies analyzed data that were at least 10 years old, happening before race-related events such as the presidency of Barack Obama (Esposito and Finley 2009). Finally, prior studies examined a narrow range of correlates of racial apathy and operationalized it indirectly (see Brown et al. 2019; Forman 2004; Forman and Lewis 2015). Consequently, we know little about racial apathy’s distribution at the population level, whether individuals express racial apathy consistently across time, and what its correlates are. Moreover, it remains unclear what survey measures best capture racial apathy.
Using three waves of panel data (i.e., 2003, 2007–2008, 2013) from the National Study of Youth and Religion (NSYR) with a new (and arguably ideal) measure, we examine the distribution of racial apathy across time. We next cross-tabulate racial apathy at wave 1 and wave 3, wave 3 and wave 4, and wave 1 and wave 4. We then estimate correlates of individual-level consistency in racial apathy across time. Results reveal strong population-level consistency concurrent with weak individual-level consistency in the distribution of racial apathy. Furthermore, we find few correlates that predict individual-level consistency. We conclude that longitudinal data, diverse correlates, and additional measures of racial apathy are necessary to estimate what it means when whites do not personally care about racial equality.
Methods
Data
The NSYR was a nationally representative, random-digit-dialing, computer-assisted telephone interview survey of 3,290 English- and Spanish-speaking, noninstitutionalized youth between the ages of 13 and 17 years and their residential parent(s). The NSYR investigated: (1) the influence of religion in youth’s lives; (2) effective practices in religious, moral, and social formation; and (3) perceived effectiveness of programs and opportunities that target religious communities. Youth answered additional questions about their relationships, physical and mental health, and so on.
The field period for wave 1 was July 2002 to April 2003. Respondents were reinterviewed three times, resulting in four waves of panel data. NSYR principal investigators attempted to reinterview respondents from wave 1, including those out of the country, in the military, or on religious missions. The field period for wave 2 was June to November 2005, when respondents were between the ages of 16 and 20 years. The field period for wave 3 was September 2007 to April 2008, when respondents were between the ages of 17 and 24 years. The field period for wave 4 was February to December 2013, when respondents were between the ages of 20 and 29 years. Wave 1, 2, and 3 interviews were conducted by phone. Wave 4 interviews were conducted online and by phone. Specifically, 85 percent of respondents completed interviews online, and the balance completed interviews by phone.
Analyses comparing the 2003 NSYR data with U.S. census data including households with adolescents and with comparable national adolescent surveys such as Monitoring the Future confirmed that the 2003 NSYR exhibited no identifiable sampling and nonresponse biases. The American Association of Public Opinion Research response rates were 57 percent for wave 1, 78 percent for wave 2, 77 percent for wave 3, and 67 percent for wave 4. Wave 4 NSYR data are not publicly available, but NSYR principal investigators shared those data with one of this study’s coauthors. We could not analyze all four waves because the racial apathy measure was omitted from the wave 2 questionnaire. For additional information about the research design, sampling frame, and data collection process, see https://youthandreligion.nd.edu. To view the questionnaires and code books or download the data, see http://www.thearda.com/Archive/NSYR.asp. Finally, the Rice University institutional review board approved this study (IRB-FY2019-157).
Measures
Racial Apathy
The following question measured racial apathy at wave 1, wave 3, and wave 4: “How much do you personally care or not about equality between different racial groups?” Response options were 1 = “very much,” 2 = “somewhat,” 3 = “a little,” and 4 = “do you not really care.” Because racial apathy is defined theoretically and explicitly as not caring (see Forman 2004; Forman and Lewis 2006), this measure manifests validity. Yet the measure almost certainly underestimates racial apathy, because many whites know that caring about racial equality is socially desirable.
We constructed two longitudinal measures of racial apathy. First, the variable consistent responses measured individual-level agreement in racial apathy across time. Specifically, respondents who expressed consistent racial apathy across time (e.g., wave 1, “somewhat”; wave 3, “somewhat”; and wave 4, “somewhat”) were coded “yes”; otherwise they were coded “no.” Only 31 percent of respondents present across all three waves gave consistent responses. Second, level of relative consistency measured individual-level agreement in racial apathy across time. The variable was a summated, numeric scale ranging from 3 to 12. Respondents who cared “very much” at each wave represented the low end of the scale (i.e., a score of 3). Those in the “do not really care” category at each wave scored a 12. Values between 3 and 12 represented the level of relative consistency in racial apathy (e.g., wave 1, “somewhat”; wave 3, “somewhat”; and wave 4, “a little”; or wave 1, “somewhat”; wave 3, “very much”; and wave 4, “a little”).
Correlates of Racial Apathy
Forman and Lewis (2015) placed correlates of racial apathy into two categories: (1) social values and (2) academic orientation. Replicating their approach, we created four categories: (1) social background, (2) academic orientation, (3) interracial contact and relationships, and (4) freedom of expression. All correlates were measured at wave 1. Gender, age, parental education, and parent political orientation captured social background. Parents reported their children’s gender. Age was self-reported and ranged from 13 to 17 years. Parental education captured the highest level of education of the residential parent(s): 1 = “less than high school,” 2 = “high school completed,” 3 = “some college,” 4 = “college completed,” or 5 = “graduate or professional degree.” This question captured parent political orientation: “When it comes to politics, do you usually think of yourself as . . .” (1 = “very liberal,” 2 = “somewhat liberal,” 3 = “middle of the road,” 4 = “somewhat conservative,” 5 = “very conservative,” 6 = “haven’t thought much about this,” or 7 = “don’t know [do not read]”). After assigning “refused” to missing, we coded responses into four categories: 1 = very liberal or somewhat liberal, 2 = middle of the road, 3 = somewhat conservative or very conservative, and 4 = haven’t thought much about this or don’t know.
Three correlates measured academic orientation: (1) grades, (2) educational aspirations, and (3) school difficulties. Grades was a dichotomous variable comparing students who earned “all A’s or mostly A’s” with their peers. The following question measured educational aspirations: “Given realistic limitations, how far in school do you think you actually WILL go?” Response options included 1 = “no farther in school,” 2 = “some high school,” 3 = “high school graduate,” 4 = “vocational-technical school after high school,” 5 = “some college or associate’s degree,” 6 = “college graduate,” and 7 = “post-graduate or professional school.” Ever suspended, expelled, or dropped out in the past two years measured school difficulties: “In the last TWO years, how many times, if any, have you been suspended or expelled from school?” We coded responses as “yes” (i.e., at least once) or “never.” Respondents who dropped out of school were skipped out of the suspension or expulsion question, but we coded them as “yes” on school difficulties.
Four correlates captured interracial contact and relationships. We modeled: (1) multirace household, (2) interracial dating, (3) different-race mentor, and (4) homogenous religious services. This question captured multirace household: “Are all the members of your household of the same race or ethnic group as you, or not?” Respondents who lived in multirace households were coded “yes”; otherwise they were coded “no.” Interracial dating combined three items: (1) “How many total different people, if any, have you dated since you turned 13 years old?” (2) “[If teen has dated one person since turning 13 years old] Was the person you dated of a different race, or not?” and (3) “[If teen has dated more than one person since turning 13 years old] How many, if any, of these people you dated were of a different race?” The final constructed variable included two responses: “yes,” which meant that the respondent dated interracially, and “never,” which meant the respondent never dated or never dated interracially. Different-race mentor combined three items: (1) “Roughly how many TOTAL ADULTS, if any, do you have in your life that you can turn to when you need support, advice, or help—not including your parents?” (2) “[If teen has only one adult to turn to for support and advice] Is this person of a different race than you, or not?” and (3) “[If teen has more than one adult to go to for support and advice] Of those adults that you can turn to, how many, if any, of them are of a different race than you are?” The final constructed variable included two responses: “yes,” which meant having at least one adult mentor of a different race, and “no,” which meant having no adult mentor or no adult mentor of a different race. Two questions combined to capture homogenous religious services: (1) “Do you attend religious services more than once or twice a year, NOT counting weddings, baptisms, and funerals [INSERT “or religious services during school” IF teen attends a private religious school]?” and (2) “Now I have some more questions about religion. About how many of the people in the religious services that you normally attend are the same race as you?” Response categories for the second question were 1 = “all,” 2 = “nearly all,” 3 = “most,” 4 = “about half,” 5 = “few,” and 6 = “none.” The final constructed variable included three categories: 0 = do not attend “more than twice a year,” 1 = mixed-race services (i.e., not “all”), and 2 = same-race services (i.e., “all”).
The following question measured freedom of expression: “How much freedom (do/does) your [PARENT TYPE] give you to develop and openly express YOUR OWN VIEWS on important issues?” Responses included 1 = “a lot,” 2 = “some,” or 3 = “a little.” It was recoded into three dummy variables.
Analytic Strategies
We restricted analyses to white NSYR respondents and deleted cases listwise. Using svy commands in Stata 15.1, we applied appropriate sampling weights to the univariate distributions and bivariate cross-tabulations and applied a panel sampling weight when analyzing all three waves simultaneously. NSYR sampling weights adjust for differential probabilities of selection and nonresponse, and incorporate poststratification adjustments for census region and household income to correct for noncoverage.
We treated racial apathy as an ordinal variable in the weighted univariate distributions and bivariate cross-tabulations. We ran two regression models. The first was a weighted binary logistic regression predicting whether respondents gave consistent responses to the racial apathy questions across time (0 = no, 1 = yes). The second was a weighted linear regression predicting level of relative consistency in racial apathy across time (ranging from 3 to 12). We predicted consistent responses and level of relative consistency using correlates that were mostly categorical. We labeled estimates producing statistical tests with p values less than .10, .05, .01, and .001 as statistically significant. Given that we could find but two published empirical studies of racial apathy (i.e., Forman and Lewis 2006, 2015), we report marginal significance (i.e., p < .10). The final Stata command file is available upon request.
Results
Table 1 displays distributions of racial apathy over time (i.e., wave 1, wave 3, and wave 4). We show three weighted univariate distributions. Therefore, the estimation sample sizes differ by row (wave 1, n = 2,058; wave 3, n = 1,634; and wave 4, n = 1,219). Approximately half the respondents chose “very much” at each wave. At wave 1, 49 percent responded “very much,” 28 percent “somewhat,” 7 percent “a little,” and 16 percent “do not really care.” At wave 3, 48 percent responded “very much,” 26 percent “somewhat,” 8 percent “a little,” and 18 percent “do not really care.” At wave 4, 56 percent responded “very much,” 26 percent “somewhat,” 9 percent “a little,” and 10 percent “do not really care.” Table 1 demonstrates that relatively few whites express racial apathy.
Univariate Distributions of Racial Apathy among White Respondents in the 2003, 2007–2008, and 2013 National Study of Youth and Religion: Examining Population-level Consistency across Time.
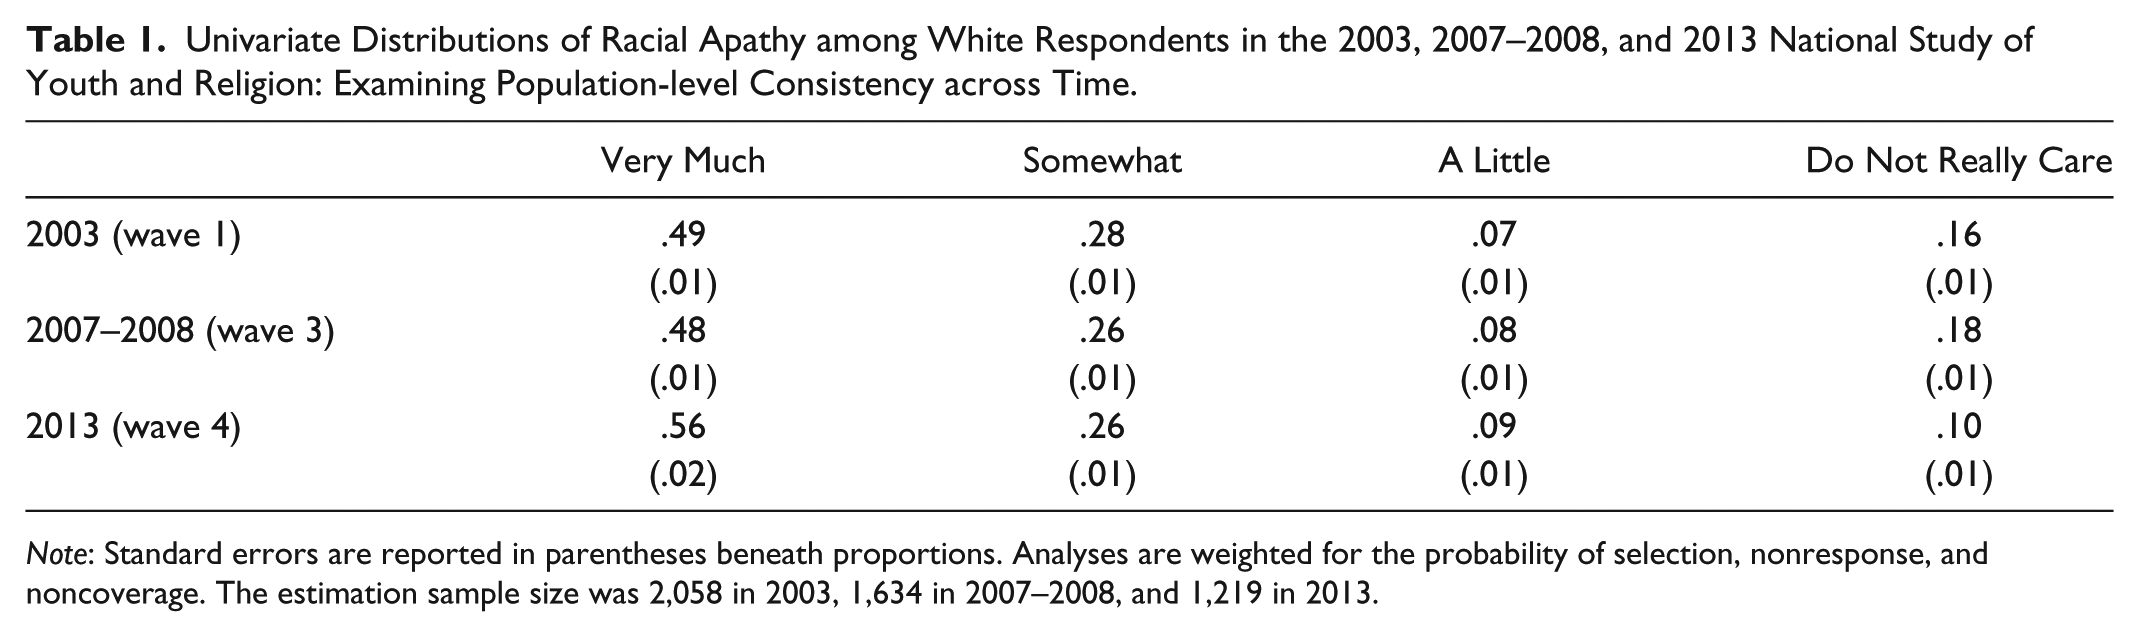
Note: Standard errors are reported in parentheses beneath proportions. Analyses are weighted for the probability of selection, nonresponse, and noncoverage. The estimation sample size was 2,058 in 2003, 1,634 in 2007–2008, and 1,219 in 2013.
Table 2 presents a weighted bivariate cross-tabulation of racial apathy by time. Using respondents present and with no missing data across all three waves (n = 1,143), we found that racial apathy and time were statistically dependent. Specifically, respondents who chose “do not really care” decreased from 14 percent to 10 percent between 2003 and 2013. Conversely, 51 percent of respondents said “very much” in 2003, whereas 57 percent said so in 2013. This cross-tabulation confirms that population-level racial apathy is stable, if not decreasing.
Bivariate Cross-tabulation of Racial Apathy among White Respondents in the 2003, 2007–2008, and 2013 National Study of Youth and Religion: Examining Population-level Consistency across Time.
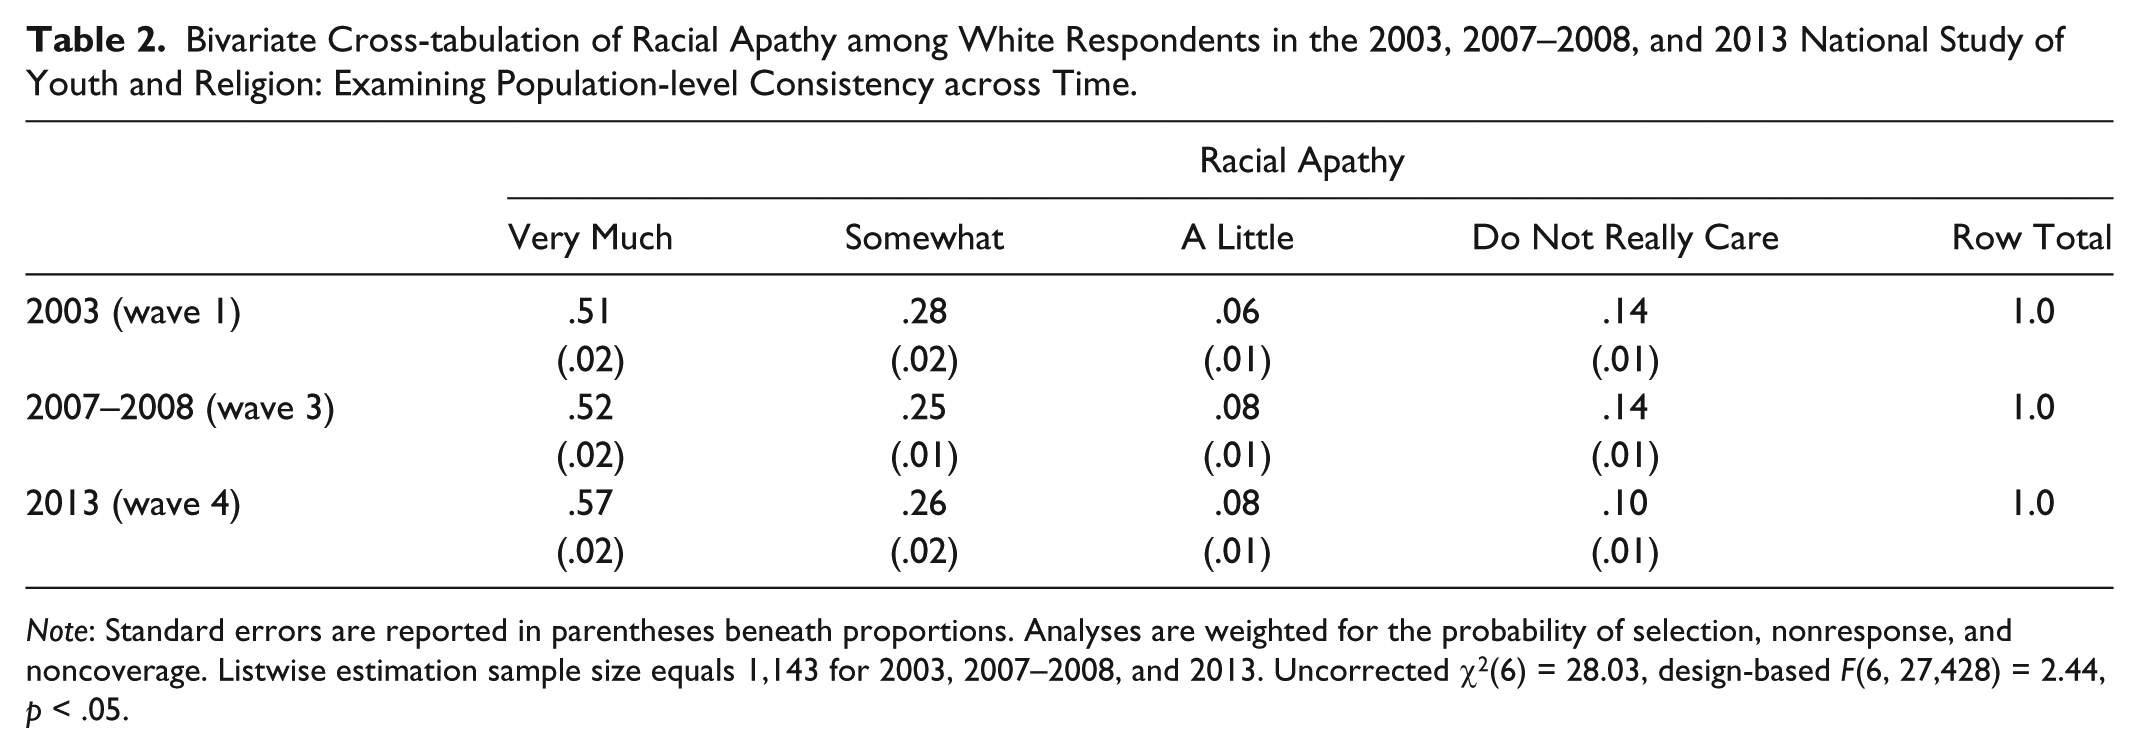
Note: Standard errors are reported in parentheses beneath proportions. Analyses are weighted for the probability of selection, nonresponse, and noncoverage. Listwise estimation sample size equals 1,143 for 2003, 2007–2008, and 2013. Uncorrected χ2(6) = 28.03, design-based F(6, 27,428) = 2.44, p < .05.
Table 3 presents a weighted bivariate cross-tabulation of racial apathy from 2003 to 2007–2008. It addresses whether respondents chose consistent responses across time (n = 1,614). Roughly 60 percent of respondents cared “very much” in 2003 and 2007–2008. About 11 percent of respondents who cared “very much” in 2003 selected “do not really care” in 2007–2008. Of respondents who said “somewhat” in 2003, 31 percent felt the same in 2007–2008. Approximately 39 percent of respondents who cared “somewhat” in 2003 stated “very much” by 2007–2008. Finally, about 31 percent of respondents who chose “do not really care” cared “very much” by 2007–2008. These results reveal low individual-level consistency in racial apathy.
Bivariate Cross-tabulation of Racial Apathy among White Respondents in the 2003 and 2007–2008 National Study of Youth and Religion: Examining Individual-level Consistency across Time.

Note: Standard errors are reported in parentheses beneath proportions. Analyses are weighted for the probability of selection, nonresponse, and noncoverage. Listwise estimation sample size equals 1,614. Uncorrected χ2(9) = 236.30, γ = .37, ASE = .03; design-based F(9, 20,758) = 12.81, p < .05.
Table 4 presents a weighted bivariate cross-tabulation of racial apathy from 2007–2008 to 2013. It shows whether respondents gave consistent responses across time (n = 1,207). Roughly 74 percent of respondents chose “very much” in 2007–2008 and 2013. About one third of respondents who said “somewhat” in 2007–2008 said the same in 2013. Nearly 40 percent of respondents who cared “a little” in 2007–2008 cared “very much” by 2013. More than one in four respondents who selected “do not really care” in 2007–2008 maintained that attitude in 2013. Of respondents who chose “do not really care” in 2007–2008, 26 percent said “very much” by 2013. Again, these results demonstrate low individual-level consistency in racial apathy.
Bivariate Cross-tabulation of Racial Apathy among White Respondents in the 2007–2008 and 2013 National Study of Youth and Religion: Examining Individual-level Consistency across Time.
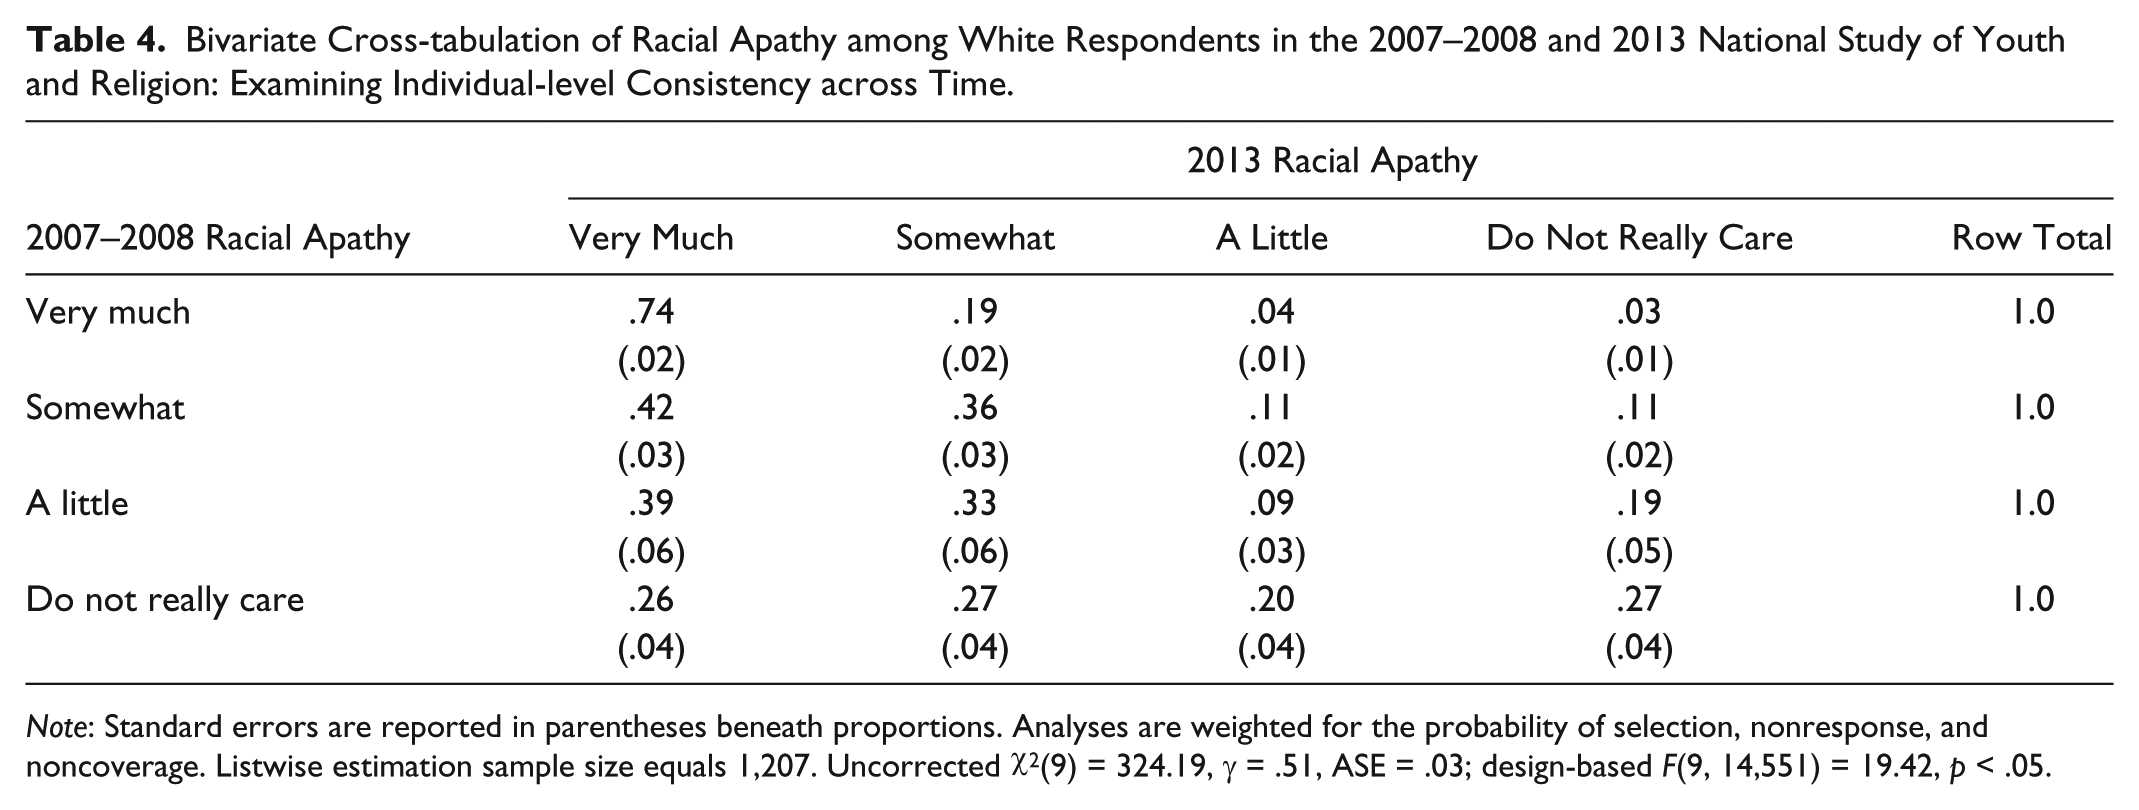
Note: Standard errors are reported in parentheses beneath proportions. Analyses are weighted for the probability of selection, nonresponse, and noncoverage. Listwise estimation sample size equals 1,207. Uncorrected χ2(9) = 324.19, γ = .51, ASE = .03; design-based F(9, 14,551) = 19.42, p < .05.
Table 5 presents a weighted bivariate cross-tabulation of racial apathy from 2003 and 2013. It shows whether respondents selected consistent responses across time (n = 1,208). Nearly 7 in 10 respondents who said “very much” in 2003 said “very much” in 2013. Among those saying they cared “very much” in 2003, only 5 percent chose “do not really care” in 2013. Considering respondents who said “somewhat” in 2003, 31 percent said “somewhat” in 2013, whereas 41 percent said “very much.” About 19 percent of respondents who stated they did not really care about racial equality in 2003 maintained that attitude, whereas 46 percent of respondents in the same group in 2003 said “very much” by 2013. Once again, we find low individual-level consistency.
Bivariate Cross-tabulation of Racial Apathy among White Respondents in the 2003 and 2013 National Study of Youth and Religion: Examining Individual-level Consistency across Time.

Note: Standard errors are reported in parentheses beneath proportions. Analyses are weighted for the probability of selection, nonresponse, and noncoverage. Listwise estimation sample size equals 1,208. Uncorrected χ2(9) = 145.87, γ = .30, ASE = .03; design-based F(8, 13,835) = 8.60, p < .05.
Table 6 presents estimates (i.e., coefficients and standard errors) from a weighted binary logistic regression of consistent responses to racial apathy on correlates capturing social background, academic orientation, interracial contact and relationships, and freedom of expression. Girls had .32 higher logits of consistent responses to racial apathy compared with boys. Age correlated marginally with .09 higher logits of consistent responses to racial apathy. Older respondents were more likely to give consistent responses. High levels of parental education predicted .20 higher logits of consistent responses to racial apathy. Compared to respondents with “somewhat conservative” or “very conservative” parents, those with “very liberal” or “somewhat liberal” parents had .49 higher logits of consistent responses to racial apathy. Educational aspirations correlated with .30 higher logits of consistent responses to racial apathy. Respondents who had ever dated interracially had .33 marginally higher logits of consistent responses to racial apathy than those who had never dated interracially. Compared with respondents who felt “a little” freedom to express their views on important issues, their counterparts who felt “a lot” had .97 lower logits of consistent responses to racial apathy. Grades, school difficulties, multirace household, different-race mentor, and homogenous religious services were nonsignificant correlates of consistent responses to racial apathy.
Estimates from Binary Logistic Regression of Consistent Responses to Racial Apathy on Social Background, Academic Orientation, Interracial Contact and Relationships, and Freedom of Expression among White Respondents in the 2003, 2007–2008, and 2013 National Study of Youth and Religion.

Note: Standard errors are reported in parentheses beneath coefficients. Estimates are weighted for the probability of selection, nonresponse, and noncoverage. Listwise sample size equals 1,143.
Excluded groups in the regression models.
p < .10, *p < .05, **p < .01, and ***p < .001 (two-tailed tests).
Table 7 presents estimates (i.e., coefficients and standard errors) from a weighted linear regression of level of relative consistency in racial apathy on correlates capturing social background, academic orientation, interracial contact and relationships, and freedom of expression, controlling for consistent responses (i.e., the outcome in Table 6). Compared with boys, girls had a .43 lower level of relative consistency in racial apathy. Parental education predicted a .20 lower level of relative consistency in racial apathy. Compared to respondents with “somewhat conservative” or “very conservative” parents, those whose parents reported a “middle of the road” political orientation had a .28 marginally higher level of relative consistency in racial apathy. Respondents with parents who had not thought much about or did not know their political orientation had a .57 higher level of relative consistency in racial apathy, compared to respondents with “somewhat conservative” or “very conservative” parents. Respondents reporting “all A’s or mostly A’s” had a .44 lower level of relative consistency in racial apathy compared with their peers. Educational aspirations correlated with a low level of relative consistency in racial apathy. Respondents with different-race mentors reported a .28 lower level of relative consistency in racial apathy compared with their peers. Attending “same-race services” predicted a .49 marginally higher level of relative consistency in racial apathy, compared with “do not attend” religious services. Consistent responses associated negatively with level of relative consistency in racial apathy, meaning those who offered consistent responses tended to be less apathetic. Age, school difficulties, multirace household, interracial dating, and freedom of expression did not associate with level of relative consistency in racial apathy.
Estimates from Linear Regression of Level of Relative Consistency in Racial Apathy on Social Background, Academic Orientation, Interracial Contact and Relationships, and Freedom of Expression among White Respondents in the 2003, 2007–2008, 2013 National Study of Youth and Religion.

Note: Standard errors are reported in parentheses beneath slope coefficients. Estimates weighted for the probability of selection, nonresponse, and noncoverage. Listwise sample size equals 1,143.
Excluded groups in the regression models.
p < .10, *p < .05, **p < .01, and ***p < .001 (two-tailed tests).
Discussion
This study contributes to a small but sociologically significant literature designating racial apathy as a contemporary form of white racial prejudice (Brown et al. 2019; Forman 2004; Forman and Lewis 2006, 2015). Racial apathy represents an ideological shift away from expressions of blatant antipathy (Bobo et al. 1997, 2012; Brown et al. 2009; Dovidio and Gaertner 1996; Esposito and Romano 2014; Forman and Lewis 2006; Henry and Sears 2002; Hunt 2007; Kinder and Sanders 1996; Kleinpenning and Hagendoorn 1993; McConahay and Hough 1976; Meertens and Pettigrew 1997; Pettigrew and Meertens 1995; Sears and Henry 2003; Williams et al. 1999). This ideological shift coincides with emergence of colorblindness and white indifference (Forman 2004; Bobo et al. 1997, 2012; Bonilla-Silva 2003; Mueller 2017).
Prior studies of racial apathy (Forman and Lewis 2006, 2015) had several weaknesses. For example, they relied on cross-sectional data or repeated cross-sectional data but drew conclusions about changes in racial apathy over time. They relied on survey data collected prior to the election of Barack Obama, which for many whites signaled that racism was no longer a barrier to success in the United States (Esposito and Finley 2009). They relied on a narrow range of correlates to explain variation in racial apathy. Finally, they did not operationalize racial apathy by asking whites directly whether they care about racial equality (see Brown et al. 2019). Consequently, we know little about racial apathy’s distribution at the population level, whether individuals express racial apathy consistently across time, what its correlates are, and how we should measure it.
Using three waves of panel data (i.e., 2003, 2007–2008, and 2013) from the NSYR, we found patterns indicating strong population-level consistency concurrent with weak individual-level consistency in racial apathy. By population-level consistency, we mean that the univariate distributions of racial apathy remained stable across wave 1, wave 3, and wave 4. Examining each wave in turn (see Table 1), respondents tended to care “very much.” When restricting the estimation sample to respondents present and with no missing data across all three waves, a nearly identical pattern emerged (see Table 2). In bivariate cross-tabulations by wave (see Tables 3–5), we found considerable individual-level variation in racial apathy, meaning that respondents’ expressions of racial apathy changed across time. For example, 31 percent of whites who did not really care about racial equality in 2003 cared “very much” in 2007–2008 (see Table 3). Only 36 percent of respondents who cared “somewhat” in 2007–2008 cared “somewhat” in 2013 (see Table 4). Finally, 45 percent of respondents who cared “a little” in 2003 cared “very much” by 2013 (see Table 5). These findings contradict Forman and Lewis’s (2015) claim that racial apathy is increasing. These findings also suggest maturing whites can evolve to care personally about racial equality. Finally, these findings illustrate that contemporary white racial prejudice may be “more porous and potentially modifiable,” and may be increasingly multidimensional and context dependent (Bobo et al. 2012:75).
We also explored correlates of individual-level consistency in racial apathy. Overall, few correlates were statistically significant. Considering the binary consistent responses outcome (where only 31 percent of respondents gave identical responses over time; see Table 6), girls were more likely to give consistent responses to racial apathy, compared with boys. Age positively predicted consistency. Furthermore, high parental education correlated directly with consistent responses. Respondents with “very liberal” or “somewhat liberal” parents were more likely to give consistent responses compared to their peers with “somewhat conservative” or “very conservative” parents. Educational aspirations associated positively with consistent responses to racial apathy. Interracial dating associated directly with consistent responses. Finally, respondents with “a lot” of freedom to express their views were less likely to give consistent responses to racial apathy, compared with respondents with “a little” freedom.
Considering the level of relative consistency in racial apathy (see Table 7), girls and respondents with highly educated parents expressed a low level of relative consistency. Compared to respondents with “somewhat conservative” or “very conservative” parents, those whose parents were “middle of the road” or had not thought much about or did not know their political orientation expressed a high level of relative consistency in racial apathy. Grades and educational aspirations predicted a low level of relative consistency in racial apathy. Different-race mentor and homogenous religious services were statistically meaningful correlates of relative consistency. Specifically, when the racial apathy of respondents with different-race mentors shifted, it trended downward. In contrast, respondents who attended homogenous religious services expressed a high level of relative consistency. Overall, we need a broader range of correlates to explain variation in individual-level consistency in racial apathy.
Future Directions and Limitations
We envision several next steps for scholars interested in the sociological meaning and significance of racial apathy. First, scholars should explore additional correlates (see Brown et al. 2019). For example, we need studies that examine time-variant correlates, which might better predict fluctuations in racial apathy. Second, although we use recent data, changes in the sociopolitical climate, including the election of Donald J. Trump in 2016, mandate that we collect data today. Third, we introduced a new (and arguably ideal) measure of white racial apathy. Future research should investigate other ways of operationalizing racial apathy. For example, if respondents believe that whites are discriminated against, then our measure might tap respondents’ concerns about white racial disadvantage relative to blacks and Latinos. Fourth, sociologists must not lose sight of the fact that attitudes are just attitudes. Researchers’ conclusions about increasing racial tolerance among whites on the basis of survey data trends are irresponsible intellectually (and morally) in the face of enduring disparities in health, wealth, education, and incarceration. Fifth, how racial apathy associates with cultural and neoliberal explanations for racial inequality (e.g., blacks’ deficiencies in work ethic or perseverance; see Hunt 2007) remains an open question. Future research must address how specific explanations for black-white disparities correlate with racial apathy. Finally, NSYR respondents were teenagers at wave 1 and approached their 30s by wave 4. Scholars should examine racial apathy among older whites. It may be that racial apathy becomes a consistent attitude later in the life course.
Conclusions
Using three waves of NSYR panel data, we demonstrate that the population-level distribution of racial apathy appears consistent in 2003, 2007–2008, and 2013. Hidden within this population-level consistency is the fact that most white respondents (i.e., 69 percent) move between racial apathy categories over time. Our analyses identify few correlates of individual-level consistency in racial apathy. We conclude that longitudinal data are necessary to estimate whether racial apathy remains consistent across time and is a contemporary form of white racial prejudice. The current sociopolitical climate and growing intergroup antagonism in the United States mandate future studies of racial apathy. As has always been the case, whites’ distaste for antiracism work and reluctance to acknowledge their privilege are primary obstacles to this nation becoming a more perfect union.
Footnotes
Acknowledgements
We thank members of the Racism and Racial Experiences (RARE) Workgroup at Rice University for their critical feedback on an early draft and perpetual encouragement.
Funding
The author(s) disclosed receipt of the following financial support for the research, authorship, and/or publication of this article: The NSYR was generously funded by the Lilly Endowment, under the direction of Christian Smith, of the Department of Sociology at the University of Notre Dame, and Lisa Pearce, of the Department of Sociology at the University of North Carolina at Chapel Hill.
Author Biographies
![]() ).
).