
Abstract
Researchers rely on metadata systems to prepare data for analysis. As the complexity of data sets increases and the breadth of data analysis practices grow, existing metadata systems can limit the efficiency and quality of data preparation. This article describes the redesign of a metadata system supporting the Fragile Families and Child Wellbeing Study on the basis of the experiences of participants in the Fragile Families Challenge. The authors demonstrate how treating metadata as data (i.e., releasing comprehensive information about variables in a format amenable to both automated and manual processing) can make the task of data preparation less arduous and less error prone for all types of data analysis. The authors hope that their work will facilitate new applications of machine-learning methods to longitudinal surveys and inspire research on data preparation in the social sciences. The authors have open-sourced the tools they created so that others can use and improve them.
Social scientists working with public data rely on metadata systems to navigate, interpret, and prepare data sets for analysis. Metadata systems are critical research infrastructure: they provide researchers with an overview of the data, enable them to make informed choices about data preparation (recoding responses, dropping observations, etc.), and scaffold other crucial data processing steps that precede statistical modeling. Traditionally, metadata systems in the social sciences have been formatted as sets of questionnaires, codebooks, and other written documentation. Learning to use these materials proficiently is widely considered a “massive professional investment” (Abbott 2007; also see Freese 2007), particularly for researchers working in areas that draw heavily on data collected through complex, longitudinal survey designs.
Recently, researchers across the social sciences have begun to analyze data in new ways by applying techniques from machine learning. Algorithmic approaches to specifying models and selecting variables have been used to enhance existing approaches in explanatory social research, and techniques designed for optimal predictive modeling and data exploration open social science to a complementary set of analytic goals (Athey forthcoming; McFarland, Lewis, and Goldberg 2014; Mullainathan and Spiess 2017; Watts 2014). Yet machine-learning methods also amplify the costs and challenges of data preparation. Existing metadata systems can support standard methodological approaches in survey research, in which researchers typically construct models using a small number of variables. But these systems do not scale well to machine-learning methods, a setting in which researchers regularly work with hundreds or thousands of variables. As machine-learning methods become more popular, researchers will need to design new metadata systems that can facilitate the use of these techniques.
In this article, we explore one approach to designing metadata systems: treating metadata as data. As we describe in more detail below, this design principle emerged from observing the experiences of participants in the Fragile Families Challenge (FFC; for more on the FFC, see the introduction to this special collection) as they attempted to navigate the metadata system for the Fragile Families and Child Wellbeing Study (FFCWS). As we observed FFC participants, a unifying theme emerged: the task of preparing the data was a major obstacle, often preventing users from engaging more fully in the predictive modeling task at the heart of the challenge. Participants reported substantial difficulty in extracting basic information about each variable, frequently requested machine-readable metadata that were not available at the time of the FFC, and occasionally attempted to construct important metadata fields (e.g., variable types) independently. Our subsequent redesign of the FFCWS metadata system follows their lead: we transformed a human-readable set of PDF documents into a machine-actionable system organized around a single comma-separated value (CSV) file, containing comprehensive metadata on all variables collected since the start of the study. The redesigned system standardizes existing variables, provides an expanded set of metadata fields that reveal the data creators’ previously tacit knowledge about each variable, and makes the metadata available in a wide range of formats that support both manual and automated reading. This new metadata system streamlines the task of preparing FFCWS data for analysis, and we hope that it inspires future work to better scaffold new forms of data analysis in the social sciences.
Our particular contribution to the broader problem of metadata system design is twofold: we specify a few ways that the architecture of traditional metadata systems can make data preparation difficult, and we highlight data preparation as an essential yet relatively underexamined part of the research process. We hope that these insights are useful for working researchers, data creators, methodologists, funders, and anyone else interested in addressing obstacles to methodological progress in the social sciences. We view our work as complementary to works that advocate metadata standards (e.g., the Data Documentation Initiative; see Vardigan 2013), offer general tools for data preparation (e.g., Wickham 2014), and situate machine-learning methods in the social sciences (e.g., Athey forthcoming; Evans and Aceves 2016).
The rest of the report proceeds as follows. We begin by reviewing how data pipelines are typically organized in social science research with longitudinal survey data. To illustrate concretely how the organization of metadata can hinder data users, we next discuss what happened when FFC participants—a large, heterogeneously trained group of researchers—attempted to apply a broad range of machine-learning techniques to FFCWS data in ways that were never envisioned by its creators. We then review our efforts to make these data more amenable to a wider range of modeling tools. We conclude by outlining future goals for research on metadata systems.
Data Pipelines in Survey Research
To understand some of the key obstacles to incorporating machine-learning techniques into social science research, it is helpful to understand how data processing is typically organized in survey research, particularly research that makes use of large, public, longitudinal survey data sets. Figure 1 depicts an idealized data pipeline.
1
In the first part of the pipeline, information is collected about the world and organized into data. Next, researchers use these general-purpose data to prepare analytic data sets, which are customized for particular research questions and modeling techniques. Researchers conduct data analysis with these data sets to estimate quantities of interest. For the most part, research in this area involves estimating and interpreting regression coefficients (

Idealized data pipeline: collecting, preparing, and modeling.
There is a great deal of variation in how the work of data processing is divided up. Where possible, many social scientists collect their own data; this is especially common among researchers who use qualitative, historical, and experimental methods. In contrast, many fields of social research rely on a division of labor between the data creator and the data user. This is especially common when answering important questions requires longitudinal data collection, that is, data collection that follows many units over a long period of time. For example, to examine the intergenerational transmission of wealth or the development of parent-child relationships, researchers need repeated measures of key characteristics of many families over many years. Collecting these data from scratch for each researcher would be prohibitively expensive and would not yield results in a timely manner.
To better facilitate research that requires longitudinal data, government agencies and philanthropic foundations have funded public, general-purpose data sets for social research (Converse 1987; Igo 2007). Examples include the Panel Study of Income Dynamics (since 1968), the National Longitudinal Study of Adolescent Health (since 1994), and the FFCWS (since 1998). These studies are designed to support research by many different scholars on a wide range of topics. For example, FFCWS data have been used by thousands of researchers in more than 800 publications since the beginning of the study. 2 These public data resources enable a style and volume of research inquiry that would not otherwise be possible (Lazarsfeld 1962).
The separation of data creation from data use facilitates research on a wide range of phenomena, but it also introduces a number of practical issues. Creating a public longitudinal survey data set involves many decisions about data collection and (subsequently) extensive quality control, often requiring months or years of work before the data are seen by any data user. Data users often need to know about these aspects of the data to prepare an analytic data set properly. Thus, in addition to ensuring that the data are high quality and free of errors, creators of public data try to provide as much assistance as possible to data users in constructing analytic data sets. One common way of rendering this assistance is to provide and maintain metadata—data about data—that describe important aspects of the data. Traditionally, social scientists format metadata as a set of written documents: codebooks, questionnaires, crosswalks, and so on. These guides make it possible for data users to take the design of the survey into account when preparing an analytic data set. In short, metadata enables data users and data creators to overcome some key obstacles to sharing resources at a distance (Edwards et al. 2011).
Unfortunately, the process of preparing an analytic data set is time consuming and error prone. Many researchers consider data preparation to be the most time-consuming step in research; informally, some estimate that it consumes about 80 percent of the time spent on data analysis (e.g., Donoho 2017). In addition to being time consuming, this process can be error prone. Several articles in major journals that have been critiqued, corrected, or even retracted because of possible errors in data preparation (see, e.g., Herring 2009, 2017; Jasso 1985, 1986; Kahn and Udry 1986; Munsch 2018; Stojmenovska, Bol, and Leopold 2017). It is likely that these published errors represent just a fraction of the total number of errors introduced during data preparation.
Although statisticians and computer scientists have developed techniques for transforming data (e.g., Wickham 2014), the provision and use of metadata in this setting remains without a comparable data science. Our sense is that improved metadata infrastructure for conducting data preparation would improve the quality of research with complex survey data using standard methods. Additionally, as social scientists adopt a wider range of analytic techniques, principled metadata design will become increasingly necessary to make systematic data preparation tractable. Document-based metadata systems work well for data preparation with a small number of variables, but in the high-dimensional data settings common to research using machine-learning techniques, these tools become difficult to navigate effectively. To frame these design issues concretely, we next introduce our case study: the FFCWS and the FFC.
Data and Metadata in the FFC
The complexity of longitudinal surveys and the design of metadata systems that describe them can be problematic for social scientists trying to use these data for research. To ground our discussion of these issues in a concrete case, we briefly review the design of the FFCWS and the organization of the FFC, which we use as a case study in the next section. We emphasize aspects of FFCWS and the challenge that illustrate why the task of data processing becomes intractable in the context of applying machine-learning methods to social science data. For greater detail on the scientific goals of the FFC in general, see the introduction to this special collection.
The FFCWS
The FFCWS is a longitudinal, birth-cohort study of nearly 5,000 children born in large U.S. cities between 1998 and 2000. The study involves a multistage probability sampling design with an oversample of nonmarital births (for additional details on the sampling design, see Reichman et al. 2001). The study’s sampling strategy was designed to enable research on the characteristics and capabilities of unmarried parents and the impact of family structure on parents and children. Figure 2 depicts the full data collection schedule.
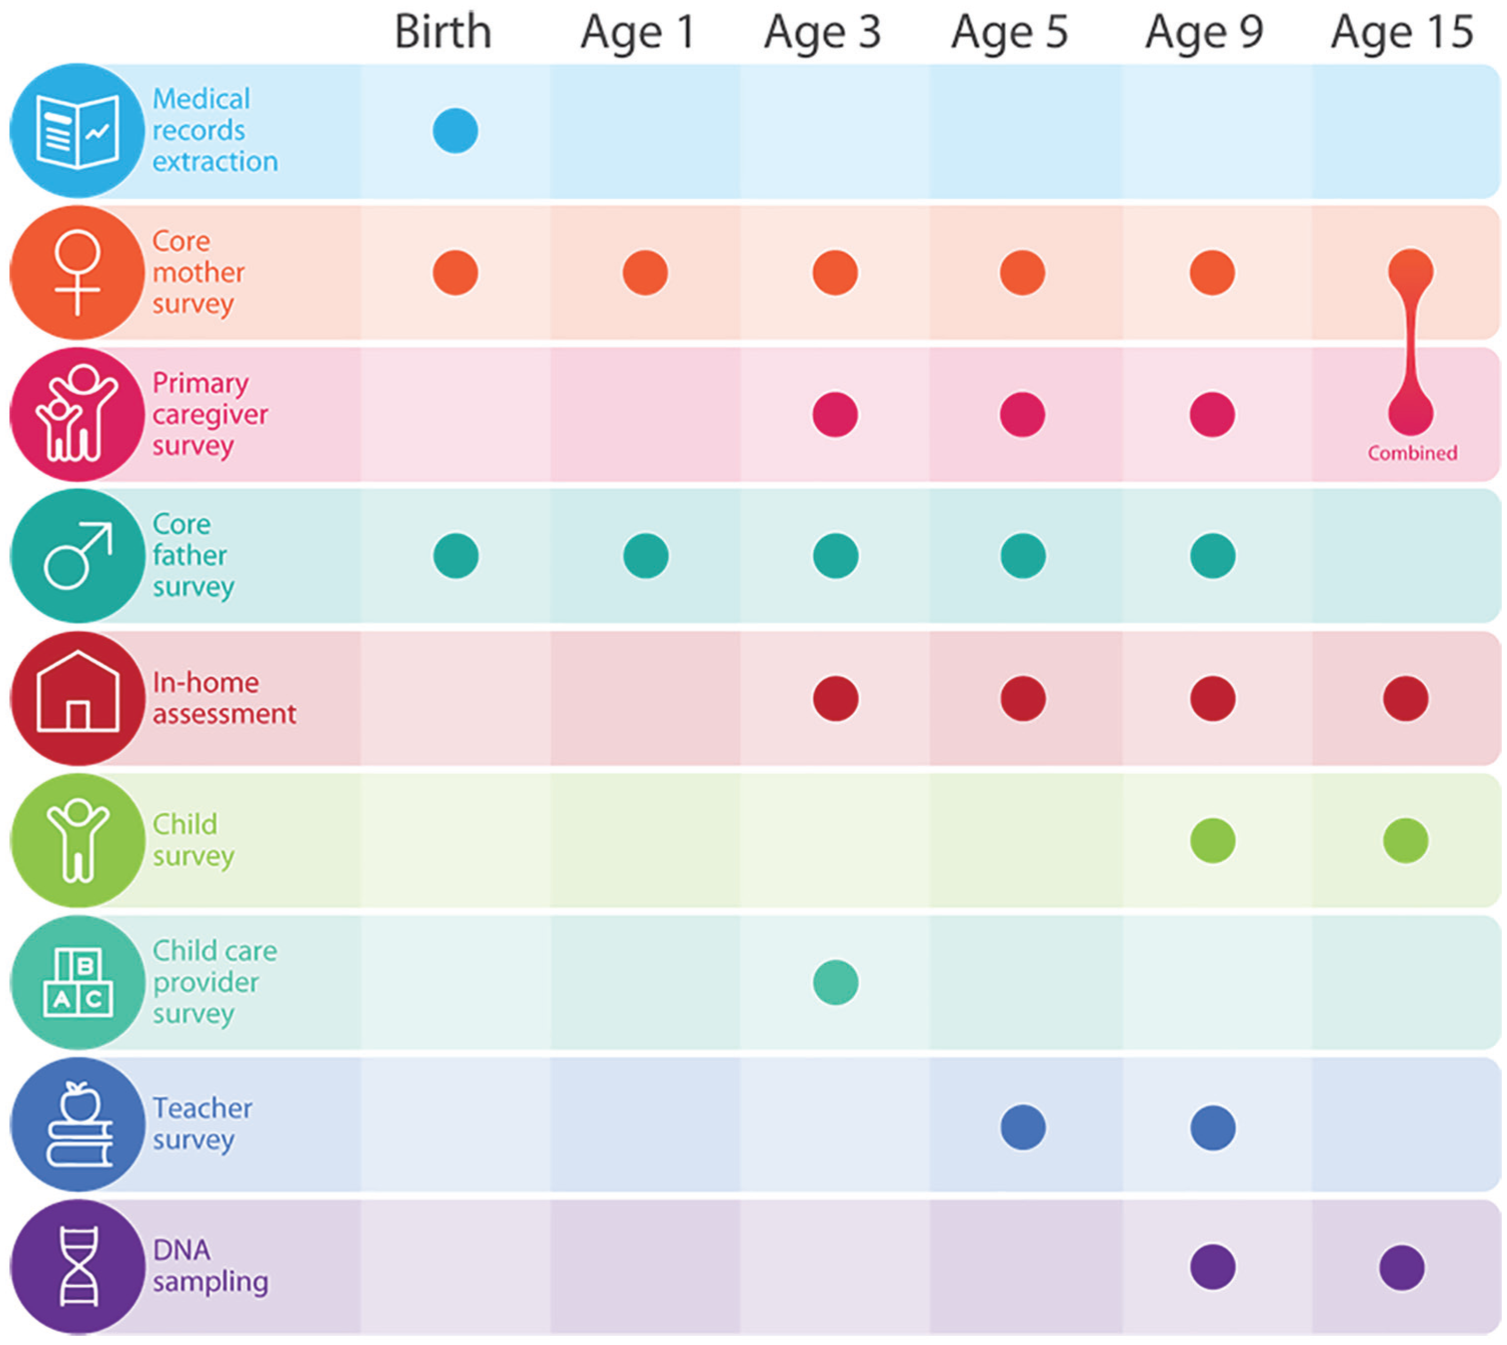
Fragile Families and Child Wellbeing Study data collection schedule. Medical records and DNA sampling are included for completeness, but were not part of the Fragile Families Challenge data set.
Data collection began with initial interviews with mothers and fathers in the hospital at the time of their children’s birth and then continued for five follow-up waves at roughly the children’s 1st, 3rd, 5th, 9th, and 15th birthdays. Each wave of data collection involved a “core” of survey interviews with parents, typically conducted over the phone. Additional activities were conducted to supplement the core interviews, including surveys of child care providers and teachers, home visits (with cognitive and anthropometric assessments and interviewer observations of the home environment), medical record extraction, and collection of saliva samples from mothers and children for genetic analysis.
The scope and complexity of the FFCWS has grown considerably over the past 20 years, both organizationally and scientifically. A consortium of 25 government agencies and private foundations provided funding over this time, and three survey firms oversaw field work and data collection. A large team of researchers served as investigators and collaborators on the core study and directed the addition of supplemental studies to the core parent interviews. Between birth and age 9, each wave involved progressively more data collection per family. The baseline wave of data collection involved two short, 30-minute interviews with biological parents following the birth of their children, and the resulting data set from these interviews contains approximately 900 variables. By the age 9 follow-up, however, the complexity had increased. In the age 9 wave, family members participated in up to nearly five hours of activities, and the resulting data set contains more than 3,200 variables. The data are canonically stored as Stata data files and provided to users in a variety of commonly used data formats.
To use these data effectively, researchers must understand how they were collected. The FFCWS previously made these metadata available to researchers on the study’s Web site in a large set of separate documents. These documents include copies of survey instruments, user’s guides, scales documentation, guides to survey weights, questionnaire maps, additional supplemental memos for particular files from home visit activities, and Stata codebooks that provide variable names, labels, and frequencies of responses to each individual question. Many of these resources are separately provided for each respondent and wave; for example, each wave and component (such as the mother’s baseline questionnaire) has its own codebook. Tables 1 and 2 compare data and metadata for the FFCWS (both before and after the changes described in this article) with several comparable large longitudinal surveys; Table 1 compares available metadata fields, and Table 2 compares metadata release formats.
Comparison of Metadata Fields Available (as of 2018) from Several Major Longitudinal Surveys.
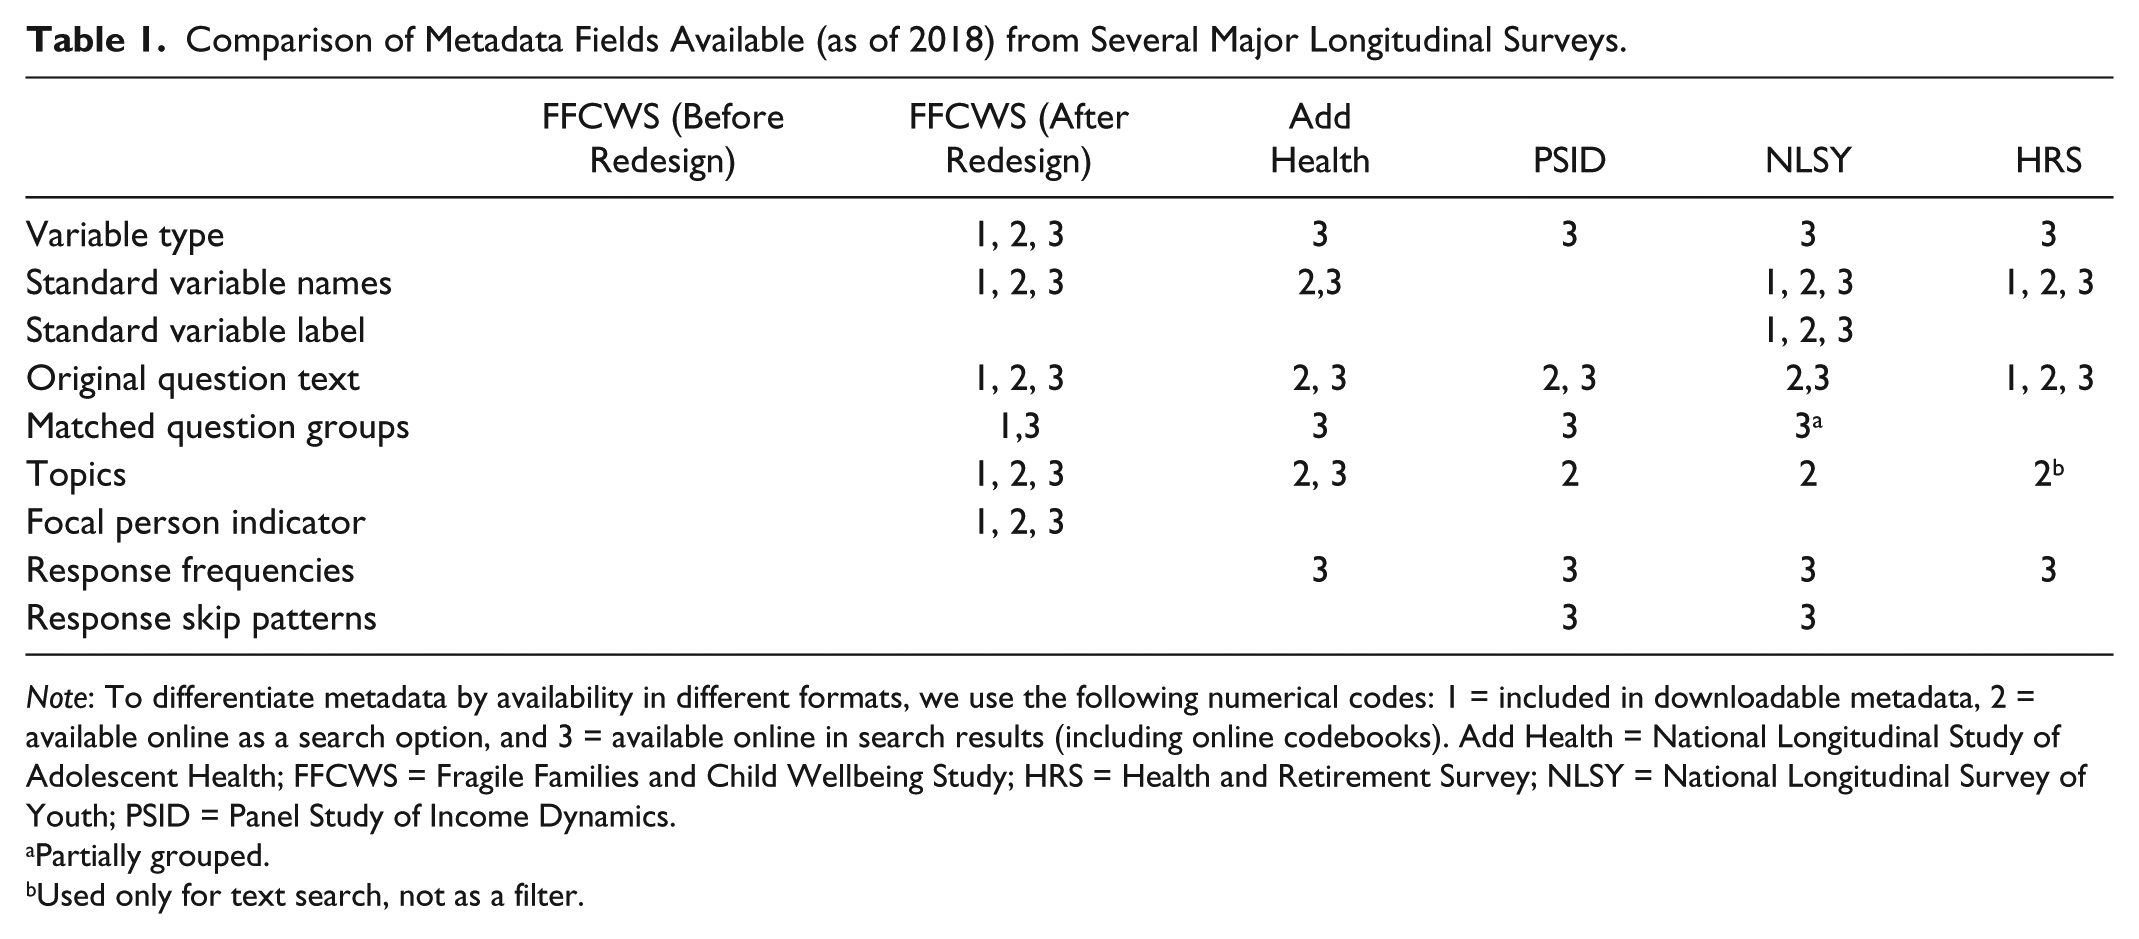
Note: To differentiate metadata by availability in different formats, we use the following numerical codes: 1 = included in downloadable metadata, 2 = available online as a search option, and 3 = available online in search results (including online codebooks). Add Health = National Longitudinal Study of Adolescent Health; FFCWS = Fragile Families and Child Wellbeing Study; HRS = Health and Retirement Survey; NLSY = National Longitudinal Survey of Youth; PSID = Panel Study of Income Dynamics.
Partially grouped.
Used only for text search, not as a filter.
Comparison of Metadata Release Formats (as of 2018) among Several Major Longitudinal Surveys.

Note: Add Health = National Longitudinal Study of Adolescent Health; API = application programming interface; FFCWS = Fragile Families and Child Wellbeing Study; HRS = Health and Retirement Survey; NLSY = National Longitudinal Survey of Youth; PSID = Panel Study of Income Dynamics.
Variable names only.
The FFC
The FFC was a mass collaboration that applies the common task framework (CTF; see Donoho 2017) to a prediction problem using the FFCWS data. In the CTF, participants are invited to predict a common set of outcome measures in a held-out test data set using a training data set available to all participants. Predictions are evaluated using a common metric (in this case, mean squared prediction error on the held-out data), and a small subset of the test data is made queryable in the form of a public “leaderboard,” allowing participants to check their progress and evaluate their modeling performance against other submissions’ scores. Previous collaborations using the CTF have achieved improved predictive performance (Bennett and Lanning 2007) and yielded important scientific and methodological insights (Feuerverger, He, and Khatri 2012). The FFC was designed to explore whether the CTF might productively scaffold collaboration and enable new forms of inquiry in the social sciences.
Figure 3 depicts the organization of the data in the FFC. The prediction task posed to challenge participants was as follows: using FFCWS data describing children and their families up to age 9 and a set of training outcomes from the age 15 data (white boxes), predict six key outcomes in a held-out subset of the age 15 data (gray boxes). The six key outcomes were the grade point average of the child, a measure of the child’s “grit,” the family’s exposure to material hardship, whether the family had recently been evicted from their home, whether the child’s primary caregiver had recently participated in job training, and whether the primary caregiver had lost his or her job. (The choice of outcomes was dictated by both scientific goals and ethical considerations; more detailed descriptions of each outcome are available in the introduction to this special collection.) One eighth of the observations were made queryable on the public leaderboard, and the remaining three eighths of the observations were unopened until they were used to produce final scores for all submissions at the end of the FFC. The held-out portion of the data is a critical aspect of the CTF setup, and we note here that all ongoing longitudinal social surveys present the possibility of constructing a held-out data set at each wave.

Data structure used in the Fragile Families Challenge. Participants receive Fragile Families and Child Wellbeing Study variables (features) and are asked to construct predictive models using the provided outcome data (training). For half of the observations, outcomes are withheld to enable iterative model development (leaderboard) and final out-of-sample evaluation (holdout).
Although we did not originally set out to improve the FFCWS metadata at the conclusion of the FFC, several features of the challenge made the limitations of the existing system salient. A key part of what made the challenge technically difficult for participants was the high-dimensional (or “wide”) nature of the FFCWS data, meaning that it has more variables than observations. Standard regression techniques like ordinary least squares or logistic regression are not capable of automatically handling high-dimensional data, so the process of generating predictions necessarily requires some form of variable selection. Data users might try manually conducting variable selection in a systematic way (i.e., guided by theory), or they might use an automated technique (e.g., least absolute shrinkage and selection operator) to determine which variables are most predictive of the outcome. Both approaches require using metadata. For example, properly handling missing observations requires knowing the type of each variable, selecting variables on the basis of theory requires knowing the substantive content of each variable, and taking advantage of repeated questions across waves requires knowing which variables correspond to repeats.
The size and heterogeneity of the FFC’s participant group exposed the data to a wider range of analytic methods than those typically used in prior research. In the past, a typical researcher using the FFCWS data built regression models using tens of variables. During the challenge, the typical participant tried to build models using thousands of variables. In the low-dimensional setting, matching questions across waves or identifying the variable types is a tractable task; in the high-dimensional setting, these tasks are practically impossible to complete manually. Data preparation, previously a doable (if time-consuming and error-prone) task, became an intractable barrier to high-quality statistical analysis. In the following section, we describe the most common data preparation problems participants faced when attempting to deploy machine-learning methods and then describe the metadata design solutions we developed to address them.
Our redesign was informed by watching and learning from participants in the FFC. We accomplished this in several ways. First, we ran six “getting started” workshops, which typically lasted three hours (one hour was devoted to instruction, and two hours were devoted to helping participants as they began working with the data). 3 Second, we provided assistance through weekly virtual office hours and an FFC e-mail address. Third, at the end of the challenge, we conducted six informational interviews with dedicated participants in which we asked about their approaches to the challenge as well as any technical obstacles they faced. Fourth, we reviewed the code of many challenge submissions to get a better sense of the kinds of software tools participants were applying to the data. Finally, we hosted a two-day workshop at which challenge participants presented their modeling approaches and provided direct feedback on prototypes of the redesigned metadata system. What we learned from these interactions shaped our decision to redesign the FFCWS metadata system and informed the specific modifications we undertook.
Improving FFCWS Metadata
We found that FFC participants encountered substantial roadblocks as they attempted to undertake six common data preparation tasks. These tasks included (1) accounting for variable types; (2) standardizing response encodings, especially missing value codes; (3) parsing respondent and wave data from variable names; (4) matching similar questions across respondents and waves; (5) identifying variables related to substantive or theoretical interests, in this case content related to the challenge’s six target outcomes; and (6) incorporating metadata into analysis procedures in a reproducible way. Each of these roadblocks motivated our redesign of the FFCWS data and metadata (see Figure 4). Specifically, we undertook four tasks: (1) standardizing the canonical FFCWS data files; (2) producing new metadata and reorganizing existing metadata, both in machine-actionable formats; (3) integrating automated tests throughout the data/metadata system; and (4) creating tools to facilitate access to the metadata for users with a wide range of technical backgrounds.

Overview of Fragile Families and Child Wellbeing Study metadata system changes. Written documentation and implicit knowledge have been rebuilt into a single comma-separated value file, a series of automated tests, and multiple release formats.
Standardizing Canonical Data Files
As described above, FFCWS data were assembled incrementally over a long period of time and by a diffuse set of research teams. This data collection process resulted in a number of discontinuities in the format of important data fields across waves and respondents in the survey. In particular, different parts of the FFCWS data followed different standards for naming variables and encoding missing values. We found that these inconsistencies were a major obstacle to users as they attempted to use the data to generate predictions. However, because these data are already used in existing data pipelines, we could not recode them in a way that overwrote the old data. Doing so would risk introducing breaking changes to the data system. Although breaking changes are not universally unacceptable, we hesitated in this context because making these changes might have caused silent errors in existing code. As a result, in addressing these data consistency issues, we aimed to strike a balance between standardization and backward compatibility.
Variable Names
In data releases prior to the FFC, FFCWS “core” variables were named according to a pattern that encoded metadata about the respondent, study wave, questionnaire section, and question number. 4 This naming pattern is advantageous because it provides users with an index into the documentation, which is split into separate documents according to respondent and wave and internally organized according to the number and section of each question. Unfortunately, this naming convention was not applied universally across extensions to the core surveys, such as the wave 3 and wave 4 in-home visit activities, child care provider surveys, and teacher surveys. For example, in the survey of child care centers conducted at wave 3, variables were assigned a prefix of ffcc_centsurvey_ followed by the section of the question and its number, each separated with underscores. This prefix contained no indication of the wave in which these data were collected. Similar issues occurred across consecutive waves as nomenclature changed over time. In wave 4, for example, the prefix for the teacher survey was kind_ (short for “kindergarten”), whereas the teacher survey in wave 5 was t (short for “teacher”).
To resolve this problem, we standardized all variable names in the FFCWS data. Building on the advantages of the existing variable naming scheme used with the core variables, we decided that a user should be able to infer the following information from the variable name: (1) when the survey was administered (i.e., wave number), (2) which respondent or survey was the source of the variable (e.g., mother, in-home activities), (3) whether the variable was collected from a questionnaire or constructed by researchers, and (4) for variables collected from a questionnaire, where in the survey the question was asked. This approach retains the advantages of the existing naming scheme (including users’ prior familiarity with commonly used variables) while incorporating variables collected in add-on studies more fully into the data. We additionally retained the old variable name as a separate field in the new metadata to support legacy data pipelines. In Appendix A, we provide more information about the process we used to arrive at our final naming scheme as well as additional examples.
Missing Data Codes
Prior to the FFC, all core FFCWS variables had standard missing data codes, while some variables from extensions to FFCWS did not. These codes (negative-valued, as is typical in social science data) provided information about why a response was not available. Discrepancies in the coding of these values made it difficult to use standard strategies for handling missing data (e.g., imputation) or to take advantage of the information contained in a meaningfully missing response. After the FFC, we standardized all missing data codes to match the missing data codes on the core variables. These codes are summarized in Table 3. In Appendix A, we discuss our process in more detail.
Standard Missing Data Codes.

Creating Machine-Actionable Metadata
In addition to identifying several problematic features of the canonical data files, FFC participants often requested metadata that did not yet exist in formats readily amenable to computational analysis. Several of these requests were repeated across participants, prompting us to learn more about why users needed them. After the end of the challenge, we developed several new metadata fields for each variable. Our goal with creating these new fields was to make it easier and more reliable for users from a wide range of backgrounds to explore the available data and select variables for further analysis.
Variable Types
Many FFC participants requested metadata describing the variable type (e.g., continuous, categorical, binary) of each of the 12,942 variables in the challenge file. Users wanted to use these metadata to make informed decisions about how to transform the variables for analysis, particularly unordered categorical variables of theoretical interest (e.g., race). However, these metadata were not available at the time of the FFC. As a result, many participants were forced to spend time building rough heuristics for guessing which variables were categorical and which were continuous. Although the variable type is sometimes ambiguous, in general a standardized variable type label can capture the majority of cases unproblematically. After the challenge, we classified each variable as belonging to one of five different types: continuous, unordered categorical, ordered categorical, binary, and string. 5 The procedures that we used to make these classifications are described in Appendix B.
Warning Flags
In the process of assigning variable types, we encountered some variables with unexpected response orderings. For example, the variable m5k10b records information about the number of times the mother reports putting her child in time-out and has the following response options:
1 = once
2 = twice
3 = 3-5 times
4 = 6-10 times
5 = 11-20 times
6 = more than 20 times
7 = yes but not in the past year
8 = this has never happened
Note that the last two options are out of order: options 7 and 8 are clearly not greater than option 6. Thus, to use m5k10b as an ordered categorical variable would require reordering the answer options. We decided not to fix issues such as this (i.e., by reordering categorical variables), because doing so would introduce breaking changes: code that used to run on the data would either cease to run entirely or (even worse) would run but produce markedly different results.
Rather than trying to remove these inconsistencies, we have marked these variables and other variables with similar potential for causing analytic pitfalls with an explicit warning flag. This example of misordered response options is one of six different types of warning flags. These warning flags are stored alongside the other metadata, and we also explicitly highlight warnings in our Web application (more on release formats later). Our intent is to help researchers to address any response coding issues prior to conducting data analysis. Appendix B describes the six warning flags and our process for creating them in further detail.
Grouping Similar and Identical Questions
A key advantage of panel data sets such as the FFCWS is the ability to track how individuals’ responses to the same question change over time. In the previous iteration of the FFCWS metadata, there was no way of quickly identifying similar or identical questions across waves. Instead, data users were required to search through questionnaires manually. To address this issue, we developed a partially automated process for identifying similar variables on the basis of the variable’s label (a short description of its content) and its text in the questionnaire. Each set of related variables has been marked as a group, where each group contains one or more variables that are identical, similarly phrased, or otherwise substantively related. Appendix B describes our process in more detail.
Variable Topics and Subtopics
In the context of the FFC as well as in the routine use of FFCWS data, many users requested information on which variables relate to particular areas of substantive interest. At the time of the challenge, this information was spread out across multiple documents, including files on constructed scales, user guides, and the questionnaires themselves. After the challenge, we added topic tags that describe the thematic content of each variable. By providing an explicit bird’s-eye view of the content of the survey data, substantive expertise about the data that was previously available only through extensive review of the documentation or one-on-one communication with study staff members can be made more widely accessible.
As we completed the topic-tagging process and discussed this work with FFC participants, we found that there was a trade-off between general comprehensibility and technical accuracy when creating topical categories. More granular categories provided a higher fidelity window into the substantive scope of the FFCWS data, but many new data users were more interested in coarser categories (e.g., health or parenting). To provide experienced users with useful tools for making distinctions in the data without overwhelming new users, we decided to hierarchically group categories into larger thematic areas. For example, we created a “demographics” topic for a variety of more specific subtopics, such as “age” and “race/ethnicity,” and an “education and school” topic including subtopics for “school characteristics,” “student experiences,” “parent-school involvement,” and others. We provide the full list of topics and subtopics and describe the process of creating them in Appendix B.
Focal Person
In FFCWS, respondents have often been asked to report information about other people besides themselves. As a result, the respondent of the question is not necessarily an indicator of the person the question is about. For example, mothers have frequently been asked questions about the child, the child’s father, and (if applicable) their current partners. This information can be useful for comparing two reports of the same underlying phenomenon or for filling in missing data. For example, it may be interesting to know whether a parent’s assessment of his or her relationship with the child differs from the child’s own assessment, or it may be useful to use the mother’s report of the father’s employment status if the father did not provide that information himself. After the FFC, we identified the focal person (the person about whom the question was asked) for each variable. The possible values are child, father, mother, primary caregiver, partner, and other.
Scales and Measures
The FFCWS data contain variables that correspond to several widely used sociological and psychological scales and measures. These include indicators of a child’s cognitive and psychosocial development as well as indicators describing the parents, the family, and the home environment. Although information regarding these scales and measures was previously documented in user’s guides and a separate document describing each scale, this information was often the focus of data users’ and FFC participants’ questions, indicating that it would be helpful to consolidate this information. To indicate which variables are used to construct these scales and measures, we added a scale field to the metadata. Appendix B contains a full list of scales and measures.
Question Text
Each FFCWS variable is associated with a label that briefly describes its content. These labels are a metadata feature associated with Stata data files, which limits them to a maximum of 80 characters. Although the label is sufficient in most cases as a description of the variable, on occasion the full text of the variable from the questionnaire is helpful for conducting data preparation. To acquire these data, we programmatically extracted the full question text from the original surveys. Because the results from this process were imperfect, we then edited the text to ensure quality. The resulting question text (and probe text, where applicable) is now available for each variable.
Integrating Automated Testing
The improvements that we made to the canonical data files and the creation of the metadata file required a substantial investment of resources, involving a dozen survey specialists and programmers working part-time on various improvements to the overall system over the course of a year. Because a substantial portion of this redesign work was conducted manually, we have incorporated a set of automated tests into the metadata build process as a way of checking our work. Roughly, our tests fall into two main groups: those that focus on single metadata fields and those that focus on pairs or combinations of fields. For all metadata fields with a fixed number of possible values (e.g., wave or respondent) we ensure that the recorded values are in the correct range. We also check for impossible combinations of variables; for example, we can automatically ensure that no questions in wave 1 have been marked as having a teacher as the respondent (the children did not yet have teachers in wave 1).
Automated testing is especially advantageous because tests can be rerun every single time a change is made to either the data or metadata. This means that certain types of errors are caught and remedied quickly without requiring manual attention. However, although incorporating these tests into the process of building the metadata reduces the burden of data quality assurance on the part of the data creators, it does not entirely eliminate the need for manual checks. Automated tests are good at catching logical impossibilities and imposing standard formatting on metadata fields, but they cannot catch every possible error in the metadata. This highlights a core lesson learned from our metadata redesign effort: automated tools support, rather than replace, the expertise of data creators.
Providing Multiple Metadata Formats
After improving the metadata, we wanted to make it easily available to data users. 6 To do this, we developed a Web application programming interface (API) that provides direct access to the metadata and serves as a platform for other metadata tools. We also developed three different front ends to the API: a Web application, an R package, and a Python package. Our decision to provide multiple front ends was motivated by the breadth of training we saw among FFCWS and FFC users. We hope that these systems will enable researchers with a wide range of technical skills to use the data in sophisticated ways. Furthermore, because we continue to provide direct access to the Web API (and even the metadata CSV), we enable other users to develop new metadata formats that suit their own needs as the community accessing the data continues to grow and approaches to modeling continue to evolve. As Robinson et al. (2009) reported in their assessment of government data provision practices, a key advantage of providing an API is that it leaves open the possibility of third parties providing additional release formats in the future. Overall, our hope is that this hybrid system will “make easy things easy and hard things possible.” 7
Metadata CSV
Previously, the metadata were stored primarily in a series of PDF files. To make the metadata more easily machine readable, we now store all of the metadata in a single CSV file. Our approach to storing the metadata diverges somewhat from the existing literature on relational database design and “tidy data” principles (Codd 1970; Wickham 2014). Our metadata system is organized in a denormalized format, meaning that each “cell” of the metadata does not necessarily describe a single piece of information. We chose this type of data organization deliberately to strike a balance between human and machine legibility. We suspect that some users will want to read the metadata CSV directly; however, we also want the metadata to be easily processed by data users and by downstream applications (see below).
Web API
An API provides users with a set of functions for retrieving and manipulating data. Our API provides read-only access to the metadata (i.e., users cannot add, update, or delete records). We provide two end points: one for retrieving metadata attributes for a single variable and one for retrieving variables given a set of search filters over the metadata fields. Using the API yields three immediate benefits over using the metadata CSV directly. First, the API protects users from underlying implementation details that are irrelevant to the substance of the metadata. For example, if the metadata were stored in a different file format in the future, users and services accessing the metadata through the API would not need to modify their code in response. Relatedly, an API ensures that users are relying on the most up-to-date version of the metadata file, making it easy for the data creator to deploy new metadata fields or bugfixes to existing metadata if needed. Finally, because we are able to track the usage of the API over time, we can collect information about which variables and metadata fields are of greatest interest to our community of data users. We hope to use this information in the future to guide training for data users and to orient future data collection efforts. Appendix C provides additional technical details on the design of the web API.
R and Python Packages
All participants in the FFC open-sourced their code. We learned through exploring this corpus of code that the three most common languages used in the challenge were Python, R, and Stata. One of our goals was to make it easier for R and Python users to interface with the data, because these environments provide widely used machine learning, data organization, and automated feature selection tools. To facilitate the programmatic use of metadata to perform these tasks, we created R and Python packages that query the Web API and parse the returned information into a format that is easy to use for analysis. Using these packages, users can seamlessly integrate the metadata into their data analyses without having to rely on other tools, languages, or manual data modification steps. These packages are publicly available on GitHub.
Web Application
Although the Web API provides extremely flexible access to the metadata, and the R and Python packages make it easier to incorporate the metadata directly into code, these tools presume that users have a high level of programming skill. To facilitate metadata access among a wider range of potential users, we also created a Web application that enables searching and browsing through a user-friendly interface (see Figures 5 and 6). The design of our Web application was influenced by the design of Web sites for other similar surveys, such as those summarized in Table 1. For more on the design of the Web application, see Appendix C.
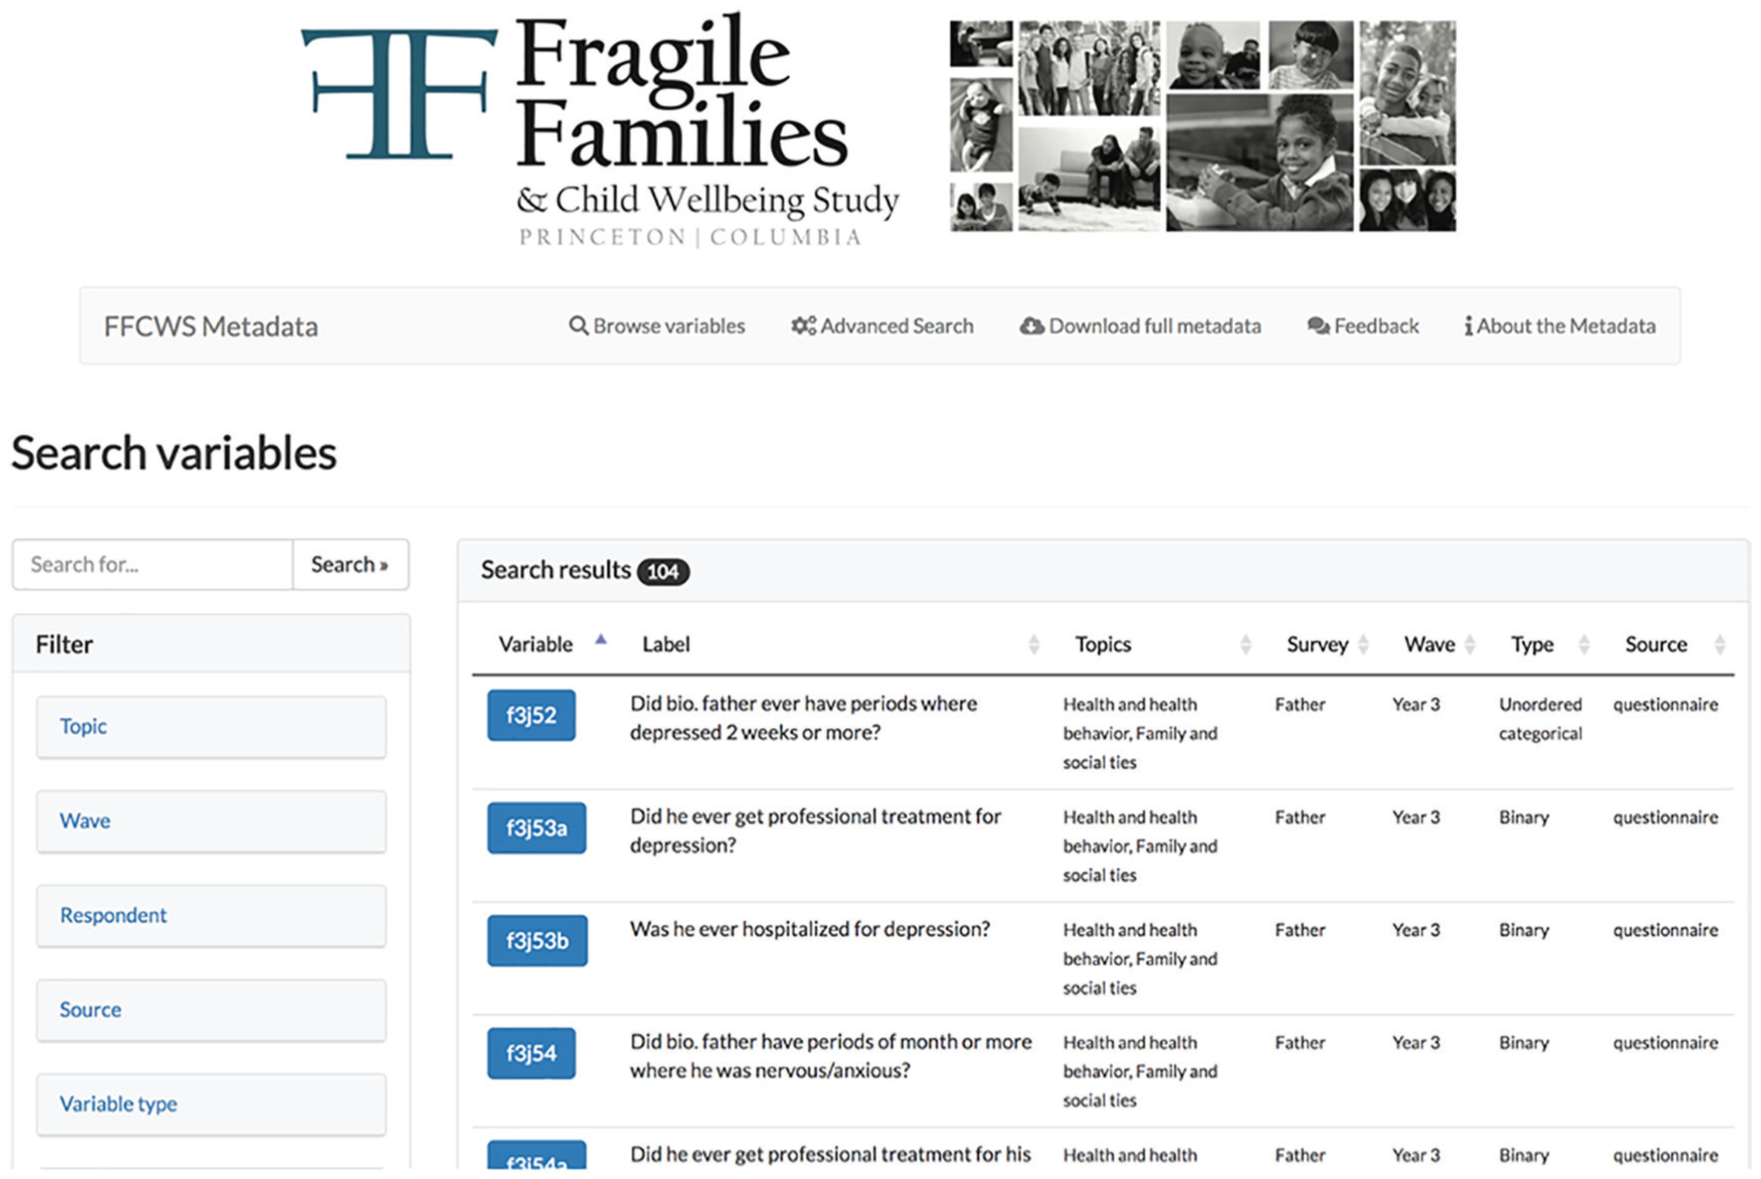
Fragile Families and Child Wellbeing Study metadata Web application search interface. We provide tools for searching and filtering on key metadata fields, such as wave, question text, or respondent. Matching variables are displayed in a sortable interface, and matching variable names are exportable.
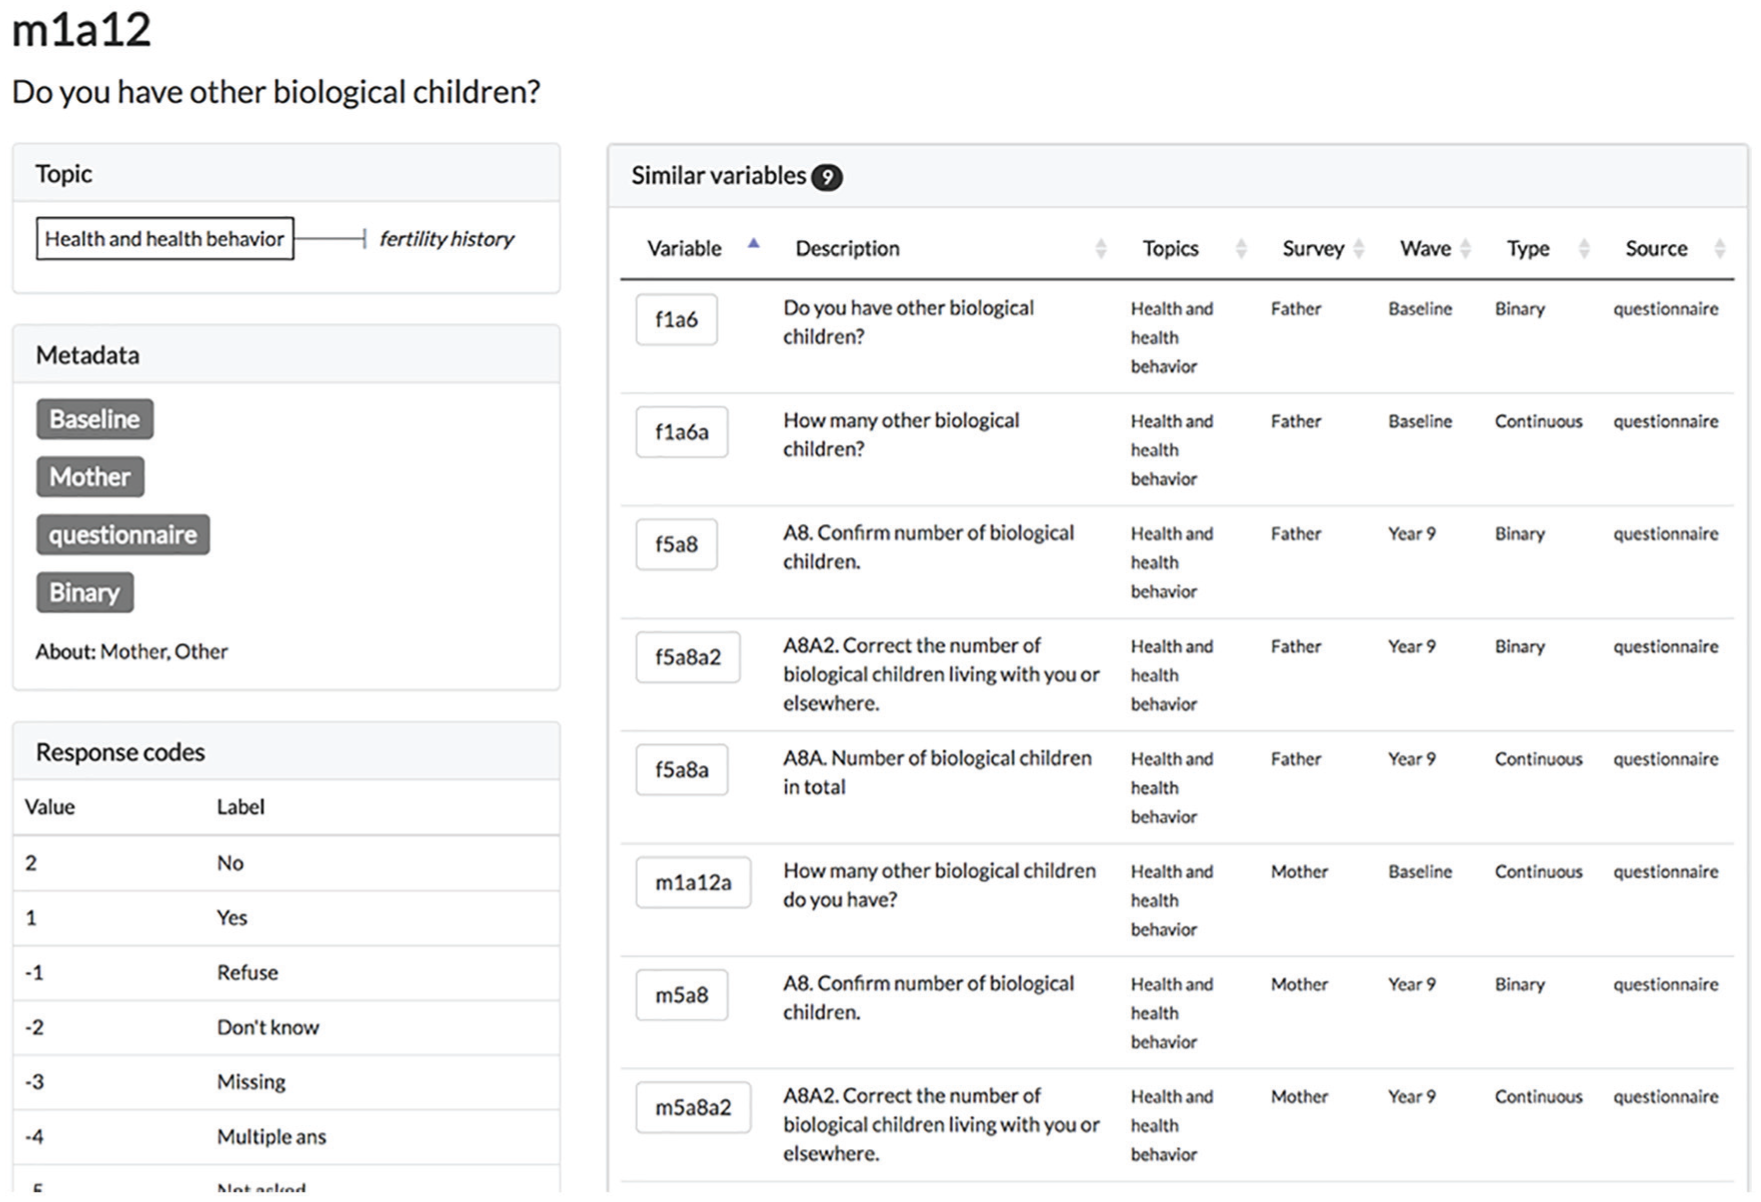
Fragile Families and Child Wellbeing Study metadata Web application variable metadata page. Displays key metadata fields, possible response codes where enumerable, and similar variables.
Evaluation
We conducted three informal evaluations of the redesigned metadata infrastructure. First, at the FFC workshop, we presented pilot versions of our metadata infrastructure to challenge participants. Participants viewed early versions of the redesigned metadata CSV, as well as wireframe prototypes of the Web app and API, and provided feedback on fields they viewed as useful or in need of improvement. This early feedback allowed us to redesign several features of the metadata that workshop participants suggested were important.
Second, as a way of comparing the redesigned metadata with the old system, Table 4 compares some specific tasks that require the FFCWS metadata. These tasks are drawn from actual requests that the FFCWS team received supporting traditional users, as well as requests received during the FFC from participants. A number of tasks are substantially easier with the new metadata.
Comparison of Key Metadata-Intensive Tasks between Old and New Fragile Families and Child Wellbeing Study Metadata Systems.

Finally, we ran the FFC as an assignment in an undergraduate machine learning class at Princeton (COS 424) in spring 2017 using the old data and metadata and then again in spring 2018 with the new data and metadata. After the assignment was complete, we compared the predictive performance distributions of each class to evaluate whether there might be an effect of improved metadata on predictive performance. We found that average predictive performance was similar across years. However, upon informally debriefing the assignment with students, we received substantially fewer complaints with the new metadata infrastructure. Although we did not formally survey the students to assess this quantitatively, these conversations suggested to us that students were able to accomplish a similar level of performance without struggling as much with understanding the data along the way. Although none of these forms of evaluation are definitive, in aggregate they give us confidence that the new metadata system is an improvement for researchers. We plan to continuously evaluate and improve this system as new ways of using the data emerge.
The Future of Metadata Systems
Metadata systems are essential scientific infrastructure. A good metadata system reduces the burden of preparing data for analysis, makes it easier to catch potential errors early in the research process, and facilitates the use of a wide variety of data analysis approaches. In the social sciences, particularly those fields which rely on publicly funded, large-scale, longitudinal survey data, these systems have generally been built with a particular type of user in mind: social researchers trained to use multivariate regression analysis to frame and answer theoretical questions (Abbott 1988; Raftery 2001). For researchers working in this tradition, existing metadata have provided a usable (if time-consuming and occasionally error-prone) set of tools for constructing certain types of models using survey data. However, the design of these metadata systems often makes it difficult for researchers to conduct the kinds of data preparation necessary to apply machine-learning methods to these data. There is a strong synergy between new methods for modeling high-dimensional data and the complex structure of longitudinal survey data archives, but the limitations of many existing metadata systems mean that the full benefits of this pairing have yet to be realized.
Although we believe that our modifications to the FFCWS metadata system represent substantial improvements over the prior architecture, we consider this to be a work in progress. Ultimately, we believe that future metadata improvements should be driven by the needs of data users. Paying attention to what tools users want to apply to the data makes it easier to know what kinds of metadata are needed to support the research process. As we learned through organizing the FFC, mass collaboration is well suited to the task of learning about the tools data users want to apply. The challenge exposed the data to a wider range of users with a heterogeneous set of technical skills and assumptions about data, and it made these data-user interactions visible to the challenge organizers and FFCWS data creators. Although conducting a similar mass collaboration for the sole purpose of learning about data preparation may be excessive, any mass collaboration offers useful perspective on how data systems are used in practice, and thus how they might be improved. Although user-oriented metadata design may simply require more investment, the earlier these systems can be developed, the better the quality and breadth of data analysis will be over the life span of the data. There is no silver bullet to metadata design, but early consideration of potential problems can significantly reduce the burden of revisiting them later on.
From our experience organizing the FFC and redesigning the FFCWS metadata system, we have two general recommendations for data creators that can make data preparation easier for data users, particularly among those trying to apply machine-learning methods to longitudinal survey data. First, we suggest that providing a small set of standard, machine-actionable metadata fields (especially variable type and substantive topic) can make a substantial difference in the amount of time users spend on data preparation. Challenge participants spent a lot of time inferring these properties of the data heuristically when they are not made easily usable; this time could have been better spent on the research goals of the challenge. Second, providing metadata in a machine-actionable data format such as CSV (as opposed to a document-based system) makes it easier for data users to use the data productively. Metadata systems cannot automate or “solve” data preparation once and for all, but a well-designed set of metadata tools can free data users to focus on important substantive and analytic decisions instead of rote data preparation tasks. In the same way that public data provision enabled entirely new kinds of social research in the twentieth century, we expect that treating metadata as data will catalyze new kinds of social research in the twenty-first century.
We believe that progress on designing metadata systems should be embedded within a broader research agenda on data preparation (Donoho 2017; Tukey 1962). Returning to the stylized data pipeline in Figure 1, we note that estimating quantities of interest requires three steps to be completed successfully: data collection, data preparation, and modeling. Data collection and modeling are already the subjects of huge bodies of research, but data preparation is relatively understudied given that it is a critical step in almost every quantitative social research project. Some specific data preparation tasks with close affinities to statistical theory (especially missing data) have developed a substantial research literature, but the overall process of preparing data for analysis remains somewhat ad hoc and without a general methodological literature. Future empirical research might build on existing studies of researcher beliefs about data preparation (Leahey 2008; Leahey, Entwisle, and Einaudi 2003) by studying regularities in the process of data preparation and quantifying the impacts data preparation decisions have on estimates. Complementary theoretical research might enrich the connections between stages in the data pipeline and show how data preparation choices can be as important as data collection and modeling choices. Given the range of topics involved, we expect that a vibrant science of data preparation will require perspectives from social science, statistics, and computer science. Despite the difficulties involved, we expect that a methodological focus on data preparation would enable social researchers to use a wider range of data analysis techniques, especially high-dimensional machine-learning methods, and would help make quantitative social research more efficient and more reliable.
Footnotes
Appendix A: Standardizing Canonical Data Files
Appendix B: Creating Machine-actionable Metadata
Appendix C: Providing Multiple Metadata Formats
Acknowledgements
We thank all the participants in the FFC who shared their data processing scripts and stories with us, particularly Greg Gundersen for creating the first version of machine-actionable FFCWS metadata. We also thank Ian Lundberg, who hosted several of the getting-started workshops, supported participants throughout the challenge, and shared his own experiences with survey metadata. Participants in the Princeton Sociology Proseminar provided valuable feedback on a draft of the article, and Brandon Stewart provided catalytic conversation. We thank Ian Fellows for his help with the R package, Greg Gundersen for his help with the Python package, and Cambria Naslund for her assistance with the question text data.
Funding
The author(s) disclosed receipt of the following financial support for the research, authorship, and/or publication of this article: This work was supported through grant support from the Russell Sage Foundation, National Institutes of Health grant R24-HD047879 to the Office of Population Research, and a National Science Foundation Graduate Research Fellowship. Funding for the FFCWS was provided by the Eunice Kennedy Shriver National Institute of Child Health and Human Development through grants R01HD36916, R01HD39135, and R01HD40421 and by a consortium of private foundations, including the Robert Wood Johnson Foundation.
1
The idea of a data pipeline was inspired by ![]() . We note that this is a simplified representation, and we do not mean to reduce all research to data processing. Developing insights from data tends to be a more complex and iterative activity than we portray here and involves many more varieties of intellectual work that inform but do not directly involve data processing (e.g., talking with colleagues, reading relevant published works).
. We note that this is a simplified representation, and we do not mean to reduce all research to data processing. Developing insights from data tends to be a more complex and iterative activity than we portray here and involves many more varieties of intellectual work that inform but do not directly involve data processing (e.g., talking with colleagues, reading relevant published works).
3
We ran getting-started workshops in three classes: an undergraduate machine learning class at Princeton (COS 424), a graduate research design class at Princeton (SOC 503), and the Summer Institute in Computational Social Science. We also ran getting-started workshops at Indiana University (hosted by the Karl Schuessler Institute of Social Research), the University of California, Los Angeles (California Center for Population Research and the Center for Social Statistics), and the Population Association of America Annual Meeting.
4
For example, the variable name for the first question in the first section of the mother baseline survey would be m1a1.
5
Each observation in the data has a unique ID number stored in variable idnum, which we mark as type “ID Number” to avoid confusion.
6
Unlike the FFCWS data archive, the metadata file contains no private information, and releasing it publicly carries minimal risk to study participants.
7
To the best of our knowledge, this quotation was first used to describe the Perl programming language in Wall, Schwartz, and Christiansen (1996).