
Abstract
Consumers’ expectations about the future of their own finances and the macroeconomy are used to forecast consumption, but forecasts do not typically account for differences by race and ethnicity. In this report, the author asks (1) whether there is consistent racial and ethnic variation in consumers’ economic expectations, (2) if differences can be explained by economic experiences, and (3) how the scope of expectations matters. The author uses the Survey of Consumer Finances to examine variation in the likelihood of positive national and personal economic expectations among individuals who identify as black, white, or Hispanic. The author finds that national expectations have substantial racial and ethnic variation net of economic experiences. For personal expectations, initial racial and ethnic variation in the likelihood of positive expectations disappears once economic experiences are accounted for. These findings have important implications for consumption forecasts, especially as the racial and ethnic composition of the United States changes.
Consumers’ expectations about their own financial futures and the future of the macroeconomy are part of the toolkit forecasters use to measure the health of the economy. These expectations are aggregated into monthly indices that evaluate consumers’ confidence about the economic future, serving as signals to producers, investors, and the general public about future consumption. As a result, consumers’ subjective views of the economy can have broad economic consequences: in the aggregate, positive consumer expectations distilled through such public indices can boost demand and ease recessions, while pessimistic views can lower spending and deepen economic downturns (Beckert 2016; DiMaggio 2002). We know that current economic experiences, conditions, and information shape consumers’ outlooks toward the economic future (Erikson, MacKuen, and Stimson 2000), as do media exposure, political preferences, and emotions (Akerlof and Shiller 2009; De Boef and Kellstedt 2004; Goidel et al. 2010; Katona 1968).
Less is known about how economic expectations may vary with regard to sociodemographic group membership. Recent research has found consistent group-level heterogeneity in inflation expectations across age groups (Malmendier and Nagel 2016), and correlations with other sociodemographic characteristics, such as race and ethnicity, have been acknowledged but not explicitly considered in analyses of consumer expectations (Dominitz and Manski 2004; Puri and Robinson 2007; but see Souleleles 2004). Understanding how consumer expectations may differ by race and ethnicity, in particular, is important given the rapidly changing demographic composition of the United States. Much of the current population growth within the United States stems from nonwhite populations, and non-Hispanic whites are projected to become the minority population within in the next 30 years (Lichter 2013; Stepler and Lopez 2016). If there are substantive and consistent racial and ethnic differences in consumer expectations, ignoring such differences may have consequences for the effectiveness of economic forecasting. Notably, it would be difficult to determine whether changes in outlooks over time are due to substantive changes in consumers’ attitudes that anticipate a shift in future consumption patterns, or whether they are merely a reflection of the changing racial and ethnic composition.
In this research I draw on sociological theory to hypothesize that racial and ethnic stratification in opportunity structure and/or diverging social psychological frames of the future may produce racial and ethnic differences in economic outlooks. I test these hypothesis via an examination of (1) whether there are consistent racial and ethnic differences in consumers’ economic expectations, (2) if any initial racial/ethnic variation can be accounted for by socioeconomic position and experiences, and (3) how the scope of expectations matters for these differences. To answer these questions, I use data from the Survey of Consumer Finances (SCF) between 2001 and 2016 to examine variation in the likelihood of positive national and personal economic expectations among individuals who identify as black, white, or Hispanic. I find that consumer expectations about the national economy have substantial racial and ethnic variation net of economic characteristics, with blacks and Hispanics both significantly more likely to expect the economy to improve relative to whites. When considering personal financial expectations, initial racial and ethnic variation in the likelihood of positive outlooks disappears once I adjust for socioeconomic status and economic experiences of the household. These findings suggest that divergent social psychological frames may help explain racial and ethnic differences in expectations about the national economy, but that opportunity structure largely explains initial racial and ethnic differences in personal expectations.
Background
Economic expectations, as defined in this paper, refer to consumers’ outlooks regarding both the national economic future and their future personal financial positions. Outlooks about the future of the macroeconomy (termed “national” expectations here) and the future of one’s personal finances (“personal” expectations) are used in consumption forecasts reported monthly in the United States (see, e.g., Curtin 2002). These forecasts provide measures of consumer confidence in the economy, which can affect business cycles (Akerlof and Schiller 2009; DiMaggio 2002).
There is some evidence that blacks and Hispanics have more positive expectations about economic phenomena than whites, suggesting that some measures of consumer confidence may be systematically correlated with sociodemographic group membership (see, e.g., Dominitz and Manski 2004; Puri and Robinson 2007; Souleles 2004). Although this research acknowledges racial/ethnic differences, it does not explicitly consider why and when sociodemographic group membership produces such variation. I do so by drawing on a comprehensive social theory of expectations that underscores that, because of their forward-looking and inherently uncertain nature, expectations become grounded within and reflective of individuals’ social contexts and experiences (Beckert 2016). Indeed, research supports the idea that economic expectations can be influenced by myriad social factors, such as one’s exposure to economic news, personal networks, and concurrent political events, as well as emotions (e.g., Akerlof and Schiller 2009; De Boef and Kellstedt 2004; Dequech 1999; Goidel et al. 2010; Haller and Norpoth 1996; Kalogeropoulous 2018; Katona 1968; Mondak, Mutz, and Huckfeldt 1996).
I consider two determinants of expectations that may contribute to racial and ethnic differences: opportunity structure and cultural frames (Beckert 2016). Race and ethnicity are intertwined with opportunity structure in the United States, as demonstrated by the fact that economic inequality has been, and continues to be, stratified along racial and ethnic lines (see, e.g., Keister 2000; Manduca 2018). And race and ethnicity, as socially constructed identities, can provide social psychological frames that may influence how individuals interpret and make sense of the world around them (see, e.g., Brubaker, Loveman, and Stamatov 2004; Howard 2000). I further consider whether the salience of these factors depends on whether the expectations refer to the national economy or personal finances. The below discussion of these factors considers three categories of race/ethnicity, black, white, or Hispanic/Latino, to mirror my analytic data.
Opportunity Structure and Racial/Ethnic Differences in Expectations
Current and past socioeconomic position and experiences inform economic expectations (Dominitz and Manski 1997; Erikson et al. 2000; Kalogeropoulos 2018; Malmendier and Nagel 2016). In line with this research, Beckert (2016:87) theorized that expectations about the economic future may be influenced by one’s structural position because it informs what individuals believe is possible in the future. In the United States, black and Hispanic individuals face structural disadvantage that affects many aspects of their economic lives, including but not limited to persistent income and wealth inequality and discrimination in hiring, lending, and housing (Campbell and Kaufman 2006; Keister 2000; Kochhar, Fry and Taylor 2011; Manduca 2018; Oliver and Shapiro 2006; Pager and Shepherd 2008). The historical patterning of racial and ethnic discrimination and structural economic inequality within the United States has significantly limited the economic mobility of blacks and Hispanics relative to whites, resulting in cumulative economic disadvantage that is divided along racial and ethnic lines (Campbell and Kaufman 2006; Oliver and Shapiro 2006).
This stratification is evident with regard to wealth accumulation: white households are estimated to have 20 times and 18 times the wealth of black and Hispanic households, respectively (Kochhar et al. 2011), and significant disparities occur across the wealth distribution (Maroto 2016). Although the black-white wealth gap is wider than the Hispanic-white wealth gap, both blacks and Hispanics are significantly less likely to accumulate wealth and benefit from wealth relative to whites (Campbell and Kaufmann 2006; Killewald 2013; Maroto 2016; McKernan et al. 2014; Oliver and Shapiro 2006). As a result, economic precarity is higher among black and Hispanic households, in part because they are less likely to have resources that can buffer financial shocks (Despard et al. 2018).
The historical and continued racial/ethnic stratification of the U.S. economic structure has produced long-standing disparities in economic well-being. This subsequently might also produce systematic, group-level divergences in economic outlooks.
Frames and Racial/Ethnic Differences in Expectations
In addition to opportunity structure, Beckert (2016:88) theorized that cultural frames are important social factors influencing economic expectations. This concept aligns with work in economics that argues psychological factors can shape economic outlooks in the face of uncertainty (Akerlof and Schiller 2009; Dequech 1999). Beckert underscored that some psychological factors are social: cultural frames, also referred to as cognitive frames, are supraindividual, social influences that shape individuals’ perceptions (Beckert 2016; DiMaggio 1997; Wood et al. 2018). Importantly for expectations research, frames can be forward looking and help define “horizons of possibilities” (Small, Harding, and Lamont 2010:15; see also Abdelal et al. 2006; Hitlin and Johnson 2015; Young 2010). And as socially constructed identities that carry significant social, cultural, and historical meaning, race and ethnicity serve as frames that influence how individuals interpret and make sense of their social worlds (Brubaker 2009; Brubaker et al. 2004; Omi and Winant 2015). As such, race and ethnicity may produce collective interpretations and perceptions of economic experiences and conditions that contribute to shared outlooks about the economic future among individuals who identify with particular racial/ethnic groups.
The importance of frames in expectations has been discussed in prior work on educational expectations that shows consistent racial and ethnic variation in outlooks about future academic achievement. Differences persist even after accounting for important social and economic factors. Specifically, black and Hispanic adolescents are more likely to report positive educational expectations than their white peers, even after accounting for academic performance and socioeconomic status (Bates and Anderson 2014; Downey 2008; Downey, Ainsworth, and Qian 2009; Harris 2008; Kao and Thompson 2003; Kao and Tienda 1998; Mello 2009; Mickelson 1990). Explanations for these findings are varied, but many point to the possibility of racial and ethnic differences in how students frame their academic worlds and futures. This may stem from differences across groups about the beliefs regarding the importance of schooling for upward mobility (Harris 2008) or differences in the collective repertoires of habits and knowledge around schooling (Downey 2008; Kao and Tienda 1998), or it may be a result of the desire to reflect values or goals shared by one’s racial/ethnic group (Mello 2009; Kao and Thompson 2003; see also Frye 2012).
Similarly, qualitative research on black-white differences in occupational expectations shows that even when facing similar adverse economic conditions, outlooks about job prospects have varied by race (Lamont 2009; MacLeod 1987; Small et al. 2010). For instance, MacLeod’s (1987) ethnographic work shows that black adolescents remaining more positive about their job prospects compared with their white peers, even when groups are experiencing the same local economic environment. And in qualitative research on working-class men, Lamont (2009) showed that individuals’ responses to similar economic experiences are shaped by worldviews and a sense of self-identity and morality that differs by race, resulting in group-level differences in responses. In both cases, the researchers have suggested that diverging interpretations of present conditions may result in diverging outlooks about the future.
Scope of Expectations
The salience of opportunity structure and cultural frames as explanations for racial and ethnic differences likely depends on the scope of expectations. In her work on educational expectations and attitudes, Mickelson (1990) distinguished between “concrete” and “abstract” educational topics as a possible explanation for when racial and ethnic differences emerge. Concrete questions about academic plans specific to the individual are reflective of past academic achievements and socioeconomic status. Abstract questions about the general value of education, on the other hand, may reflect broader ideologies that speak to shared group values and identity (Mickelson 1990).
This distinction is relevant for economic expectations. Consumers’ expectations used in forecasts are typically measured through two distinct topics: their expectations about the macroeconomy and about their own personal finances. Although all expectations are defined by uncertainty that opens them to social influence (Beckert 2016), expectations regarding the national economy may most strongly reflect the influence of cultural frames. The national economy is complex and abstracted from an individual’s lived experience. Social psychological frames that extend beyond personal economic considerations may help individuals interpret what the “national economy” is and/or help individuals make sense of what is possible for the economy. In contrast, expectations about personal finances are closely tied to an individual’s current economic experiences. As a result, they may be more influenced by opportunity structure and less influenced by cultural frames, producing a realistic assessment of what individuals expect to happen with their finances. Indeed, this echoes more recent work on young adults’ economic expectations revealing that socioeconomic background is not strongly associated with more general economic expectations, but does matter for expectations about employment (Bandelj and Lanuza 2018).
Hypotheses
Pulling together the prior research on opportunity structure, cultural frames, and the importance of the scope of expectations leads to the three key hypotheses.
Hypothesis 1: In a bivariate analysis, there will be racial and ethnic differences in expectations about the national economy and personal finances. Furthermore, given prior literature showing that blacks and Hispanics often have more positive outlooks relative to whites, I anticipate that when there are racial and ethnic differences, whites will be less likely and blacks and Hispanics more likely to have positive expectations.
Although I expect to see initial racial and ethnic variation, a full model of the association between race/ethnicity and expectations that accounts for socioeconomic characteristics will illuminate whether these group-level differences are due to opportunity structure and/or cultural frames. If one’s position within the stratified opportunity structure matters for expectation formation, initial racial and ethnic variation would speak in part to group-level divergences in socioeconomic position and experiences. As such, the inclusion of socioeconomic variables and measures of economic precarity in the model should absorb initial variation, diminishing between-group differences. In contrast, if cultural frames are important for economic expectations, then opportunity structure will not fully explain racial and ethnic differences in expectations. Rather, in a full model of expectations, there would be residual racial and ethnic variation after accounting for current economic standing and experiences and other potential confounders. Combined with the distinction between abstract and concrete in the scope of expectations, this produces two additional hypotheses:
Hypothesis 2: Socioeconomic position and economic experiences will not fully account for substantive racial and ethnic variation in national expectations. Rather, I expect that between-group differences will remain, suggesting that cultural frames are a determinant of national economic expectations.
Hypothesis 3: Socioeconomic position and economic experiences will explain initial racial and ethnic variation in personal financial outlooks, minimizing between-group differences in line with the theory that structural position and experiences informs concrete expectations.
It is important to note that in survey data, researchers must rely on categorizations of race and ethnicity that cannot fully map onto complex social identities (Abdelal et al. 2006; Brubaker et al. 2004; Saperstein, Penner, and Light 2013), especially because listed survey options may limit how individuals can choose to identify (Howard 2000; Mora 2014; Omi and Winant 2015). As such, my empirical assessment is limited to racial and ethnic categories that respondents best identify with at the time of the survey, among the choices provided.
Data and Methods
To test these hypotheses, I use data from the SCF between 2001 and 2016 (Board of Governors of the Federal Reserve System 2016). The Federal Reserve Board has conducted this cross-sectional survey every three years since 1983. Respondents answer a number of highly detailed financial questions to establish a comprehensive understanding of households’ financial and economic activity, attitudes, and use of products and institutions. The SCF works to reduce nonresponse on financial topics, a common problem with financial surveys, in a variety of ways, including multiple phases of contact with respondents (Kennickell 2009). Additionally, the survey administrators account for missing data using a multiple imputation process specifically designed for the SCF that results in five imputations (Kennickell 1998). The survey oversamples wealthy households to ensure adequate representation, and it supplies weights to account for differential probabilities of selection into the sample. Descriptive statistics in this analysis are weighted to account for oversampling, and all analysis uses appropriate multiple imputation techniques as outlined by Rubin (1996).
I exclude the small number of respondents who did not respond to the expectations questions. Because I am specifically interested in one’s self-identification with racial and ethnic groups, I also exclude respondents who chose not to identify their race or ethnicity. This results in a loss of less than 1 percent of respondents for each survey year used and a pooled analytic sample of 31,105 individuals over six waves (2001, 2004, 2007, 2010, 2013, and 2016).
Dependent Variables
This analysis considers two dependent variables that represent measures for consumer economic expectations. Expectations about the national economy are referred to in the analysis and discussion as national expectations, and expectations about future personal finances are referred to as personal expectations. The following two questions are used:
“Over the next five years, do you expect the U.S. economy as a whole to perform better, worse, or about the same as it has over the past five years?”
“Over the next year, do you expect your total (family) income to go up more than inflation, less than inflation, or about the same as inflation?”
Question 1 can be considered a national expectations question because it asks about a context that is separate from the respondent’s personal economic experiences and instead features a broad macroeconomic concept, “the U.S. economy as a whole.”
Question 2 serves as the personal expectation questions for the analysis. The question requires individuals to consider whether their real household incomes will increase relative to inflation. It is possible that the question adds an element of macroeconomic uncertainty because it asks individuals to consider their income in relation to inflation, a macroeconomic phenomenon. Although it would be preferable to have a question focused on expectations around nominal income, this question will still serve as a useful counterpoint to the national economy question because respondents are focusing specifically on their households’ future incomes over the medium term.
My analysis focuses on the likelihood of respondents’ having positive economic expectations. I discuss differences in the probabilities that white, black, or Hispanic respondents would expect the economy or their finances to improve relative to current conditions. To do so, I create binary measures, where 1 represents the most positive response, and 0 combines both “about the same” and “worse” in one category.
Independent Variables of Interest
Self-reported race and ethnicity serve as focal variables of interest. In the SCF, respondents are provided with seven categories and asked to select which best identifies their race or ethnicity. By selecting among options, respondents are signaling the group with which they align most. The public data set provides only three specific categories for race and ethnicity: white, black, and Hispanic. Any other responses are coded as other. Because of the ambiguity within in this final category, I provide the results but do not interpret them and instead focus on the findings for white, black, and Hispanic respondents.
Socioeconomic Covariates
To examine whether any racial and ethnic variation in expectations is explained by the household’s economic standing, I include a bundle of covariates to account for socioeconomic status of the household. To do so, I first include the highest level of education between the respondent and spouse (if applicable). This measure is a four-level categorical variable in which having less than a high school degree is the reference category and is compared with those who have a high school degree, have attended some college, and have attended four years of college or more. Second, because net worth provides a broader picture of household financial stability than a measure of income alone, I include household net worth quartiles to capture the state of household finances. The net worth measure references the within-survey distribution, and the underlying dollar ranges vary slightly by survey year and are adjusted to 2013 dollars to account for inflation. These are included as categorical variables with the bottom quartile as the reference category. Finally, because respondent education levels and net worth cannot fully capture households’ economic experiences, I also include a measure of household spending relative to income that aims to account for the current economic well-being of the household. The SCF asks whether, during the past year, household spending exceeded total income, was about the same as income, or less than income (reference category), and this is kept as a three-category variable.
I also include a bundle of covariates to account for the economic precarity of the household because, as noted in the background section, prior research has demonstrated that this precarity is stratified by race and ethnicity. In this bundle of covariates, I include a binary measure that accounts for whether the head of the household was unemployed at any point during the past year. This serves as a proxy for recent financial instability, with 1 indicating a job loss during the past year. 1 A second covariate identifies whether the respondent could turn to friends or family for financial assistance in a hypothetical emergency. This variable identifies whether respondents believe they could receive at least $3,000 from friends or family in a time of need, with 1 indicating that they could not receive such support. Finally, a third economic precarity variable identifies whether the individual usually knows the family’s income for the next year, with 1 indicating no and 0 indicating yes.
Control Variables
I control for key demographic variables in this analysis: age, age squared, gender, marital status, and number of dependents. Age, gender (female = 1, male = 0), and marital status are included on the basis of Dominitz and Manski’s (2004) observations that younger people, men, and married partners are more likely to report higher investment and personal income expectations. Marital status is coded as a three-level variable, with married and cohabitating couples as the reference category. Remaining households are split into never married and previously married. Previously married is coded as any respondent who is separated and living alone, widowed, or divorced. The number of dependents refers to any individual living in the household who is financially interdependent with the respondent, including the spouse (if applicable) and any minor children. This measure is continuous and excludes individuals who are living in the household but are financially independent.
Finally, given prior research on cohort differences in expectations (Malmendier and Nagel 2016), models using pooled survey years must control for the changing economic and political contexts that could affect the relationship between race and economic expectations. As such, I also include survey year to account for macroeconomic conditions over the time period.
Weighted summary statistics for all dependent and independent variables and controls are reported in Table 1, both for the overall sample and separately for whites, blacks, and Hispanics. Seventy-three percent of the weighted sample is white, 14 percent is black, and about 10 percent is Hispanic. In line with prior research, the socioeconomic covariates disaggregated by race and ethnicity show that blacks and Hispanics are more likely to be disadvantaged for all measures: compared with whites, higher shares of blacks and Hispanics have lower levels of education, fall into lower net worth quartiles, and spent more than their income in the prior year. Similarly, the economic precarity measures show that higher shares of whites are economically secure. Just 11 percent of whites are unemployed, compared with about 18 percent of both blacks and Hispanics. Fifty-six percent of blacks and 52 percent of Hispanics do not have access to emergency funds from friends and family, compared with just 28 percent of whites. Similarly, 42 percent of blacks and 44 percent of Hispanics report not knowing their incomes for the next year, compared with just 23 percent of whites.
Summary Statistics for All Variables.

Note: Data are are expressed as proportions or as mean (standard deviation). Variables range from 0 to 1, with the exception of age, which ranges from 18 to 95 years and number of dependents, which ranges from 0 to 12. The race category “other” is not shown separately (n = 1,298). Estimates are weighted.
The descriptive statistics support a closer look at racial/ethnic variation in expectations: just 37 percent of white respondents expect the economy to improve, while more than 48 percent of black respondents and 46 percent of Hispanic respondents have positive expectations about the national economy. A similar breakdown is true for personal expectations, though shares of positive expectations are lower overall: 19 percent of whites, 26 percent of blacks, and 25 percent of Hispanics expect their real incomes to improve.
Analytic Strategy
I estimate a series of unweighted logistic regression models pooling data across all years to examine the relationship between race/ethnicity and expectations. The first set of models assesses the race-expectations association adjusting for demographic covariates and survey year. The second adds socioeconomic covariates to determine whether socioeconomic status may account for any racial/ethnic differences in expectations. A third model includes the economic precarity measures. Finally, I present a fourth model that is fully interacted by race and ethnicity. To allow comparison across models, all table results are reported as average marginal effects, and figures present predicted probabilities (Mood 2010).
Results
Expectations about the National Economy
Table 2 reports the average marginal effects for the likelihood of reporting positive outlooks for national expectations.
Average Marginal Effects for Logistic Regressions Predicting Positive National Expectations.

Note: Estimates are unweighted. AME = average marginal effect.
p < .05. **p < .01. ***p < .001.
The predicted probabilities of having positive expectations for the national economy vary significantly by race in model 1, which shows the associations net of demographic and survey year controls. The differences are striking: black Americans are about 11 percentage points more likely to report positive national expectations than whites (p < .001), and Hispanics are about seven percentage points more likely (p < .001). The difference between blacks and Hispanics is also statistically significant (p < .001), with blacks the most likely to have positive expectations of the three groups. This initial model supports hypothesis 1 and shows that blacks and Hispanics are both more likely to have optimistic outlooks relative to whites.
Model 2 includes the socioeconomic covariates. On average, as education and net worth increase, the likelihood of having positive expectations also increases, and having household spending that exceeds income marginally decreases the likelihood. Interestingly, including these measures does not downwardly adjust the association between race/ethnicity and expectations. Instead, model 2 shows that the initial race/ethnicity–expectations results in model 1 were suppressed by the omitted socioeconomic variables. This suggests that if socioeconomic positions were equal, black and Hispanic respondents would be even more likely than white respondents to have positive outlooks. Once included, the average marginal effects increase for both blacks and Hispanics compared with whites: from 11 percentage points to 13 percentage points for blacks and from 7 percentage points to 11 percentage points for Hispanics, and both differences are significant (p < .01). The black-Hispanic difference remains statistically significant (p < .05). Overall, the racial and ethnic variation is striking: the average adjusted predicted probability of having positive expectations is just 39 percent if the individual is white but increases to 50 percent if the individual is Hispanic and 52 percent if the individual is black.
Including the economic precarity covariates in model 3 does not substantively change the associations between race/ethnicity and expectations from model 2. Although on average, lacking access to emergency funds from friends and family makes individuals less likely to expect the economy to improve and being unemployed increases the likelihood, the association between race/ethnicity and expectations again remains essentially unchanged by the inclusion of these variables. Thus far, there is not much evidence of socioeconomic differences absorbing initial racial and ethnic variation, at least when included as mediators.
Finally, model 4 shows results after interacting race and ethnicity with all covariates. The relationships of interest remain effectively unchanged. Blacks continue to be the most likely to have positive expectations, with a 12 percentage point difference from whites and an average adjusted predicted probability of 51 percent (rounded). Hispanics are similarly optimistic, with a 10 percentage point difference from whites and an average adjusted predicted probability of 48 percent. Whites remain the least likely, with an average adjusted predicted probability of 38 percent. Although some socioeconomic measures are significant in the model, they do not appear reduce racial and ethnic differences in the likelihood of positive national expectations. Indeed, a Wald test shows only weak significance for the interactions between race/ethnicity and the bundle of economic covariates (W = 1.46, p < .05).
Differences across Socioeconomic Measures
Average differences in predicted probabilities might mask socioeconomic complexity within and across racial/ethnic groups. To better assess how race/ethnicity interacts with socioeconomic position, I present predicted probabilities of positive expectations at each net worth quintile and across economic precarity measures. In the first panel of Figure 1, it is evident that there are few within-group differences across net worth quartiles. Predicted probabilities of positive expectations range from 49 percent to 52 percent for blacks, from 46 percent to 49 percent for Hispanics, and from 37 percent to 40 percent for whites. Instead, the figure highlights consistent between-group differences: within each net worth quartile, blacks and Hispanics remain significantly more likely than whites to have expect the economy to improve.
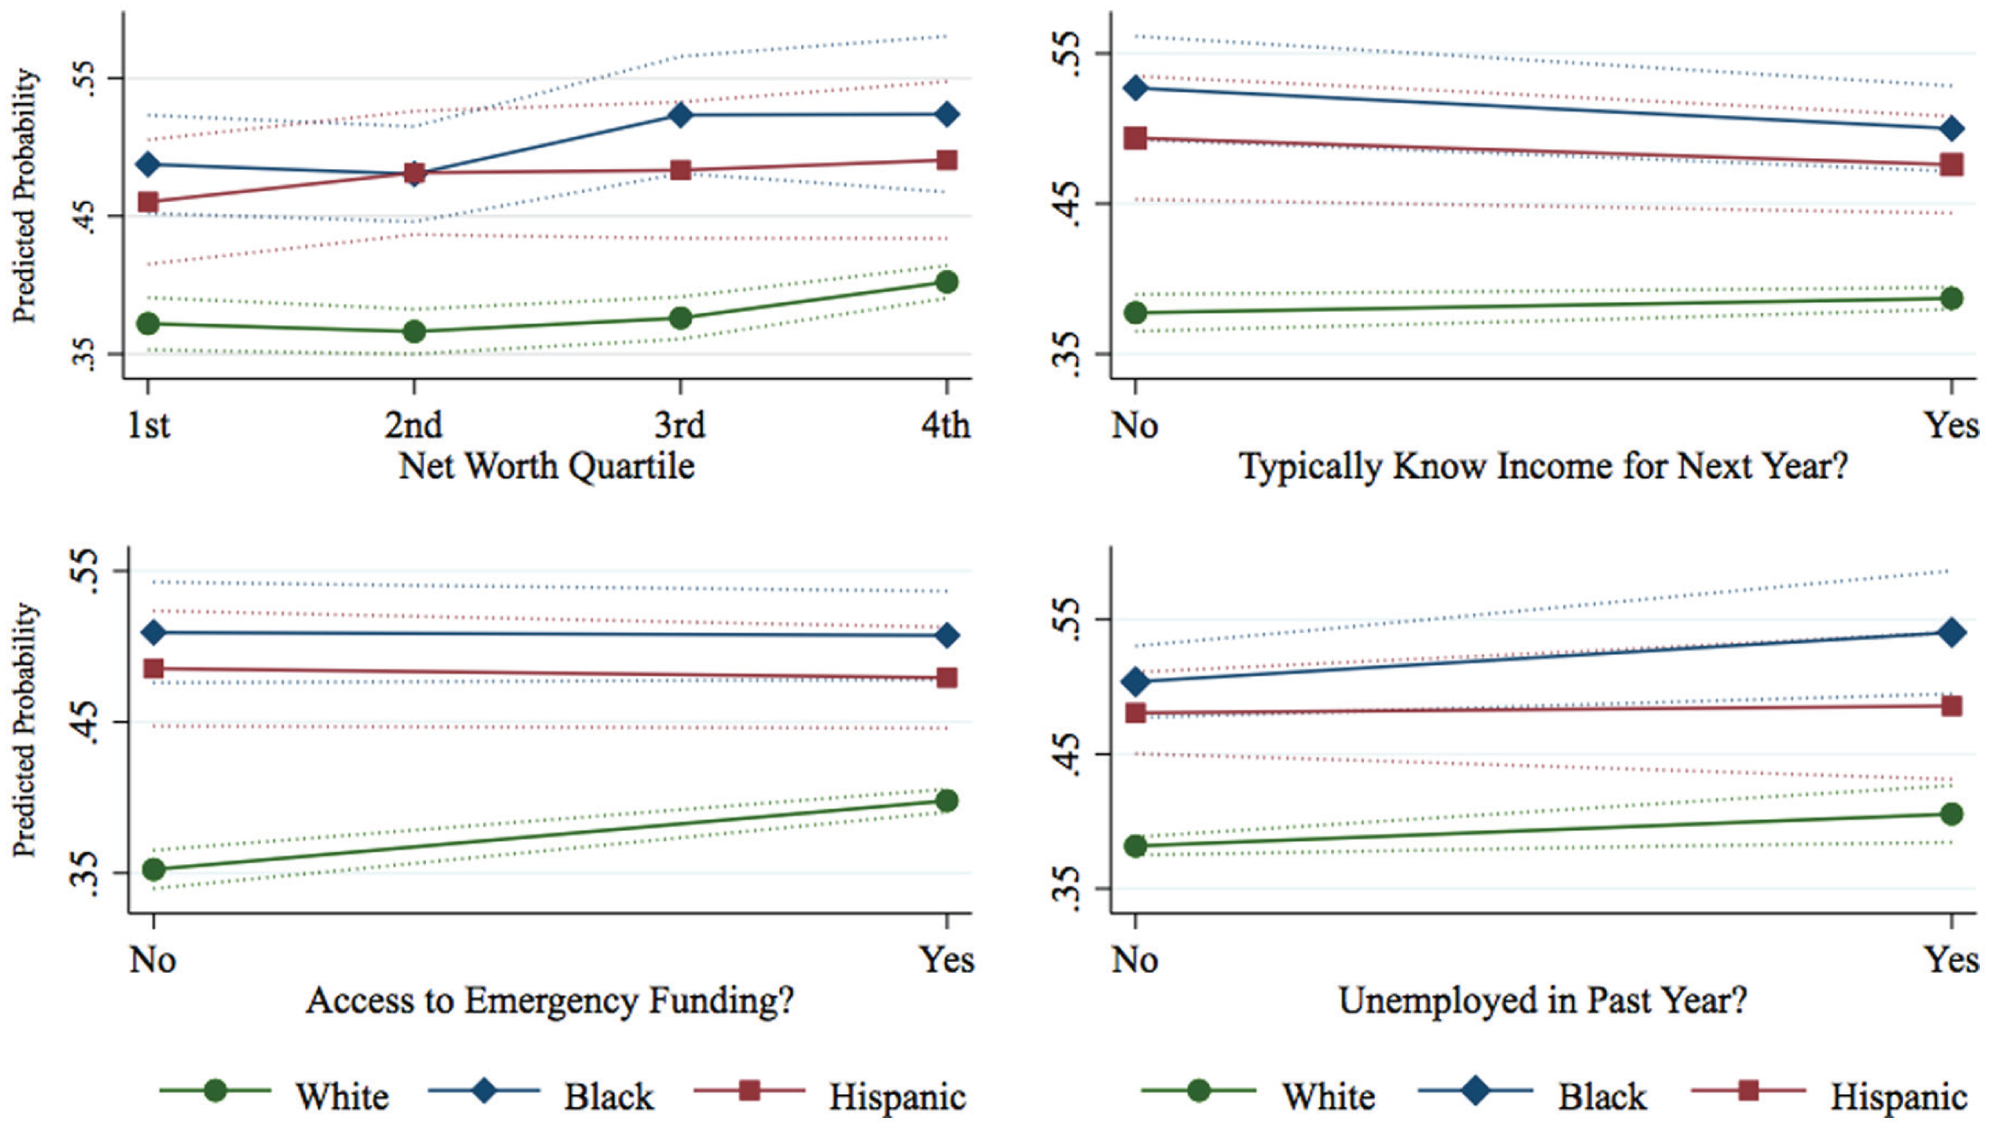
Predicted probabilities of positive national expectations, by race over net worth and economic precarity measures.
The remaining three panels presents similar findings for predicted probabilities of positive national expectations by race and ethnicity across the three economic precarity measures: knowledge of future income, access to emergency funding, and recent unemployment. Again, there are few within-group differences (with the exception of an increase in positive outlooks for whites if they have access to emergency funding, p <.05), but significant black-white and Hispanic-white differences hold across all measures. In sum, the findings for national expectations are consistent with hypothesis 2, which anticipates that racial and ethnic differences remain for national expectations even after accounting for socioeconomic status and economic experiences. The final interacted model shows that race and ethnicity matter more than socioeconomic status and economic experiences for national economic expectations.
Expectations about Personal Finances
The models presented in Table 3 reveal that positive expectations around real income (i.e., income will increase more than inflation) are more closely linked to current economic experiences.
Average Marginal Effects for Logistic Regressions Predicting Positive Personal Expectations.

Note: Estimates are unweighted. AME = average marginal effect.
p < .01. ***p < .001.
Model 5 shows the average marginal effects for race/ethnicity net of demographic and survey-year controls. Hypothesis 1 is only partially supported by this model; there is initial racial and ethnic variation, but it is Hispanics, not whites, who are the least likely to be optimistic about real incomes. Hispanics are about 3 percentage points less likely to report positive expectations compared with whites (p <.001) and 6 percentage points less likely than blacks to have positive expectations (p < .001). Notably, the range of differences is much smaller than that of national expectations, and all three groups have relatively low probabilities of positive outlooks: the adjusted predicted probabilities are 22 percent for Hispanics, 25 percent for whites, and 28 percent for blacks.
Once socioeconomic covariates are added in model 6, the Hispanic-white gap turns positive, and the magnitude of the black-white gap increases. Hispanics are now about 3 percentage points more likely than whites to report positive expectations (p < .001). This indicates that differences in socioeconomic position can explain the reduced optimism for Hispanics that was seen in model 5. Net of socioeconomic factors, blacks are now about eight percentage points more likely than whites to report positive expectations about real income. The 4-point increase from the average marginal effect in model 5 is statistically significant (p <.001). The black-Hispanic difference remains relatively unchanged, as both groups’ likelihoods increased. Optimism about real incomes remains low across all groups: predicted likelihood of positive outlooks remains at just 24 percent for whites, 27 percent for Hispanics, and 32 percent for blacks.
Importantly, the socioeconomic covariates themselves hold more weight in the model, with many of the magnitudes almost double that of the covariates reported in the national expectations model (model 2). As education increases the likelihood of reporting positive expectations increases, and as spending begins to meet or exceed income the likelihood declines. The results for net worth are particularly striking. The top quartile is about 8 percentage points more likely to report positive expectations about real income, compared with the lowest quartile (p < .001), while the second and third quartiles show lower likelihoods of positive outlooks relative to the lowest quintile. Further disaggregation (not shown) shows that individuals in the top 10 percent of the net worth distribution are driving much of this increase in the upper quartile. This may be because high net worth is often determined in part by significant income from investments (Nau 2013), such that real income might typically outpace inflation for those at the highest levels of the distribution.
In model 7, the introduction of economic precarity covariates does not substantively change the race-expectations association in model 6, though the covariates themselves are all significant. Interestingly, those who do not typically know their incomes are more likely to expect their real incomes to improve in the next year. This suggests that heightened uncertainty about real incomes may produce a more optimistic outlook about what is possible with one’s real income in the future.
Including socioeconomic status and economic precarity as additive measures in models 6 and 7 does not lessen racial and ethnic variation, but model 8 shows that the between-group differences diminish once they are interacted with socioeconomic covariates. The probability of reporting positive personal economic expectations for blacks, Hispanics and whites become statistically equivalent one another. The average adjusted predicted probabilities remain low, with a 25 percent likelihood of expecting real incomes to increase for all groups. In contrast to the national expectations model, the interactions between race/ethnicity and the bundle of economic covariates do substantively improve model fit (W = 4.99, p < .001).
Differences across Socioeconomic Measures
Knowing that the economic covariates moderate the race-expectations association, there is reason to suspect that there is heterogeneity in probabilities within racial and ethnic groups across socioeconomic categories. Figure 2 presents the predicted probabilities by race/ethnicity across net worth categories and the economic precarity measures included in the models. The first panel shows that there is some within-group heterogeneity across net worth quartiles. Expectations among whites, in particular, depend on net worth: whites have the highest predicted probability of expecting their real incomes to improve at the highest net worth quartile (predicted probability = .28), and they are the least likely to expect their incomes to improve if they are in the third quartile (predicted probability = .16). Predicted probabilities for Hispanics appear to increase in a linear fashion across net worth quartiles, moving from a 20 percent likelihood to a 28 percent likelihood, but because of large standard errors, this results in only a marginally significant increase. Predicted probabilities for blacks remain relatively consistent across quartiles, ranging between 23 percent and 25 percent, suggesting that net worth may not matter for blacks’ expectations about their personal finances. In terms of between-group heterogeneity, only the third quartile shows significant differences across groups, with whites less likely to expect their real incomes to increase.

Predicted probabilities of positive personal expectations, by race over net worth and economic precarity measures.
The remaining three panels show that there is little between-group variation across whites, blacks, and Hispanics, with the three groups remaining clustered together. Rather, the experience of economic precarity is what drives changes in personal financial outlooks, though substantive changes remain small. Blacks and whites are less likely (p < .05), and Hispanics are marginally less likely, to report positive expectations if they do not have access to emergency funding. Likelihoods of positive outlooks about real incomes increase when next year’s income is typically unknown (p < .05 for blacks and whites, marginal for Hispanics) and marginally increase when unemployed.
The inclusion of socioeconomic covariates as moderators produces substantively similar predicted probabilities of positive personal expectations among whites, blacks, and Hispanics, supporting hypothesis 3. Although overall changes are small, the final interacted model shows that it is primarily economic position and experiences that matter for personal financial outlooks.
Consistency over Time
Finally, to understand whether racial and ethnic variation (or lack thereof) is consistent, Figures 3 and 4 show the results over time using the fully interacted models.
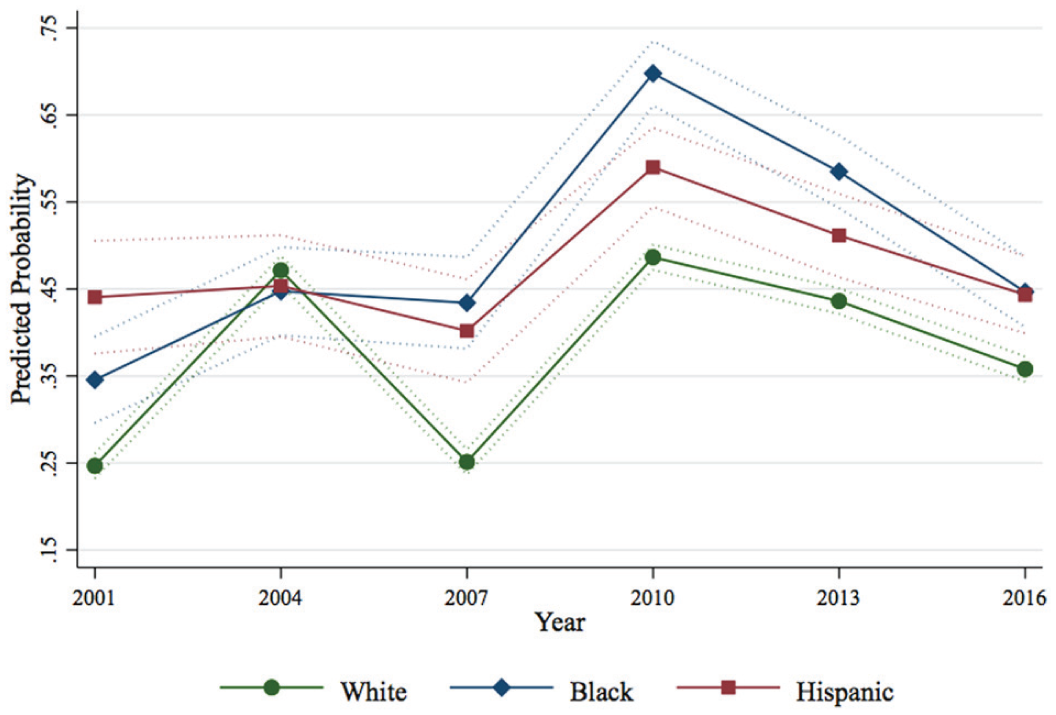
Predicted probabilities of positive national expectations by race and ethnicity over time.
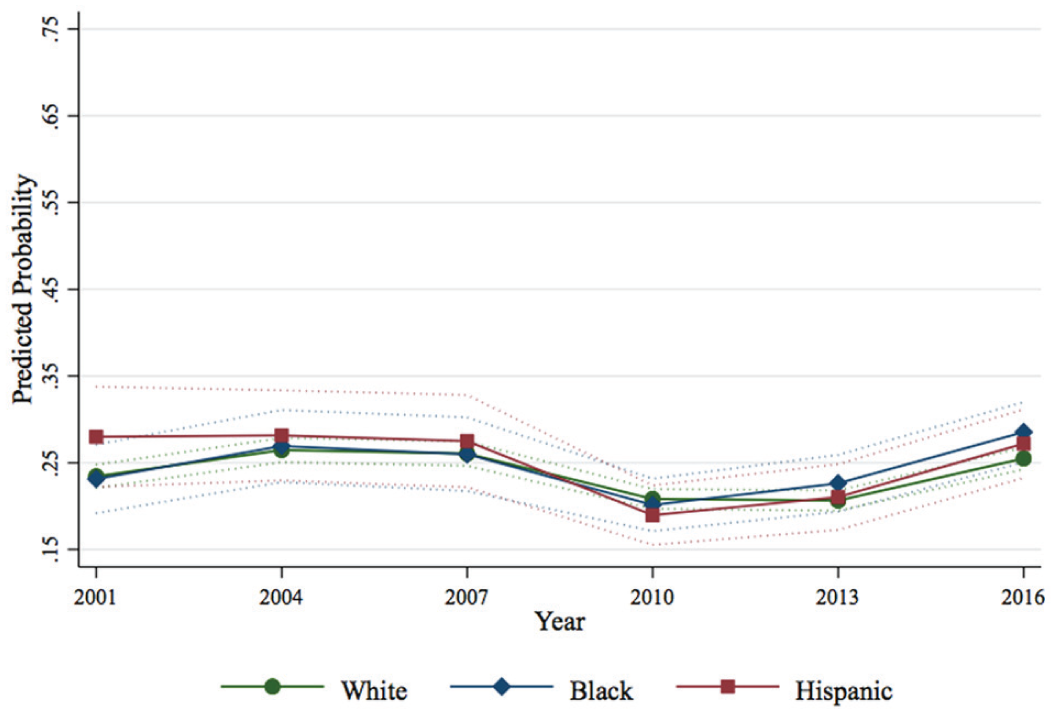
Predicted probabilities of positive personal expectations by race and ethnicity over time.
For national expectations (Figure 3), blacks and Hispanics remain more likely to have positive expectations relative to whites in all years, with the exception of 2004. In 2004, the probability for whites increases by 22 percentage points to match those of blacks and Hispanics. Predicted probabilities across time for whites appear to rise and fall in concert with macroeconomic conditions: the probabilities are lowest for whites during recession years (the dot-com bubble burst in 2001, and 2007 was the start of the great recession) and then recover as the economy is also recovering. In contrast, the probabilities for blacks and Hispanics remain constant across 2001, 2004, and 2007. The probability of positive expectations is highest for all groups in 2010. This is also the year with the largest between-group differences in which the probability of positive expectation is 21 percentage points higher for blacks relative to whites (70 percent and 49 percent, respectively, p < .05) and 11 percentage points higher for blacks relative to Hispanics (p < .05). In 2013 and 2016, blacks and Hispanics continue to have higher probabilities relative to whites, but differences are smaller.
Figure 4 shows that personal expectations have a consistent lack of variation by race and ethnicity across all years. Within each year, predicted probabilities for whites, blacks, and Hispanics are statistically equivalent to one another. There is a slight dip in the likelihood of positive real income expectations for all groups in 2010 as the economy was recovering from the great recession. Overall, the predicted probabilities are lower and have a smaller range relative to national expectations (a range between 18 percent and 28 percent vs. 25 percent and 70 percent across all years).
Sensitivity Tests
I conduct several sensitivity tests to ensure that results are not unique to the model specifications and covariates used in analysis. First, I separately consider a continuous variable for log family income instead of net worth quartiles in the bundle of socioeconomic covariates, but this substitution does not significantly change results, nor does including both income and net worth simultaneously in the models. Second, I use data from the American National Election Study from 1980 to 2012 for supplemental analyses that make use of an extended time period and additional measures not available in the SCF. The National Election Study results, which focus on national expectations with a one-year time horizon, show significant and substantively large racial and ethnic differences in expectations, with blacks and Hispanics much more likely to have positive national expectations than whites net of socioeconomic characteristics (results available from author on request). Importantly, this racial and ethnic variation in national economic expectations holds when including survey data extending back to 1980 and after accounting for differences by geographic location, religious affiliation, and political party affiliation, providing additional evidence that the racial/ethnic gaps in national expectations are not spurious findings.
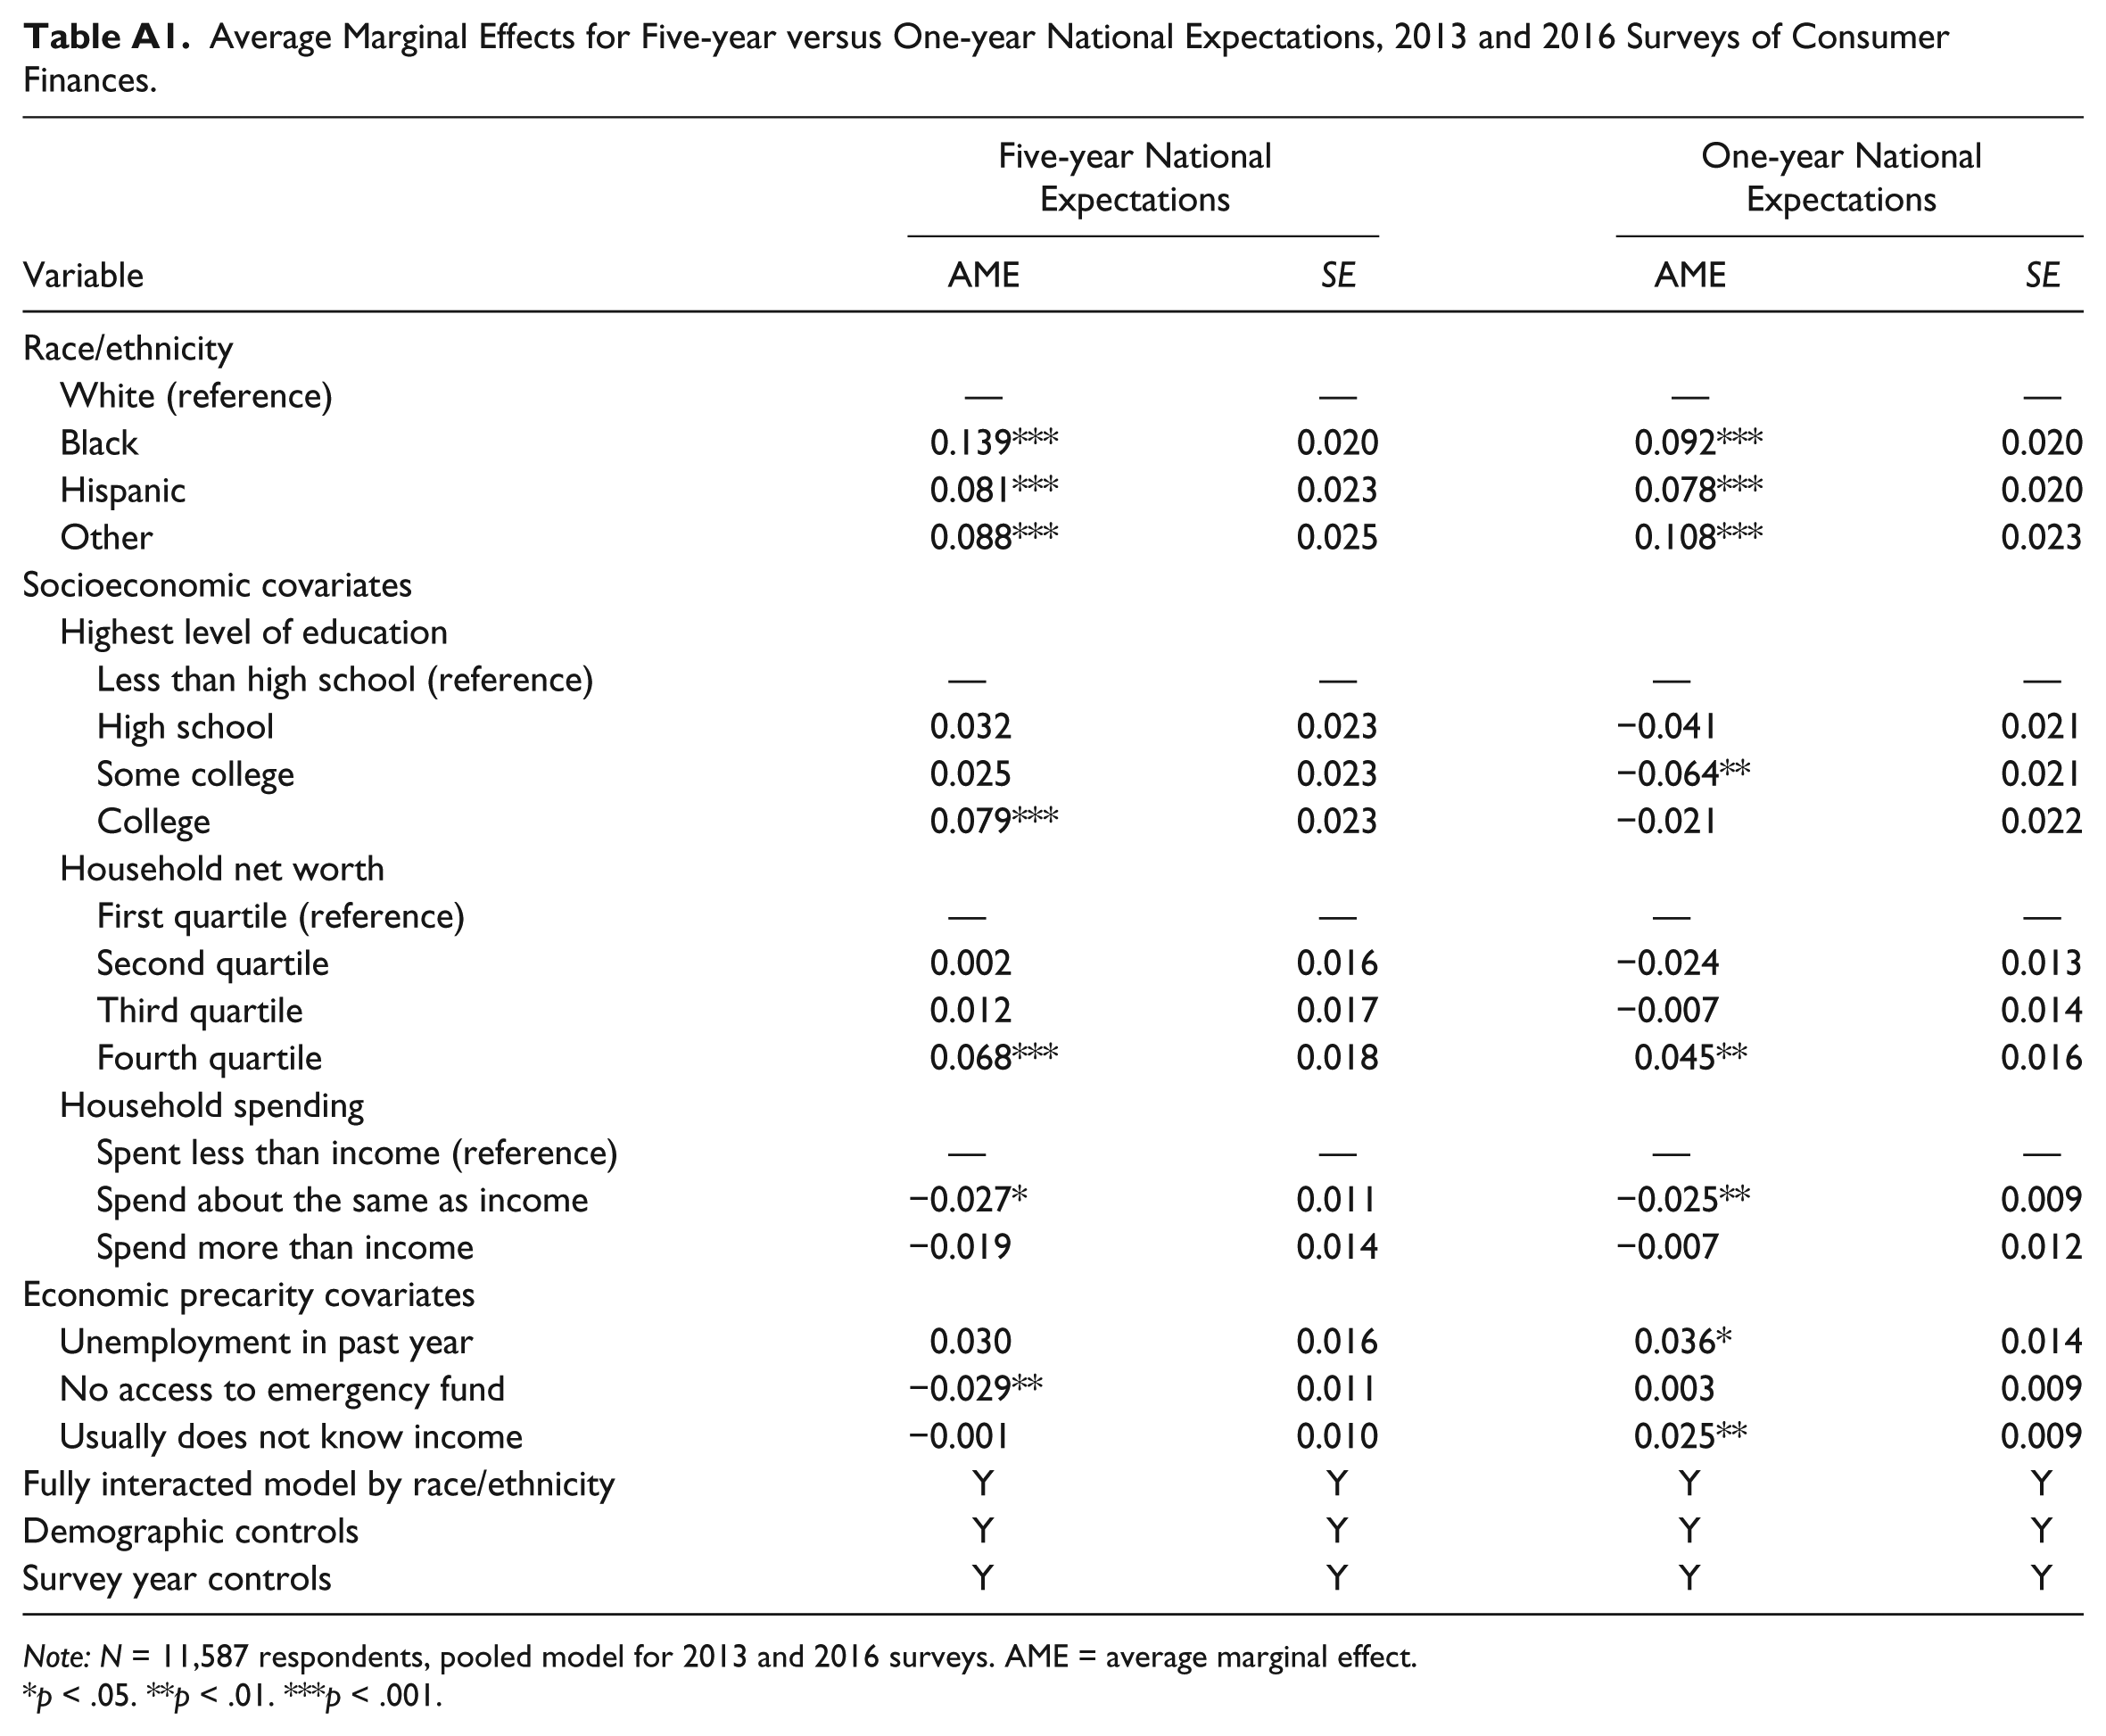
Finally, the national and personal expectations questions in the SCF differ in terms of time horizons, which may affect results. The national question asks about the economic conditions five years ahead, while the personal question asks about household finances one year out. Beginning in 2013, survey administrators included an additional question about national expectations over the next year, which mirrors the personal finances question. To test whether the time horizon is driving the discrepancies in results, I conduct supplemental analyses that compare results for five-year and one-year national expectations using pooled 2013 and 2016 data. These results show that black-white and Hispanic-white gaps in national expectations for a one-year time horizon remain substantively similar to those for the five-year measure (see Table A1 in the Appendix).
Discussion
For expectations about the national economy, both blacks and Hispanics are more likely to have positive outlooks compared with whites, on average. Adjusting for socioeconomic status does not attenuate the higher likelihoods of positive expectations among blacks and Hispanics, nor does accounting for the economic precarity of the household. Moreover, Figure 3 shows that the divergent likelihoods persist over time, with the exception of one year (2004) in which whites’ probabilities of positive expectations increased to meet the relatively high probabilities of blacks and Hispanics. The racial and ethnic gaps in the likelihoods of positive national expectations remain in supplemental analyses that look at a one-year time horizon and incorporate individual-level political and religious affiliations and geographic region into the models. The day-to-day economic experiences and conditions commonly assumed to influence expectations do not explain the persistent racial and ethnic differences in national economic outlooks.
For personal expectations, introducing the socioeconomic measures as mediators initially widens the black-white and Hispanic-white expectations gaps, but once fully interacted with race and ethnicity, their inclusion weakens the race-expectations association. The association between race/ethnicity and expectations changes across different levels of socioeconomic status and precarity experiences, and the socioeconomic measures themselves are more significant and have larger magnitudes in these models. These findings underscore the importance of socioeconomic position and economic experiences in shaping personal financial outlooks, and suggests that these expectations are more closely linked to lived economic experiences.
The diverging outcomes across national and personal economic expectations also highlight the importance of the scope of expectations for understanding the race-expectations associations. These findings support the idea that abstract economic expectations are reflective of collective worldviews, while concrete economic expectations tend to reflect current economic experiences. In essence, my findings suggest that both opportunity structures and cultural frames matter for expectations, as Beckert (2016) theorized, but their influence depends on scope.
The Lingering Gap in National Expectations across Race/Ethnicity
Findings for national expectations echo prior work on educational and occupational expectations that show that blacks and Hispanics have more positive outlooks relative to whites, even after accounting for socioeconomic factors (Downey et al. 2009; MacLeod 1987; Mickelson 1990). It is striking that the groups that have historically experienced significant socioeconomic disadvantage are the most likely to have positive outlooks about the national economy. The theory of cultural frames may provide insight into why this is so: individuals’ expectations about the national economy, an abstract concept that remains undefined in the survey question, may be reflective of collective interpretations and perceptions of economic experiences, conditions, and futures.
For example, research has shown that consumers’ expectations can predict crises reasonably well (Liu and Moench 2014; Ludvigson 2004). At the time of the SCF in 2007, the effects of the great recession had not yet spread to the broader economy, but volatility was beginning to appear within financial markets (Cecchetti 2009). 2 As seen in Figure 3, in 2007 the predicted probability of positive expectations about the national economy among white respondents dropped almost by half from 2004 (from .46 to .25). Meanwhile expectations remained fairly stable for Hispanics (slight decline from .45 in 2004 to .40 in 2007) and virtually identical for blacks (.44 in 2004 and .43 in 2007). Why did expectations for whites decline so much more? It is possible that whites are more likely to interpret the national economy in terms of financial markets. On average, they have more exposure to financial markets and are more likely to hold investments compared with blacks and Hispanics (Keister 2000; Oliver and Shapiro 2006). As a result, as financial markets begin to waver, so might whites’ outlooks. For blacks and Hispanics, financial market conditions may be less tied to their interpretation of the national economy, and thus their predicted probability of positive expectations in 2007 remains largely consistent to those in 2004. Figure 3 shows that a similar phenomenon also occurs in 2001, when the United States was in the middle of a recession (Hamilton 2018). The predicted probabilities are significantly lower for whites compared with blacks and Hispanics (.25 vs. .35 and .45, respectively), suggesting that on average, the three racial/ethnic groups may be interpreting the recession and its impacts differently.
As a second example, Figure 3 also illustrates that blacks shift from a 45 percent likelihood of reporting positive expectations in 2007 to nearly a 70 percent likelihood in 2010, which both produces the largest change in likelihood and results in the highest likelihood in absolute terms for all groups across all years. Two thousand ten is also the only year when the difference in likelihood of positive expectations between blacks and Hispanics is statistically significant. Why might blacks have such high expectations about the national economy in 2010? This survey year coincides not only with the economy recovering from the great recession, but also with the fact that Barack Obama had become the first black president of the United States the year before. The unusually high likelihood of positive expectations among blacks may speak to an “Obama effect,” which posits that the election of the first black U.S. president inspired hope among black Americans, changing what they thought was possible to achieve (Marx, Ko, and Friedman 2009). This shared optimism among blacks may have filtered into their expectations about the national economy. To take a term from Small et al. (2010:15), the election may have expanded perceived “horizons of possibilities” for this sociodemographic group in ways that it did not for others.
These findings are consistent with Beckert’s (2016) proposed theory that cultural framing may serve as a mechanism for sociodemographic differences in national expectations, but more research is needed to better understand its role in expectation formation. For instance, Figure 3 shows that, with the exception of 2010, the probabilities of positive expectations for blacks and Hispanics are substantively similar, but cultural frames across these two groups likely differ in many aspects. Quantitative modeling cannot parse precisely how frames may differ across social groups nor can this empirical analysis determine what underlying factors contribute to these frames. Qualitative research that probes the formation of expectations is needed to fully understand the relationship between social influences, race and ethnicity, and subsequent economic outlooks.
Practical Implications
One may be skeptical about whether it matters that there is such significant residual racial and ethnic variation in national economic expectations. However, this unexplained gap has important, practical implications for the construction and use of consumer indices that measure consumer confidence in the economy. Consumption indices, such as the Index of Consumer Sentiment run by the University of Michigan, use similar expectations questions about both the national economy and personal finances as a way to measure consumption potential, aiming to anticipate near-term consumer behavior. The consistent variation in national expectations across racial and ethnic groups underscores that changes in the racial and ethnic composition of the United States could result in spurious change in consumer indices. Between 2000 and 2014 alone, more than half of the total U.S. population growth was driven by Hispanics (Stepler and Lopez 2016). If no other demographic changes occurred, the rising share of Hispanics—who are, on average, more likely to be optimistic about the future of the economy relative to whites—would shift aggregate expectations about the economy in a more optimistic direction. An increase in the aggregate level of consumer confidence in the economy as a result of demographic change may not translate into an increase in consumption, particularly if group-level differences in optimism are not positively correlated with group-level differences in subsequent consumption behavior.
It is unclear whether and how seriously such demographic differences are taken in the construction of current consumer indices in the United States. The monthly Index of Consumer Sentiment produced by the University of Michigan does not weight its indices by race and ethnicity, nor is it possible for researchers to analyze differences in expectations by race/ethnicity using the underlying survey. 3 As a result, it is difficult to say whether any change in aggregate measures of consumer sentiment from month to month or year to year is a meaningful signal of changing American economic conditions and consumption patterns or whether changes might simply reflect changing demographics within the sample over time.
This study also underscores that macroeconomic expectations are influenced by factors other than that household economic standing and experiences and may not be closely linked to lived economic experiences for many households. If this is the case, it raises an important question: do consumers’ economic expectations serve as a good basis for predicting future consumption? Other scholars examining the predictive power of such indices have found that there is “spurious volatility” surrounding national expectations questions over time (Dominitz and Manski 2004:64; but see Kellstedt, Linn, and Hannah 2015, who found some evidence of predictive validity of macroeconomic expectations questions). This spuriousness may be due in part to consistent sociodemographic group differences in outlooks even after accounting for economic status, experiences, and conditions.
There are some limitations to my quantitative analysis of economic expectations. First, my analysis relies on the use of broad racial and ethnic categories that are standard among surveys in the United States. This likely masks important variation occurring within each category, across racial and ethnic subgroups. Although I am unable to examine more fine-grained categories, my findings remain relevant for thinking about demographic changes, because consumer expectations indices are based on surveys that use similarly broad racial and ethnic categories. Second, my findings are based on racial and ethnic differences within the specific U.S. sociohistorical context and do not speak to racial and ethnic patterns in expectations within other countries. Finally, as noted earlier, qualitative research on expectation formation is needed to better understand the role of sociocultural factors in contributing to group-level differences.
These limitations notwithstanding, these findings build on an important interdisciplinary line of social science research that explores the heterogeneous underpinnings of consumers’ economic outlooks. I contribute a sociological perspective to this interdisciplinary literature by considering the roles of opportunity structure and social psychological frames in the formation of consumer expectations. The specific attention to race and ethnicity highlights consistent sociodemographic correlation with individuals’ national economic expectations that may produce inefficiencies in forecasting. Although more work is needed fully understand why these racial and ethnic differences persist, my findings underscore that economic experiences alone cannot account for differences across sociodemographic groups and caution against taking aggregate consumer confidence indices at face value.
Footnotes
Appendix
Average Marginal Effects for Five-year versus One-year National Expectations, 2013 and 2016 Surveys of Consumer Finances.
| Five-year National Expectations |
One-year National Expectations |
|||
|---|---|---|---|---|
| Variable | AME | SE | AME | SE |
| Race/ethnicity | ||||
| White (reference) | — | — | — | — |
| Black | 0.139*** | 0.020 | 0.092*** | 0.020 |
| Hispanic | 0.081*** | 0.023 | 0.078*** | 0.020 |
| Other | 0.088*** | 0.025 | 0.108*** | 0.023 |
| Socioeconomic covariates | ||||
| Highest level of education | ||||
| Less than high school (reference) | — | — | — | — |
| High school | 0.032 | 0.023 | −0.041 | 0.021 |
| Some college | 0.025 | 0.023 | −0.064** | 0.021 |
| College | 0.079*** | 0.023 | −0.021 | 0.022 |
| Household net worth | ||||
| First quartile (reference) | — | — | — | — |
| Second quartile | 0.002 | 0.016 | −0.024 | 0.013 |
| Third quartile | 0.012 | 0.017 | −0.007 | 0.014 |
| Fourth quartile | 0.068*** | 0.018 | 0.045** | 0.016 |
| Household spending | ||||
| Spent less than income (reference) | — | — | — | — |
| Spend about the same as income | −0.027* | 0.011 | −0.025** | 0.009 |
| Spend more than income | −0.019 | 0.014 | −0.007 | 0.012 |
| Economic precarity covariates | ||||
| Unemployment in past year | 0.030 | 0.016 | 0.036* | 0.014 |
| No access to emergency fund | −0.029** | 0.011 | 0.003 | 0.009 |
| Usually does not know income | −0.001 | 0.010 | 0.025** | 0.009 |
| Fully interacted model by race/ethnicity | Y | Y | Y | Y |
| Demographic controls | Y | Y | Y | Y |
| Survey year controls | Y | Y | Y | Y |
Note: N = 11,587 respondents, pooled model for 2013 and 2016 surveys. AME = average marginal effect.
p < .05. **p < .01. ***p < .001.
Acknowledgements
I would like to thank Richard Swedberg, Kim Weeden, Laura Tach, Matthew Hall, Youngmin Yi, and Emily Sandusky for their thoughtful feedback on earlier versions of this report.
1
Supplemental analyses also account for whether the respondent’s spouse (if married) was unemployed in the past year; the inclusion of this measure did not substantively change results.
3
Personal correspondence with staff members at the University of Michigan, which maintains the Survey of Consumers and relevant indices, on August 8, 2015, and May 4, 2017, confirmed that they “do not use race in their analysis or reporting.”