
Abstract
I provide a tiled visualization of average monthly birth rates between 1938 and 1991 for the United States and England and Wales. Ideas about demographic “generations” such as Baby Boomers, Generation X, and Millennials are in widespread use in popular discussions of social change, often quite fancifully. The visualization makes apparent the sheer scale of the U.S. Baby Boom in comparison to other alleged generations.
The concept of the cohort has a long history in sociology and demography (Ryder 1965), and satisfactorily disentangling age, period, and cohort effects has been a persistent focus of research (Fosse and Winship forthcoming). Yet for at least the past decade, popular or otherwise high-profile accounts of social change have shown little interest in this work. Instead, the idea of “generations” has become a powerful organizing trope. References to named generations and their alleged characteristics, from the “Silent” through to the as yet uncharacterized “post-Millennial” (Dimock 2018), are by now ubiquitous. However, the sheer scale of the 1946–1964 U.S. “Baby Boom” generation dwarfs its counterparts in a way that makes the search for similar generational boundaries in later years seem forced.
It is worth making this point in a visually accessible way. Figure 1 draws on birth data for the United States and England and Wales to present two tiled plots of average monthly births between 1938 and 1991. The scale of the U.S. baby boom from mid-1946 to the end of 1964 is immediately apparent. It is far larger either than subsequent years in the United States or any period in England and Wales. Even the “early boom” beginning in September 1942 (nine months after December 1941, when the United States entered the war) and ending about a year later is substantially larger than any post-1964 year. No other periods show anything like the same scale, growth or decline, or anything approaching the discontinuity in birth rates that characterizes the Baby Boom. The absence of such discontinuities in the post-1964 years (positive or negative) makes any confident periodization of post-Boom “generations” seem specious.
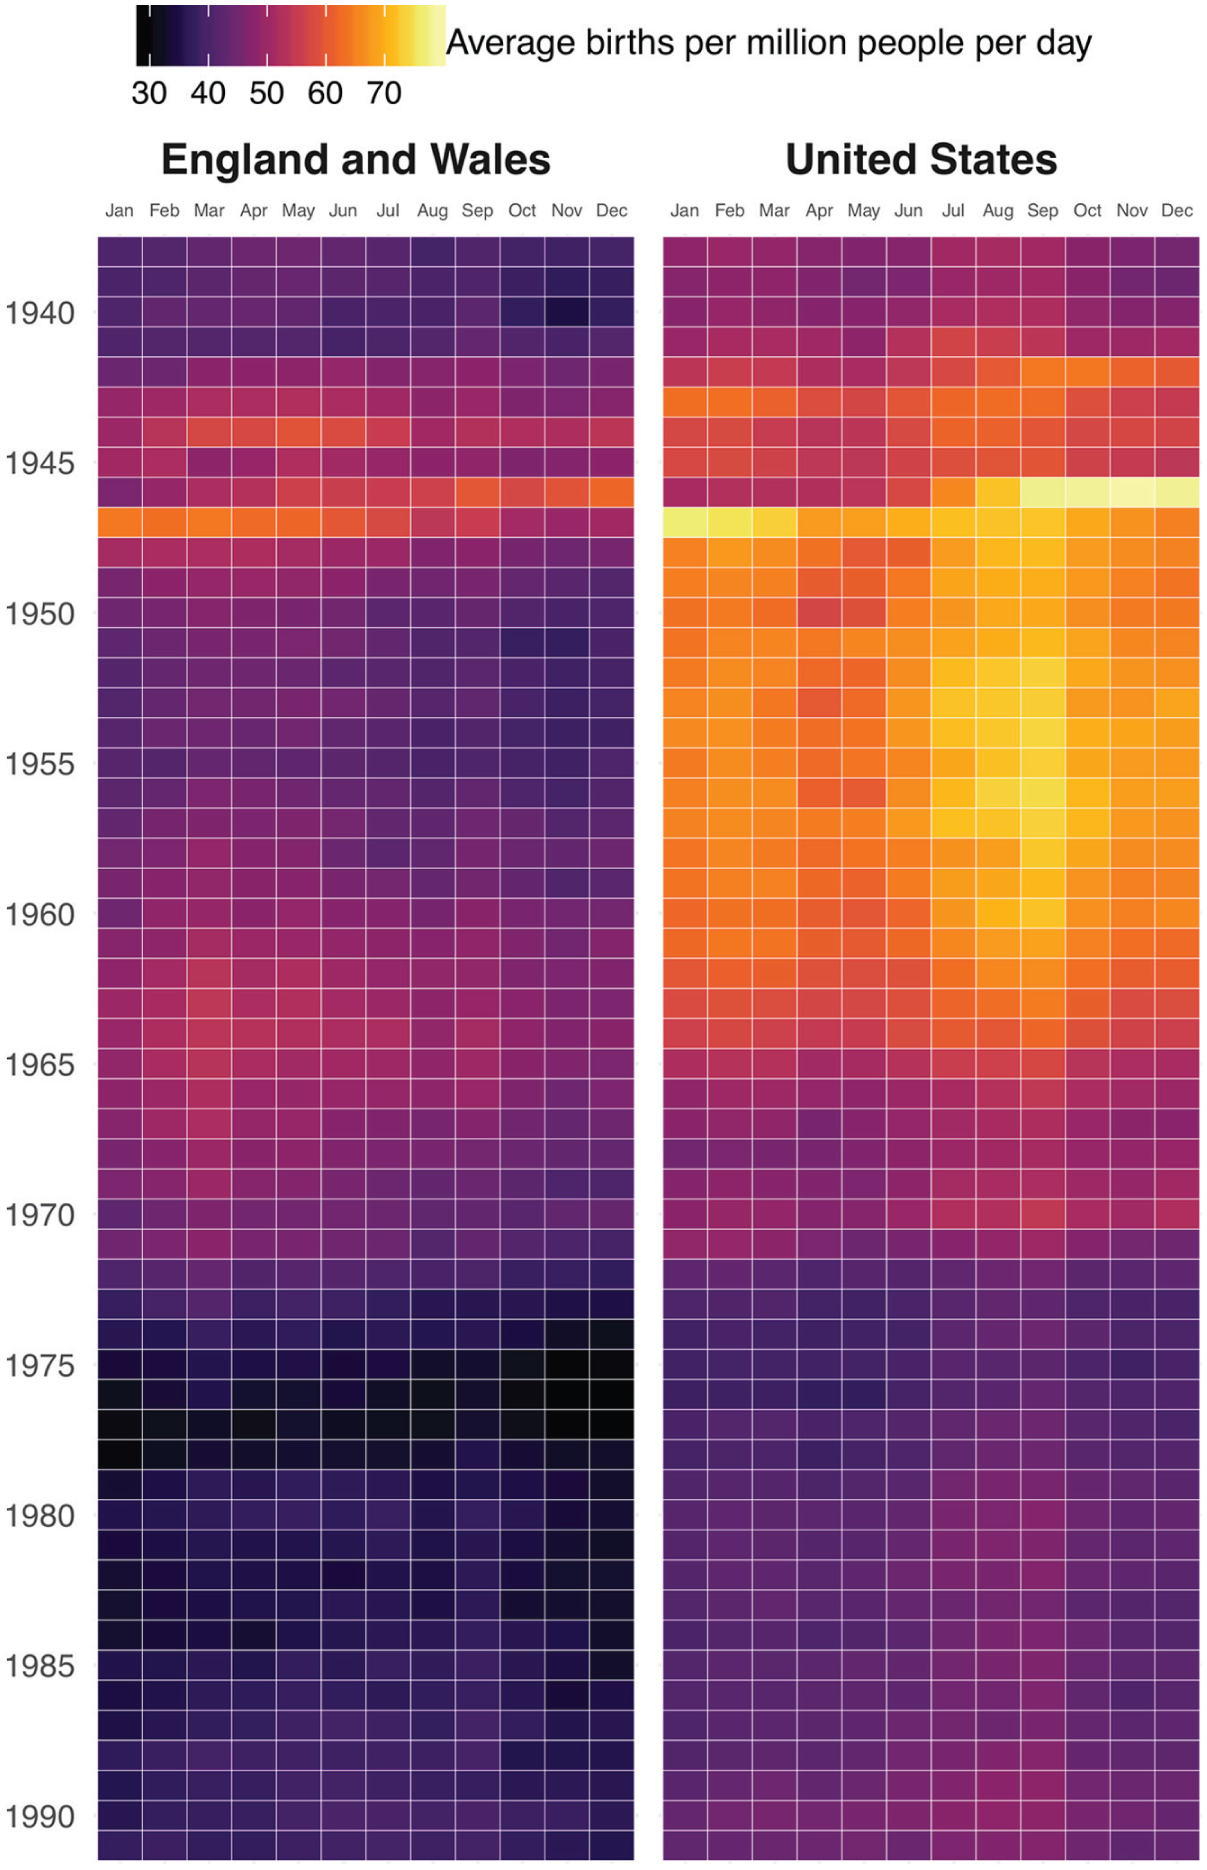
Average births per million people per day, 1938–1991. Each tile represents one month. The underlying count is number of births per month, standardized first by the total population for the period and then by the number of days in that month. Data for the United States are from the U.S. Census Bureau. Data for England and Wales are from the U.K. Office of National Statistics.
The comparison with England and Wales is also instructive. We see a sharp rise in births in 1946–1947, but then rates return to previous levels almost immediately. (Rationing continued in Britain until 1954.) England and Wales do experience a substantial increase in birth rates during the 1960s, peaking in 1964, but again on nothing like the same scale as the 1946–1947 spike, let alone the sustained U.S. boom.
Laying out the data in the tiled format used here allows for a more detailed representation of monthly changes than can be conveyed in a single line plot for a time series of this length. It also allows us to discern tendencies in the seasonality of births. (September is consistently the peak birth month in the United States.) The palette was chosen for its perceptual uniformity, efficient use of a wide slice of the color space, and visibility to colorblind viewers. The plot was produced using R and ggplot (R Core Team 2018; Wickham 2016). Data and code to fully reproduce the plots, together with alternative ways of visualizing the same data, are available at http://github.com/kjhealy/boom.