
Abstract
Whereas existing research typically treats variability in residents’ reports of collective efficacy and neighboring as measurement error, the authors consider such variability as of substantive interest in itself. This variability may indicate disagreement among residents with implications for the neighborhood collectivity. The authors propose using a general measure of social distance based on several social dimensions (rather than measures based on a single dimension such as racial/ethnic heterogeneity or income inequality) to help understand this variability in assessments. The authors use data from wave I (2001) of the Los Angeles Family and Neighborhood Survey (n = 3,570) to aggregate respondents into egohoods of two different sizes: quarter-mile and half-mile radii. Consistent with expectations, neighborhoods with higher levels of general social distance have higher variability in reports of neighboring and the two components of collective efficacy, cohesion and informal social control.
Collective efficacy and neighboring have been central concepts in the study of neighborhoods and crime, as well as in the broader literature on neighborhood effects and social capital, over the past two decades. Although both constructs are generally regarded as properties of neighborhood collectivities, they are routinely measured by aggregating the survey responses of individual residents. In the ecometric approach (Raudenbush and Sampson 1999), differences in resident reports are treated as measurement error, under the assumption that different kinds of people simply perceive or report different levels of neighborhood phenomena according to individual characteristics, and their responses are understood to vary around the “true score” for the neighborhood. The present study considers the possibility that this variability is due to structural social distance—what McPherson, Smith-Lovin, and Cook (2001) defined as the social difference between individuals on the basis of key sociodemographic measures—which may affect social interaction among neighbors. Because individuals infer efficacy from the symbolic qualities of interaction (Bandura 1986), structural social distance is particularly salient for explaining these aspects of community in the neighborhood context.
We suggest a key innovation in examining the relationship between social distance and collective efficacy/neighboring: the variability in assessments of collective efficacy within the neighborhood. One commonality in the neighborhoods literature is its focus on the average of a particular neighborhood construct (e.g., collective efficacy). We build on recent work and contribute to this literature by considering the variability in assessments of collective efficacy and neighboring as of substantive interest in itself. Scholars in the psychology tradition have suggested that such variance within groups is important to consider (Zaccaro et al. 1995), as differences between individuals may indicate a lack of agreement. The possibility and sources of such disagreement is worthy of examination, as the notion of collective efficacy rests upon a presumption of potential for collective action. One recent study examined variance in collective efficacy assessments as an outcome in relation to increasing Latino immigrant concentration at the tract level (Browning, Dirlam, and Boettner 2016). Our approach offers a further contribution by attending to the concern that census-delineated units homogenize the true diversity of urban space, and we situate our analyses within a broader social distance framework.
Our central argument is that social distance will not only affect general perceptions of collective efficacy and neighboring but also reduce the level of agreement among residents regarding these constructs. We consider five dimensions of structural social distance: socioeconomic status, race/ethnicity, stage of life course, social upbringing, and neighborhood attachment. Using data from the 2001 Los Angeles Family and Neighborhood Survey (n = 3,570), we examine these research questions and discuss the implications of our findings for neighborhoods research.
Background
Neighboring and Collective Efficacy
Neighboring and collective efficacy figure prominently in the neighborhood effects and social capital literature of the past few decades. Neighboring is the extent of mutual assistance and socializing among neighbors (Unger and Wandersman 1985) and is associated with key neighborhood outcomes, such as crime (Bellair 1997; Skogan 1989; Warner and Rountree 1997; Wilcox et al. 2004), informal social control (Bellair 2000; Bellair and Browning 2010), organizational participation (Hunter 1974; Perkins, Brown, and Taylor 1996; Unger and Wandersman 1983), and the reduction of fear (Oh 2004; Ross and Jang 2000). Representing the extent to which communities believe they are able to realize commonly held goals and exert social controls accordingly, collective efficacy has emerged as a consistent link between neighborhood structure and numerous outcomes, such as crime and fear of crime (Sampson 2012), individual health (Browning and Cagney 2003; Burdette, Wadden, and Whitaker 2006; Cohen et al. 2006; Roman and Chalfin 2008), and civic concerns (Sampson 2012; Wickes, Hipp, Sargeant et al. 2013).
Given the power of collective efficacy and neighboring to explain neighborhood differences in a number of important outcomes, subsequent research turned to examine the neighborhood-level factors that shape their emergence. Prior research finds that neighborhood socioeconomic status, racial/ethnic composition, residential stability, the built environment, and disorder explain some of the between-neighborhood differences in neighboring (Greif 2009; Guest et al. 2006; Hipp et al. 2014; Lee, Campbell, and Miller 1991; Ross and Jang 2000; Unger and Wandersman 1982). Beyond the structural characteristics derived from social disorganization theory (i.e., racial/ethnic heterogeneity, poverty, and residential instability) (Shaw and McKay 1942), additional neighborhood predictors of collective efficacy include perceived gang activity and violence (Duncan et al. 2003), neighborhood social networks (Browning, Feinberg, and Dietz 2004; Morenoff, Sampson, and Raudenbush 2001; Wickes, Hipp, Sargeant et al. 2013), perceived disorder (Gibson et al. 2002), and the built environment (Cohen, Inagami, and Finch 2008).
A parallel line of work suggests that perceptions of collective efficacy and reports of neighboring behaviors vary considerably across individuals, constituting within-neighborhood differences. Such research finds variability in neighboring according to sociodemographic characteristics such as race/ethnicity, socioeconomic status, gender, homeownership, age, and neighborhood tenure (Campbell and Lee 1990; Greif 2009; Guest et al. 2006; Nation, Fortney, and Wandersman 2010; Schieman 2005). Similarly, research finds that those with higher socioeconomic status, homeowners, older individuals, and in some studies women perceive higher levels of collective efficacy (Duncan et al. 2003; Gibson et al. 2002; Sampson, Raudenbush, and Earls 1997; Wickes, Hipp, Sargeant et al. 2013), while high mobility predicts lower perceived collective efficacy (Sampson et al. 1997).
Although this research indicates a host of individual characteristics that predict perceptions of collective efficacy and neighboring, researchers have not offered a theoretical framework to interpret these findings beyond the heterogeneity hypothesis of social disorganization theory (e.g., Browning et al. 2016). As such, we are left with the impression that individual differences in these perceptions and behaviors can be reduced to a “kinds of people” argument. An alternative interpretation of these findings is that residents within the same neighborhood may disagree on the extent of collective efficacy and neighboring in their community. Extant research situated at the neighborhood level has ignored the substantive meaning of this variability in assessments, treating it instead as measurement error. Indeed, the ecometrics approach is premised on the idea of parsing apart the systematic part of these differences on the basis of the sociodemographic characteristics of residents (Raudenbush and Sampson 1999).
But although scholars typically aggregate the survey responses of individual residents to measure neighboring and collective efficacy (Entwisle et al. 2007; Sampson 2012; Zaccaro et al. 1995), they are fundamentally conceptualized as neighborhood phenomena: properties of the neighborhood collectivity itself. We propose that relying on individual characteristics alone to predict neighborhood phenomena ignores the interpersonal and interactional dynamics that shape their emergence (Bursik and Grasmick 1993). Given that both collective efficacy and neighboring involve instrumental and symbolic exchanges between individuals (Bandura 1986; Bourdieu 1986; Unger and Wandersman 1985), their development necessitates at least a dyadic connection between residents. We argue for a more explicit consideration of these interdependencies between residents, as well as the interdependence between neighborhood structure and residents’ agency. Taking these issues as our focus, in the present study we assess the degree to which social structure is extended into this interactional process, potentially shaping the degree to which residents engage in mutual exchange and assistance, by examining structural social distance between residents. We suggest that structural social distance is one approach to explicitly move beyond the summation of individual perceptions to represent neighborhood structure and more explicitly capture interdependencies between residents.
Social Distance
Foundational sociological theory informs the notion of social distance as a structural property. We emphasize that this is a distinct concept from how social network scholars think of social distance in terms of the number of “steps” two persons are apart from one another in a social network. Instead, we focus on the notion of structural social distance, in which Merton (1968) argued that individuals assume social roles determined by their structural position, or social status. Each role entails a unique set of expectations that in turn shapes individual behaviors and attitudes. This idea is further developed in Bourdieu’s (1984) notion of the “habitus,” whereby the interplay of agency and social structure forms a schema of tastes, attitudes, beliefs, and dispositions. Social structure is reproduced and legitimized through the evocation of cultural cues and symbols that serve as markers of social distinction. The recognition of difference through such cues creates social distance between individuals, as they infer that other qualities of the individual are divergent from their own. The social categories that signify difference among residents may constitute a degree of social distance that even impedes social interaction with neighbors (Connerly and Marans 1985; Rountree and Warner 1999; Warner and Rountree 1997). As a consequence, social distance may increase isolation and reduce trust in the neighborhood for a resident (Ross and Jang 2000), or it can reduce a sense of cohesion among residents in the neighborhood (Morenoff et al. 2001). This all suggests that more social distance will be associated with less neighboring and collective efficacy.
One alternative possibility is that social distance may help generate new ideas or solutions to neighborhood problems that would not otherwise develop, at least to some degree. Neighborhoods with high social distance likely have the most potential to form bridging and weak ties (Granovetter 1973; Hunter 1985), allowing a greater diversity of information and access to resources. Additionally, more heterogeneous groups have been shown to contain a greater variety of skills, which may increase their ability to accomplish collective goals (Hoffman and Maier 1961). Thus, the notion that some social distance may actually be beneficial suggests nonlinearity in its consequences for neighboring and collective efficacy.
The categories that create social distance are society specific and can even change over time. And whereas the dimensions of social distance proposed and examined in the present study are extensive, there are certainly other forms not included here. For example, past work has found that political affiliation, beliefs, and attitudes can constitute a source of social distance. Although political differences are not visibly noticeable between persons (in contrast to features such as age and race), they nonetheless can create social distance (Akerlof and Kranton 2010; Laumann and Senter 1976). This is further reflected in work that finds that political discussion networks tend to be homophilous (e.g., Huckfeldt, Johnson, and Sprague 2004; Huckfeldt and Sprague 1995; Knoke 1990; Mouw and Sobel 2003), though social networks tend to be homophilous in general, adjusting for structural opportunity (Blau 1977a; Blau, Beeker, and Fitzpatrick 1984; McPherson et al. 2001). Another facet of social distance not examined here is religion (Blau 1977b; Putnam 2007; Smith, McPherson, and Smith-Lovin 2014; Triandis and Triandis 1960), as differences in values, attitudes, and even customs regarding dietary practices may generate social distance (e.g., Bellah et al. 1985; Durkheim 1976; Fischer 1982). However, Putnam (2007) argued that although religion was a dimension that created considerable social distance in U.S. society in the middle twentieth century, it is a less important form of social distance now. Finally, language may be an additional form of social distance, as language differences constitute a very real barrier to social interaction. This is reflected in prior work that suggests homophily in recent immigrants’ social networks (Titzmann, Silbereisen, and Mesch 2012; Titzmann, Silbereisen, and Schmitt-Rodermund 2007). In settings in which there are immigrant groups, there can be differences in spoken language, and this language difference can foster a particularly sharp social distance (Hipp and Boessen 2012; Hipp and Wickes 2016; Wickes, Hipp, Zahnow et al. 2013).
Nonetheless, prior research has focused on five key social characteristics that are consistently important for fostering social distance in neighborhoods (Hipp 2010; Hipp and Perrin 2009): (1) socioeconomic status, (2) racial/ethnic differences, (3) stage of life course, (4) social upbringing, and (5) attachment to neighborhood. 1 With these social categories in mind, we consider social distance as a multidimensional construct and measure it as such. The idea of creating a measure of social distance on the basis of several dimensions was empirically explored by Hipp (2010) in a study of micro-neighborhoods. Using micro-neighborhoods of approximately 11 households each, Hipp first measured the social distance between each dyad of persons and then created a social network on the basis of this matrix. This study found a nonlinear, U-shaped relationship between social distance and perceptions of crime, as well as consequences for perceptions of disorder. This built on the ideas of Peter Blau (1977a, 1977b) to construct a measure of the distance between any two individuals on the basis of several social dimensions.
Thus, a multidimensional measure of social distance does not simply aggregate single dimensional measures of social distance such as inequality, racial heterogeneity, and so forth. Instead, for example, two persons who differ by race but are similar on income, marital status, age, and education will actually have a relatively low level of social distance (because all of these dimensions are simultaneously taken into account). However, two persons who are the same race but have difference in income, age, marital status, and children would have relatively high social distance. Thus, this is a multidimensional measure of social distance that captures whether it is these cross-classifying differences that matter for creating distance (Blau 1977b). Simply creating separate single-dimension measures of social distance is conceptually different.
Few studies have created multidimensional measures of social distance to assess neighborhood outcomes. One study that did use a general social distance measure in neighborhoods tested and found that the individual-level measure was associated with increased depressive symptoms (Takagi et al. 2013). This may suggest that persons more socially distant from their neighbors are more socially isolated with fewer social ties, potentially leading to depressive symptoms. Another study of residents in Brisbane and Melbourne neighborhoods focused on social distance created by ethnic difference and found that residents who lived in such neighborhoods reported less neighboring, cohesion, and attachment to the neighborhood (Hipp and Wickes 2016). Although the findings of these studies indicate some empirical support for our argument, we are aware of no studies assessing the relationship between general social distance and neighboring or collective efficacy.
Variability within the Neighborhood
When examining the consequences or determinants of collective efficacy or neighboring, most prior research focuses on the mean of a particular construct. This common approach conceptualizes neighborhood structure as the aggregation of individual perceptions to create a “typical” perception for the neighborhood. Although an understanding of the typical case for the neighborhood is quite useful, we suggest a need to also consider the variance, or spread, of responses around the typical case in the neighborhood. An examination of the variance of collective efficacy and neighboring allows insight into the extent of agreement in the neighborhood, and this may provide a more nuanced understanding of collective dynamics (Zaccaro et al. 1995). For example, in a hypothetical neighborhood with one group reporting high collective efficacy and another group reporting low collective efficacy, their mean response for the neighborhood would suggest an average neighborhood. But if we examined the variability in collective efficacy, the “average” picture of the neighborhood would be quite different and reveal a neighborhood with considerable heterogeneity, potential for conflict, and disagreement among subgroups or individuals. Although the mean is quite useful, it fundamentally masks the possibly unequal distribution within the neighborhood (Hipp 2016).
This issue may be crucial, as heterogeneity around the mean may be precisely the variability of interest for many neighborhood processes. As another example, if residents had low (or high) mean collective efficacy for the neighborhood, this indicates some similarity in their shared expectations for mutual support, because there appears to be agreement on their low (or high) assessments. But an area with high variance would imply considerable disagreement in their shared expectations for the neighborhood. Put differently, it is possible that residents may not feel a sense of cohesion and mutual support among neighbors (i.e., they have low mean collective efficacy) but be in general agreement about this perception (i.e., low variance). Consider two neighborhoods with average levels of cohesion, but the first has much variability in these assessments, whereas the second has little variability: although everyone in the second neighborhood believes there is only a moderate level of cohesion, this agreement may increase the possibility of action to try to improve this level of cohesion, whereas in the first neighborhood there is not even agreement around this need for increased cohesion, and therefore action to address levels of cohesion would not occur. This all suggests a need to examine not only the mean but also the variance of collective efficacy and neighboring. Whereas psychologists have considered this possibility in the context of small groups, prior neighborhood research rarely empirically examines this possibility. One recent exception considers how Latino immigrant concentration shapes variability in collective efficacy assessments at the tract level, in an effort to address the tension between ethnic heterogeneity and immigrant revitalization hypotheses (Browning et al. 2016). The authors found a nonlinear effect such that at low levels of concentration, increasing Latino immigrant presence has a positive association with variability (e.g., greater disagreement), while at high levels of concentration, the effect becomes negative.
A key contribution we make to this literature is considering the consequences of social distance for neighboring and collective efficacy variability/disagreement, and we expect neighborhoods with greater general social distance to have more disagreement/variability in their assessments of neighboring and collective efficacy. The prior focus of Browning et al. (2016) on Latino immigrant concentration provides just one example of the types of contexts in which social distance is salient. For example, prior research found that gentrification processes often lead to stable or increased diversity (Freeman 2009). Thus, demographic shifts in gentrifying neighborhoods may produce contexts in which individuals differ markedly with regard to age and family structure, race/ethnicity, social class, and attachment. Other literature documenting the conflict that arises out of the often opposing interests of newcomers and long-term residents underscores the potential implications of social distance in changing urban neighborhoods (e.g., Freeman 2006; Pattillo 2007; Smith 1996).
Data and Methods
Data
The data for the present study come from the first wave of the Los Angeles Family and Neighborhood Survey. Collected in 2001, the study used a nested sample design in which 65 tracts were sampled from three strata: very poor (top 10 percent of poverty distribution), poor (60th to 89th percentiles) and nonpoor (bottom 60 percent). Blocks were then sampled from each tract, households were sampled from each block, and children and adult respondents were sampled from each household. Clusters and households were oversampled in the very poor and poor strata because they were fewer and of analytical interest, and an equal number of households in each cluster were sampled to minimize variance. The result is a total sample of 3,085 households in 428 blocks and 3,570 adult respondents. 2 The response rate was 85 percent among adult respondents. The sample size is 283 egohoods (one for each egohood with at least 5 respondents).
Although the challenges associated with measuring neighborhoods are well known (Hipp 2007), we depart from the more common approach of defining neighborhoods with discrete boundaries (i.e., an “urban village”), and instead we follow recent work by Hipp and Boessen (2013) and aggregate respondents into quarter-mile and half-mile egohoods with overlapping boundaries. 3 Egohoods take into account how individuals typically use urban space: the daily activities pattern literature has shown that residents’ activity locations tend to occur closest to their home, with activities further from the home less frequent (Lee and Kwan 2010; Ren and Kwan 2009). Likewise, research on the location of residents’ social networks typically finds that social ties are located closest in space, with a distance decay function regarding the probability of ties further away (Caplow and Forman 1950; Festinger, Back, and Schachter 1950; Hipp and Perrin 2009). In the mental mapping literature, when residents are asked to draw their neighborhoods, a recurrent pattern is that residents tend to draw the neighborhood with themselves at the center (Coulton et al. 2001:375; Grannis 2009:99–101). 4 Hipp and Boessen (2013) showed that an advantage of egohoods is that they capture the heterogeneity that exists across the social landscape. Given that collective efficacy, neighboring, and social distance are based on interdependencies between residents, the egohoods approach considers interdependencies between neighborhoods to capture these sociospatial phenomena.
Egohoods are constructed by taking the block in which the respondent is located and drawing a buffer around it of some particular radius. Every block whose centroid is within that buffer is considered part of the egohood, and the variables of interest are then computed on the basis of the values in the blocks within the buffer. We tested both quarter-mile and half-mile buffers given the indeterminacy in the literature regarding the proper spatial extent of a “neighborhood” to empirically assess the effects here. Egohoods differ from egocentric neighborhoods in that they do not use a distance decay effect; egocentric neighborhoods assume that the surrounding area “acts upon” the person, whereas Hipp and Boessen (2013) made clear that egohoods are assumed to be a unit of interest in themselves and therefore do not employ a distance decay effect.
Dependent Variables
We have three outcome variables. The first is a measure of neighboring (Sampson et al. 1997). This measure is an index composed of responses to five survey questions: (1) how often do neighbors do favors for each other, (2) how often do neighbors watch over each other’s property, (3) how often do neighbors ask advice of one another, (4) number of adults you recognize in neighborhood, and (5) number of neighbors you’ve talked to in last 30 days. The other two outcome measures are the two components of collective efficacy: cohesion and perceptions of informal social control (Sampson et al. 1997). Three questions were combined into the measure of cohesion: (1) this is a close-knit neighborhood, (2) people are willing to help their neighbors, and (3) neighbors generally don’t get along (reverse coded). Three questions regarding perceptions of the neighborhood’s ability to respond with informal social control against social disorder asked, “Please tell me how likely or unlikely it is that your neighbors would step in and do something in each situation: 1) if kids are seen hanging out; 2) if kids were doing graffiti; 3) if kids were showing disrespect to adults.” We create separate measures for cohesion and expectations of informal social control rather than combining them into a single measure, given existing theoretical arguments for their separation (Hipp 2016; Wickes, Hipp, Sargeant et al. 2013), as well as empirical evidence from studies showing that these are distinct constructs (Bellair and Browning 2010; Browning et al. 2004; Horne 2004; Rhineberger-Dunn and Carlson 2009).
We created neighborhood-level measures. To do this, we estimated a factor analysis for each of these constructs and created factor scores for each individual on the basis of these factor loadings. We then aggregated these individual-level measures to egohoods.
Independent Variables
We constructed several independent variables using U.S. census data. Our key variables of interest are the measures of social distance. We constructed three different measures, the first two of which are common in the literature. First, we constructed a measure of racial/ethnic heterogeneity in the block group (or egohood) on the basis of the Herfindahl index (Gibbs and Martin 1962:670) (the groups are white, African American, Latino, Asian, and other races). Second, we constructed a measure of economic inequality on the basis of household income and using the Gini coefficient. 5 The heterogeneity measure can range from 0 to .8 (where .8 is the most heterogeneous egohood), and the Gini coefficient can range from 0 to 1 (with 1 as the most unequal). When constructing the egohood measure of inequality, we used the ecological inference approach to impute the income variables from block groups to the blocks within the block group. Basically, this approach builds an imputation model at the higher geographic unit (block groups) and then imputes to the smaller units (blocks) on the basis of these parameter estimates (for a more complete discussion of this, see the appendix to Boessen and Hipp 2015). 6
Third, we followed Hipp (2010) and constructed a measure of general social distance on the basis of a number of social dimensions. To construct the social distance measure we used the following 14 measures within five social dimensions on the basis of the responses of the household head in the survey. The dimension of socioeconomic status was captured with (1) household income (logged) and (2) years of education. The dimension of stage of life course was captured with (1) age, (2) married, and (3) presence of children. The dimension of race/ethnicity was captured with (1) black, (2) white, (3) Latino, and (4) other race. Although important dimensions of social upbringing include the socioeconomic status of a respondent’s household while growing up, we do not have such information in our sample. Instead, we included three measures that are rough proxies for the culture of a respondent’s household while growing up by measuring the dimension of social upbringing with (1) immigrant, (2) lived in the South at age 14, and (3) lived in California at age 14. An immigrant is someone who did not grow up in the United States and therefore likely has social distance from someone who grew up in the United States, and the shared culture of two persons of having grown up in California likely reduces social distance. Finally, the long history of cultural differences between the South and other parts of the country may lead to social distance, and we therefore included that measure as well. The dimension of attachment to the neighborhood was captured with (1) home owner and (2) length of residence in the current home in years (logged).
This approach creates a matrix of all sampled residents in the particular geographic unit (i.e., egohood), and then for each set of dyads in the neighborhood, the distance between the dyad members is calculated as follows:

where sdij is the social distance between individuals i and j; k represents the K number of social determinants being measured; xik and xjk are the values on social characteristic k for individuals i and j, respectively; φ k is the salience of social characteristic k (a weighting factor for its relative importance); and i ≠ j. Although there are various approaches that can be taken with continuous variables, we chose to standardize them so that interpretation would be based on standard deviations. These variables were age, years of education, logged household income, and logged length of residence in the current home. As noted by Hipp (2010), various weights of φ k could be used if we had theoretical reason to suspect this and empirical evidence for choosing particular values. Lacking this information, we adopted the simple equal weighting assumption. Nonetheless, given that race and income are often important dimensions, we assessed this by constructing separate measures of racial/ethnic heterogeneity and inequality to determine if these dimensions are indeed more important.
After calculating the social distance value for each dyad in the neighborhood, we have a matrix of social distances between dyads, which we then treat as a nondirectional valued network. 7 We constructed two measures. First, we follow Blau (1977a) and capture group cohesion with the density of ties in a network; in this case, this is the average social distance among all dyads (Wasserman and Faust 1994:181):

where all terms are defined as before, i < j (we only need to compute the values below the diagonal of this matrix given symmetry), [M*(M + 1)/2] is the number of dyads in the neighborhood, and sd measures the average social distance for the entire neighborhood. Thus, larger values would indicate neighborhoods with more social distance among the residents.
Second, we construct a measure of the variance of these dyad distances. As described in detail in Hipp (2010), high variance in social distance actually can operate as a proxy for the presence of subgroups within the neighborhood. Prior research has shown that the structure of social distance within the neighborhood is related to residents’ perceptions of social and physical disorder (Hipp 2010) and cohesion with the larger group (Paxton and Moody 2003). The variance of these social distance measures within the neighborhood indicates the amount of dispersion in the network (Wasserman and Faust 1994:182), and is calculated as

where all terms are defined as before, and sdij and sd are computed as shown in equations 1 and 2, respectively. Larger values indicate a neighborhood with considerable variability in the amount of social distance between dyads, which suggests the possible presence of subgroups within the neighborhood.
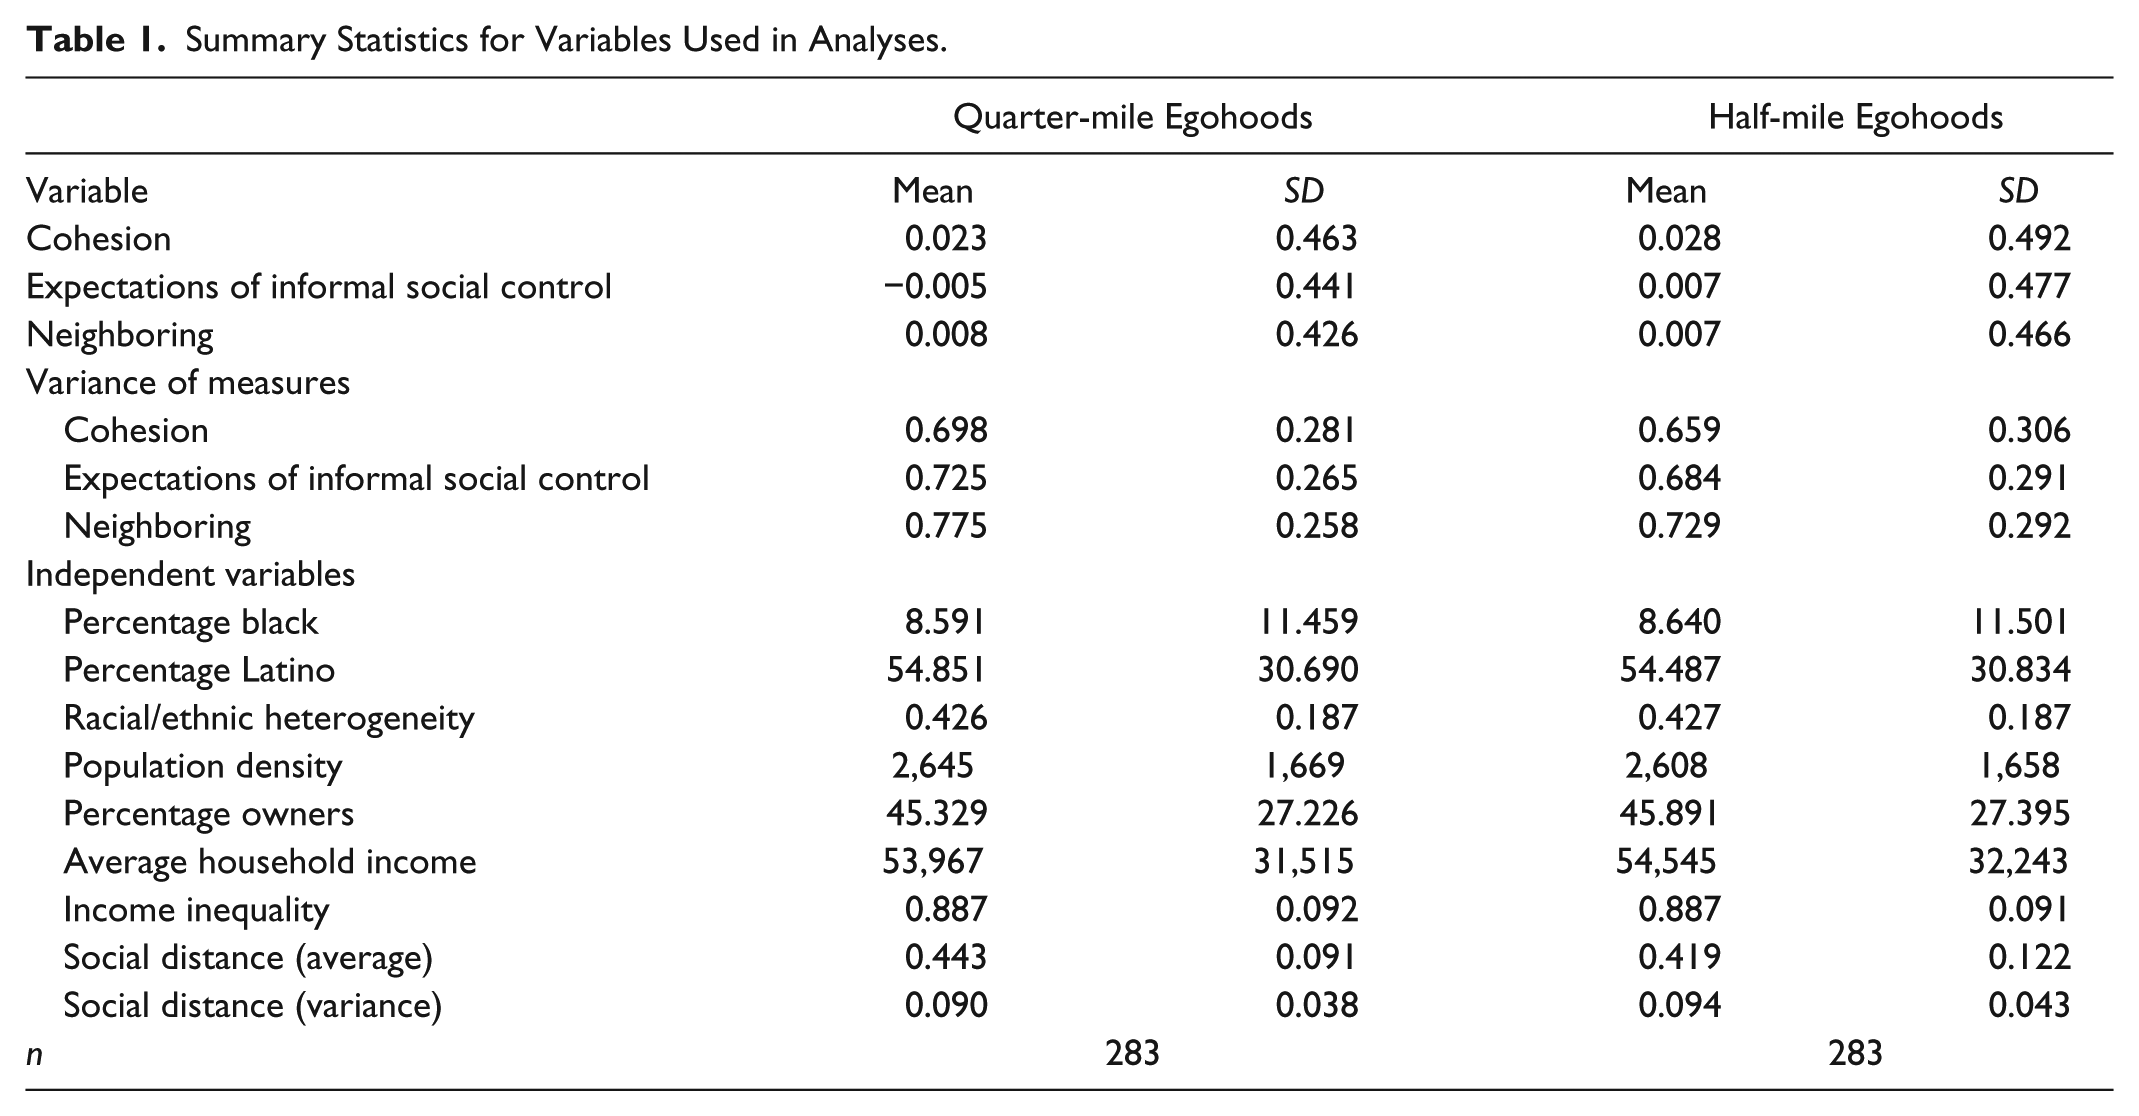
Several neighborhood-level measures important in prior literature are created from the 2000 U.S. census and included to minimize the possibility of spurious relationships. We account for the socioeconomic status of the neighborhood with a measure of the average household income. Racial composition is captured with measures of the percentage African American and the percentage Latino. To capture residential stability, we included a measure of the percentage owners. To capture both opportunity effects, as well as crowding, we included a measure of population in egohoods (because they have a constant area size, this is effectively population density). The summary statistics for the variables used in the analyses are displayed in Table 1.
Summary Statistics for Variables Used in Analyses.
Analytic Strategy
Given that our focus is on the neighborhood level, the models are estimated as linear regression models with the measures aggregated to the neighborhood level. Given that the sample was drawn from census tracts, we estimated the models with robust standard errors that account for this clustering. One set of models use the mean reported neighboring, cohesion, or expectations of informal social control in the neighborhood as the outcomes. A second set of models use the variance in reported neighboring, cohesion, or expectations of informal social control in the neighborhood as the outcomes. For these latter models, we account for the fact that the variance in these reported measures (e.g., cohesion) can be affected by the level of the measure in the neighborhood given ceiling and floor effects. For example, a neighborhood with very high levels of cohesion may have lower variance in reported cohesion simply because all respondents are capped at a particular high value when reporting on this. We account for this by including measures of the mean level of the construct (and its quadratic) in the models. For example, the mean level of cohesion and its squared version are included in the model predicting the variance in neighborhood cohesion.
We address all missing data with multiple imputation and impute five data sets, which are then combined in the analyses using the techniques of Rubin (1976). There was no evidence of problematic collinearity in our data; there was also no evidence that any of the cases were outliers or influential cases.
Results
Predicting Mean and Variance of Neighboring
We begin with our model in which the outcome measure is the mean level of neighboring in the neighborhood in Table 2. In model 1 we find that quarter-mile egohoods with more racial/ethnic heterogeneity have less neighboring, which is consistent with prior research. The standardized effect shows that a 1 standard deviation increase in racial/ethnic heterogeneity is associated with .29 standard deviations lower neighboring (β = –.289). We find a similar effect using half-mile egohoods as the aggregation in model 2 (β = –.255). There is no evidence in these models that higher levels of income inequality are related to the average level of neighboring. We see no evidence that our measures capturing the mean or variance of general social distance for egohoods are related to the average level of neighboring (this was the case whether or not we included the quadratic term for social distance).
Neighboring as Outcome: Ordinary Least Squares Models with Data Aggregated into Quarter-mile and Half-mile Egohoods.

Note: Numbers in parentheses are t values. N = 283 egohoods.
p < .05 (one-tailed test). *p < .05 (two-tailed test). **p < .01 (two-tail test).
The results are somewhat different for the models predicting the variance in neighboring in neighborhoods in models 3 and 4. Whereas there is no evidence that higher levels of racial/ethnic heterogeneity or income inequality in the egohood are associated with the variance in neighboring (models 3 and 4), we do see that egohoods with more total social distance have greater variance in perceived neighboring. When plotting these nonlinear effects in Figure 1, we observe a slowing positive relationship: increasing levels of social distance are associated with higher variance in reported neighboring but with a leveling off effect at the highest levels of social distance. These Table 2 results imply that in egohoods there will be high levels of disagreement when there is considerable social distance among residents. However, the mean level of neighboring in these egohoods will be closer to the average across neighborhoods given the nonsignificant effects for social distance in the models predicting the average level of neighboring.

Predicting variance in neighboring with average social distance.
Given the rarity in which this outcome measure is studied, it is worth briefly focusing on the coefficients of the control variables. We find that egohoods with a higher percentage of renters have higher variance in reported neighboring (β = –.213 for quarter-mile egohoods). The other measures in the model are not statistically significant, highlighting the importance of general social distance for explaining the variability in neighboring reports by residents. Finally, the strong nonlinear effects of the mean of neighboring for the outcome of the variance of neighboring account for ceiling and floor effects.
Predicting Mean and Variance of Cohesion
Turning to the models in which cohesion is the outcome, we find in Table 3 that levels of income inequality and racial/ethnic heterogeneity are generally not associated with average levels of cohesion; there is only a modest negative effect for racial/ethnic heterogeneity (p < .10). There is also no evidence in any of these models that average levels of social distance or the variance of social distance are related to average levels of cohesion. Instead, the strongest evidence in these models is that neighborhoods with higher percentages of Latinos or blacks, or higher percentages of renters, report lower levels of cohesion.
Cohesion as Outcome: Ordinary Least Squares Models with Data Aggregated into Quarter-mile and Half-mile Egohoods.

Note: Numbers in parentheses are t values. N = 283 egohoods.
p < .05 (one-tailed test). *p < .05 (two-tailed test). **p < .01 (two-tail test).
Turning to the models with variance in reported cohesion as the outcome, we see that general social distance shows the strongest relationship with this measure of disagreement among residents. In model 3 of Table 3, quarter-mile egohoods with 1 standard deviation more general social distance have .219 standard deviations higher variance in reported cohesion. Thus, greater social distance results in more disagreement about the level of cohesion among residents. In the half-mile egohood models, this relationship exhibits a slowing positive pattern (model 4). However, there is not an additional effect from subgroups in the neighborhood (on the basis of the measure of variance of social distance). We see that levels of racial/ethnic heterogeneity and income inequality are not associated with variance in reported cohesion.
Predicting Mean and Variance of Expectations of Informal Social Control
Our third outcome measure captures expectations of informal social control (Table 4). We find that the results for the models predicting average level of expectations of informal social control are similar to those for the average level of cohesion. Egohoods with higher percent black, Latino, and renters report lower levels of informal social control. However, the measures of racial/ethnic heterogeneity and income inequality are not related to the average level of informal social control expectations. Likewise, the average level of social distance and the variance of social distance are not related to the average level of informal social control.
Informal Social Control as Outcome: Ordinary Least Squares Models with Data Aggregated into Quarter-mile and Half-mile Egohoods.

Note: Numbers in parentheses are t values. N = 283 egohoods.
p < .05 (one-tailed test). *p < .05 (two-tailed test). **p < .01 (two-tail test).
In the models with the variance of reported informal social control expectations as the outcome, general social distance is important for explaining this disagreement among residents. We again see that levels of racial/ethnic heterogeneity and income inequality have no relationship with the level of disagreement among residents regarding these social control expectations. Instead, we see in model 3 that quarter-mile egohoods with higher levels of general social distance have modestly higher variance in their reports of informal social control expectations. We observe an even stronger relationship in model 4 for half-mile egohoods, which when plotted exhibited a slowing positive relationship. The other measures in these models do not help explain this level of disagreement among residents, highlighting the importance of general social distance in this regard.
Ancillary Models: Assessing Egohoods with Different Minimum Number of Households
A challenge for our analysis is that the Los Angeles Family and Neighborhood Survey did not survey residents from all tracts but rather only a sample of tracts. Therefore, our egohoods approach can encounter boundary problems in that some blocks near the edge of a sample tract will have a substantial part of the buffer in which we do not have any sampled residents. To assess if this is a problem, we estimated additional models in which we increased the minimum number of households for an egohood to be included in the models. This minimizes the possibility of including these “boundary” egohoods, at the risk of reduced statistical power. We present the results from three sets of models in Table 5 predicting the outcomes of variance in our measures of interest: the minimum of 5 as used in the main models, a minimum of 10, and a minimum of 15. The slowing positive relationship for the social distance measure was not detected when using these larger minimum cutoffs, and we therefore present the linear results for all models. As seen there, the results are not only robust, but even stronger, when using the higher cutoff values. For the outcome of variance in neighboring, the coefficient rises from .608 when using a minimum of 5 households for egohoods, to .857 with a minimum of 10 households, to 1.329 with a minimum of 15. Thus, the coefficient size more than doubles with this larger cutoff value. In the half-mile egohoods, we see that the coefficient predicting the variance in neighboring rises from 1.059 to 1.326 to 1.469 across these three cutoff values. The same story is repeated across the outcomes of variance in cohesion or informal social control. Thus, we detect quite robust results for the social distance measure. There is even some evidence that the variance in social distance has a stronger effect in half-mile egohoods with the larger minimum values.
Comparing Results for Variance Outcomes Using Egohoods Based on Different Definitions of Minimum Number of Households.

Note: Numbers in parentheses are t values. Sample size is 283 in minimum = 5 models, 164 in minimum = 10 models, and 87 in minimum = 15 models.
p < .05 (one-tailed test). *p < .05 (two-tailed test). **p < .01 (two-tail test).
Conclusion
This study has built on recent work and suggests that scholars need to think differently about neighborhood constructs such as neighboring and collective efficacy. Rather than simply focusing on the average level of these measures within neighborhoods, the focus of the present study was to understand why some neighborhoods have greater variability among the residents in their reports of these neighborhood-level constructs. By leveraging insights from the social distance literature, a key insight is that we were able to assess the effect of general social distance on both the average of these constructs in neighborhoods, as well as the variability in the reports of residents within the neighborhoods.
Although our examination of the effect of general social distance on average levels of these constructs showed no effect, we consistently found that egohoods with higher levels of general social distance had higher variability in the reports of all three outcomes. This was a slowing nonlinear positive effect which leveled off only at the highest levels of social distance for neighboring, and a positive linear relationship for cohesion and informal social control. Thus, greater structural social distance among residents leads to greater disagreement on these assessments of the neighborhood. And this effect was even stronger when we imposed a higher minimum value of the number of households sampled from these egohoods. This was consistent with our theorizing that this social distance creates disagreement in these assessments. This disagreement could occur for various reasons: perhaps because this social distance creates distinct ways of viewing the social world that result in different perceptions (Hipp 2010) or because social distance affects the formation of social ties, which then affect the information available to different residents. Future research is needed to distinguish the mechanisms underlying these effects.
We found that the results were relatively robust when measured at two different sized egohoods. In ancillary models, we used a more conventional geographic unit of block groups and found generally similar results, just slightly weaker. We argue that this weaker pattern occurs for similar reasons noted by Hipp and Boessen (2013) in their study of inequality and crime: traditional measures of neighborhoods (such as block groups) typically form boundaries on the basis of similarity. That is, such neighborhoods are created in an effort to minimize the amount of social distance that actually exists across the larger community. If these are actually “real” neighborhoods in which the residents actually identify with the geographic unit, this would not be problematic. However, given the evidence that such administrative units almost never correspond to residents’ perceptions of the neighborhood (Coulton, Jennings, and Chan 2013; Grannis 2009), this is unlikely to actually be the case here. Instead, the egohoods approach is purely spatial and therefore obtains measures of all the social distance that occurs within a prespecified buffer (in our case, quarter mile and half mile). The approach of accounting for the level of social distance present across this study area in Los Angeles found quite robust effects for social distance on the variability in these reports of collective efficacy and neighboring.
We also highlight that the two more conventional measures of social distance that we included, racial/ethnic heterogeneity and income inequality, had no predictive ability in the models predicting the variability in these assessments. Although we did find that higher levels of racial/ethnic heterogeneity were associated with lower average levels of neighboring, and modestly lower levels of cohesion, racial/ethnic heterogeneity did not affect the disagreement among residents regarding these measures. It may be that racial/ethnic difference is more visible, and therefore similarly affects the assessment of residents regarding neighboring and cohesion, whereas our more general measure of social distance has more subtle impacts on residents in that it leads to different assessments. Likewise, the measure of income inequality was not related to either the average levels of these measures or the disagreement among residents regarding these measures. Thus, these findings highlight that it is the more general measure of social distance that matters for understanding disagreement among residents, and not these more traditional measures of difference among residents on the basis of the single dimensions of income or race/ethnicity. This finding parallels the results of Hipp (2010) in which general social distance affected perceptions of disorder or crime in micro-neighborhoods, whereas racial/ethnic heterogeneity did not. An implication is that although differences in race/ethnicity or income are certainly important for certain neighborhood processes, scholars should more carefully consider the possible role of general social distance in neighborhoods.
We note some limitations for this study. We were limited to using data from residents in a single city. Therefore, caution must be exercised in generalizing the results to other locations. Second, we had data from a single point in time. We cannot be certain whether the effects of social distance observed here would generalize to other time periods. Third, tracts were a sample of the whole county, leading to boundary effects in our egohoods measures, as blocks near the boundary of a sampled tract would necessarily have large parts of their buffer containing no sampled households. We assessed the effect of this with ancillary models using larger minimum cutoff values of number of households in the egohood for inclusion in the models and found that the effects were even stronger in these ancillary models. Fourth, whereas we hypothesize that this social distance among residents would translate into a lower propensity to form social ties across this social distance, we lacked information on the presence of specific ties among residents, which is common in this literature because of the challenges of collecting these data. The evidence from prior studies that such social distance reduces the likelihood of forming social ties is suggestive (Hipp and Perrin 2009); nonetheless, further studies are necessary to test if this general social distance indeed affects social tie formation.
There is a question of how to account for individual-level characteristics of sample respondents in the models. A standard approach with a sample of individuals in neighborhoods is to estimate a multilevel model in which the outcome at level two is the latent variable of the neighborhood mean of the outcome variable. In this case, we are interested in predicting the variance of the outcome variable at the neighborhood level; although the MIXREGLS approach of Hedeker and Nordgren (2013) allows predicting this variance, our aggregation approach using egohoods is not in fact true nested data and therefore not suited to this strategy. 8 We therefore estimated ancillary models in which we instead adopted a two-step approach in which we first adjusted individual-level responses to the outcome variable on the basis of the demographic characteristics of the respondents and then used this information to adjust the measures for the neighborhood composition. Although this two-stage approach is not as efficient as an approach estimating the two-stages simultaneously, we have no reason to believe that the efficiency gains would be so great that they would change the results noticeably. Indeed, the results for our social distance variables were virtually unchanged when we estimated the models using this alternative approach. 9 Nonetheless, we leave the question of possible efficiency gains from a simultaneous estimation strategy to future researchers.
In conclusion, this study demonstrates the importance of explicitly considering why residents differ in their assessment of neighborhood characteristics. Continuing this line of inquiry to examine other community constructs should facilitate a greater understanding of the within-neighborhood dynamics that may ultimately contribute to observed differences between neighborhoods. Additionally, considering the salience of collective efficacy and neighboring to important neighborhood outcomes such as crime, future research should examine the consequences of variability in these constructs for neighborhood well-being. Finally, rather than focusing exclusively on measures of population heterogeneity on the basis of a single dimension, neighborhood researchers should consider general social distance as a more suitable measure for capturing the effect of structure on within-neighborhood dynamics.
Footnotes
1
Although gender would also be a key determinant for many outcomes, it has less meaning in a neighborhood context given that most households and neighborhoods are mixed in terms of gender.
2
We also tested models that excluded the primary caregiver subsample. The results were very similar, so we include these persons in the neighborhoods given that they increase statistical precision, and we have no reason to expect that they will cause bias (and no empirical evidence that they do).
3
We also estimated models using a more traditional measure of block groups and found generally similar results (just modestly weaker).
4
Typically, the instances in which persons do not place themselves in the center of their neighborhood it is because residents on the nearby blocks are very different from themselves socially. Nonetheless, in such instances, the fact that residents on these nearby blocks are so different will likely negatively affect the respondent’s perception of neighborhood cohesion, which is precisely what we measure here.
5
6
7
Note that network ties can be either directional (e.g., A provides advice to B) or nondirectional (e.g., A and B are friends). “Nonvalued” network ties are a dichotomous measure of the presence or absence of a tie, whereas “valued” ties capture the strength of the tie (such as a count or a proportion) (![]() ).
).
8
Attempts to estimate even simple MIXREGLS models with the egohood data did not converge. Given our theoretical interest in egohoods—and the empirical evidence that they more appropriately capture the structural social distance we are interested in—artificially creating level 2 units in an effort to create true nested data to use a particular estimation strategy is less appropriate than our approach.
9
We estimated ancillary models using variables that are compositionally adjusted in the spirit of “ecometrics” (![]() ). For these measures, we estimated fixed-effects models in which the outcome measure was the factor scores of a particular construct and the covariates were potential individual-level biasing effects and k – 1 dummy variables for the k egohoods. The following individual-level covariates are used: female, age, African American, Latino, other race, two-parent household, level of education, homeowner, length of residence in the home (logged), first year in the residence, number of moves in the past five years, and frequency of attending religious services. This parses out these possible biasing effects, and the parameter estimates for the indicator variables of the egohood units are then used as unbiased egohood-level estimates in the final models.
). For these measures, we estimated fixed-effects models in which the outcome measure was the factor scores of a particular construct and the covariates were potential individual-level biasing effects and k – 1 dummy variables for the k egohoods. The following individual-level covariates are used: female, age, African American, Latino, other race, two-parent household, level of education, homeowner, length of residence in the home (logged), first year in the residence, number of moves in the past five years, and frequency of attending religious services. This parses out these possible biasing effects, and the parameter estimates for the indicator variables of the egohood units are then used as unbiased egohood-level estimates in the final models.