
Abstract
Evidence suggests that unemployment negatively affects various aspects of individuals’ lives. The author investigates whether unemployment changes individuals’ political evaluations in the form of trust in government and satisfaction with democracy. While most research in this area operates on the macro level, the author provides individual-level evidence. In doing so, the author investigates the assumed causal link with panel data from Switzerland and the Netherlands. In addition, the author studies the impact on life satisfaction, a “control outcome,” known to be affected by unemployment. Although there is strong evidence that changes in employment status do affect life satisfaction, effects on trust in government and satisfaction with democracy seem mostly absent or negligible in size.
Trust in government and more generally satisfaction with democracy are regarded as indicators of the stability and performance of democratic systems but also as important determinants thereof (Almond and Verba 1963; Dalton 2004; Easton 1975; Hetherington 2005; Levi and Stoker 2000; Pharr and Putnam 2000). Especially in the wake of the economic crisis in 2008, scholars rang the alarm bells and pointed to the threat rising unemployment levels may pose to democratic systems (Arias et al. 2013; Kroknes, Jakobsen, and Grønning 2015; Muro and Vidal 2014; Roth 2009). Although most research focuses on unemployment’s negative personal consequences, such as depression or suicidal tendencies, there is also a long research tradition that links it to political phenomena such as voting behavior and political extremism (e.g., Bay and Blekesaune 2002; Falk, Kuhn, and Zweimueller 2011; Jahoda and Zeisel 1974; Linn, Sandifer, and Stein 1985; Lundin and Hemmingsson 2009; Siedler 2006; Stokes and Cochrane 1984). This research program, in part, speaks to the classic debate that contrasts pocketbook voters whose preferences are assumed to be “swayed most of all by the immediate and tangible circumstances of their private lives” (Kinder and Roderick Kiewiet 1981:130) and sociotropic voters whose preferences are influenced by a country’s economic condition (Hansford and Gomez 2015; Kinder and Roderick Kiewiet 1981:129–30).
The present study is guided by the following question: Does unemployment affect political evaluations in the form of trust in government and satisfaction with democracy? The study contributes to current scholarship in several ways. First, whereas the classic pocketbook versus sociotropic voter debate focuses on voting behavior, I investigate the link between unemployment and political evaluations (i.e., trust in government and satisfaction with democracy) (e.g., Hansford and Gomez 2015; Kinder and Roderick Kiewiet 1981). Both are regarded as essential resources for the performance and stability of political systems (e.g., Hetherington 1998; Levi and Stoker 2000). This research thereby contributes to a growing literature that investigates this link empirically (e.g., Arias et al. 2013; Kroknes et al. 2015; Muro and Vidal 2014; Roth 2009). I summarize previous arguments and empirical evidence and provide an overview of what is known so far.
Second, empirical evidence on this relationship is limited. It is either U.S. centered, comparative in nature, and/or characterized by certain shortcomings. Although unemployment regularly appears as a control variable in multivariate models (Armingeon and Ceka 2014; Armingeon and Guthmann 2014; Foster and Frieden 2017; Mishler and Rose 2001), few studies focus on it as a principal cause, and if so, they operate on the group level, comparing either countries or cohorts (Arias et al. 2013; Roth, Nowak-Lehmann, and Otter 2011). Here, I focus on the impact of direct, individual-level experiences of unemployment. 1 My study provides a stronger set of evidence in that it expands macro-level evidence with evidence on the individual level and focuses on causal identification. In doing so, I rely on panel data, which allows me to investigate the impact of individual-level changes in employment status on individual-level changes in political evaluations. I study this relationship on the basis of data from two different European countries, Switzerland and the Netherlands. This choice is linked both to data availability—I can rely on high-quality panel surveys that contain the necessary measures—and to the fact that I expect fewer crisis-induced distortions in those countries.
Third, I also examine the effect of unemployment on a control outcome: life satisfaction. This additional analysis allows me to ensure that the findings are not merely a result of design choices. By showing that the design identifies short-term effects of unemployment on life satisfaction, I alleviate concerns that it may be too conservative to study effects on trust in government or satisfaction with democracy. I proceed as follows: section 2 outlines arguments and empirical evidence that link unemployment and political evaluations. Section 3 presents the design, data, and measures. Section 4 summarizes the results. Section 5 provides a summary, discusses limitations, and provides rationales for future research.
Theory, Hypotheses, and Empirical Evidence
In this study, I link short-term unemployment to political evaluations. 2 Various studies have pointed to direct and indirect mechanisms that connect unemployment to political evaluations (Ahn, García, and Jimeno 2004; Chabanet 2007; Hudson 2006; Newton and Zmerli 2011). First, it may be argue that there is a direct causal path. Let us assume that A loses her job. Given that A blames the government or the political system in general, one would assume that A’s support for these same institutions decreases (Hudson 2006:59; Mishler and Rose 2005). Following this idea, it is argued that job “displacement may erode institutional-based trust in employers and the economic sphere in general” (Laurence 2015:47). 3 Although one would expect stronger effects for evaluations of government, people may very well translate their frustration into dissatisfaction with a political system in general.
Second, there may be various indirect causal paths: becoming unemployed leads to other events that in turn may affect someone’s political evaluations. To start, unemployed individuals encounter and experience various institutions that assess their right to benefits and assist them in finding a new job. Those institutions often demand a lot of engagement on the part of the unemployed. Negative experiences with such lower level institutions (e.g., an employment office) may spill over into one’s overall evaluation of political institutions. Unemployment is also linked to various other negative outcomes: it is presumed to lead to a loss of identity and self-esteem, to a feeling of marginalization, or to decreased life satisfaction, optimism, personal efficacy, and political participation and to increased stress, anxiety about the future, and depression (Ahn et al. 2004; Archer and Rhodes 1993; Chabanet 2007; Goldsmith, Veum, and Darity 1996; Laurence 2015; Leana and Feldman 1992; Linn et al. 1985; Rantakeisu, Starrin, and Hagquist 1997; Scott and Acock 1979; Waters 2007; Winkelmann and Winkelmann 1998; Zawadzki and Lazarsfeld 1935:235). These outcomes in turn may affect political evaluations such as trust in government and satisfaction with democracy. For instance, as depression changes the outlook on life more generally, it should also affect the evaluation of political objects negatively. Overall, these various mechanisms lead to a first hypothesis: Unemployment has a negative effect on trust in government and satisfaction with democracy (H1).
At the same time, the above arguments hinge on certain assumptions, the rejection of which leads to an alternative hypothesis. In what concerns the direct effect described, it really hinges on the assumption that someone who becomes unemployed blames the political system or specific institutions for his misfortune. In other words, if someone does not draw the connection between his or her personal situation and the government or political system, this explanation loses validity. It is also possible that the blame is directed at other actors (e.g., economic actors).
Second, states make various efforts to cope with the problem of unemployment and implement policies as well as special programs to simplify the reinsertion in the labor market. Fighting unemployment is one of governments’ most important tasks (Cezanne 2005:275). Someone who loses his or her job is not left alone but rather helped by the state in many ways, especially in developed countries. If unemployed persons feel that the political institutions are on their side and help them, their political evaluations should either not change at all or possibly in a positive direction (Roth 2009). These arguments lead to an alternative hypothesis: Unemployment has no effect on trust in government and satisfaction with democracy (H0).
Although the causal pathways described above are hardly testable without the necessary fine-grained data, they provide feasible stories for both H1 and H0. Similarly, empirical evidence is inconsistent and supports both hypotheses. An initial study analyzed the General Social Survey 1972–1979 with pooled cross-sectional models, introduced unemployment as one of many variables in a structural equation model, and yielded the following conclusion: “As aggregate unemployment and inflation fall, and economic expectations rise, confidence in federal institutions also rise” (Brehm and Rahn 1997:1016). Another study investigated data from the Eurobarometer and the Latinobarometer, used cohorts as the unit of analysis, and concluded that the relationship between employment and trust depended on context: increases in cyclical unemployment preceded decreases in trust among Europeans, but the opposite seemed true among Latin Americans (Arias et al. 2013). A third study investigated how the financial crisis of 2009 and its consequences affected political trust. Analyzing data from the Eurobarometer, the authors investigated 27 European Union countries and found that declines in trust in government are related to an increase in unemployment especially in the EU-15 countries (Roth et al. 2011). A study of the origins of political trust in postcommunist societies relied on data from the New Democracies Barometer V and the New Russia Barometer VII. The authors concluded that the “recent experience of unemployment also significantly reduces political trust, but its effect are weak and add little to the overall explanation of trust” (Mishler and Rose 2001:52). Finally, a study relying on the Eurobarometer examined the decline of political satisfaction and trust toward parliament in 26 European countries. Unemployment was added as a control variable and had a negative effect on both satisfaction and political trust (Armingeon and Guthmann 2014:434).
Data, Measures, and Design
I investigate three outcomes: trust in government, satisfaction with democracy, and life satisfaction. Although we lack strong evidence that causally links unemployment and the former two outcomes, there is convincing evidence that unemployment affects life satisfaction negatively ( cf.Winkelmann and Winkelmann 1998). Therefore, I use the latter as a “control outcome” to validate the design.
The data come from two panel surveys collected in Switzerland and the Netherlands. I restrict the sample to individuals of working age between 18 and 65 years who can potentially experience a period of unemployment. Both countries show comparably low levels of unemployment within Europe. In the first quartile of 2017, the unemployment rate (national definition) in both countries was 5.3 percent (Organisation for Economic Co-operation and Development 2017b), and the more comparable harmonized unemployment rate was 4.9 percent in Switzerland and 6.7 percent in the Netherlands (Organisation for Economic Co-operation and Development 2017a). Moreover, both countries were among those that weathered the economic crisis relatively well. Although unemployment skyrocketed in countries such as Greece and Spain, the increases in Switzerland and the Netherlands were much lower in comparison (Organisation for Economic Co-operation and Development 2017a). Both countries’ electoral systems can be classified as proportional; however, there are various institutional differences. Such institutional differences may, in principle, be responsible for any differences found between the two countries. For instance, Switzerland is characterized by extensive direct democratic institutions and rights compared with the Netherlands, where the barriers to such forms of participation are higher. In other words, if significantly different results were observed across those two data sets, institutional factors may lay at the origin of those differences.
First, I use data from the Swiss Household Panel (SHP), which follows a random sample of households in Switzerland over time by means of computer-assisted telephone interviewing. The SHP started in 1999 with 5,074 households and 12,931 household members. In 2004, a second sample of 2,538 households and 6,569 household members was added. Second, I rely on the Longitudinal Internet Studies for the Social Sciences (LISS), the only other panel study to my knowledge that contains the measures required for this research. The LISS is based on a random sample of Dutch households drawn from the population register. It consists of 5,000 households comprising 8,000 household members. Monthly data have been collected by online questionnaires of about 15 to 30 minutes in length since October 2007. One member in the household provides the household data and updates this information at regular intervals. As described above, both Switzerland and the Netherlands are characterized by rather low rates of unemployment. Table 1 gives an overview of the distribution of unemployment in our samples across time.
Unemployment across Years.

Note: LISS = Longitudinal Internet Studies for the Social Sciences; SHP = Swiss Household Panel.
The measures for both outcomes and treatment are similar across the SHP and the LISS. Table 2 gives an overview of the panel waves that contain our measures.
Measures across Panel Waves in the SHP and the LISS.
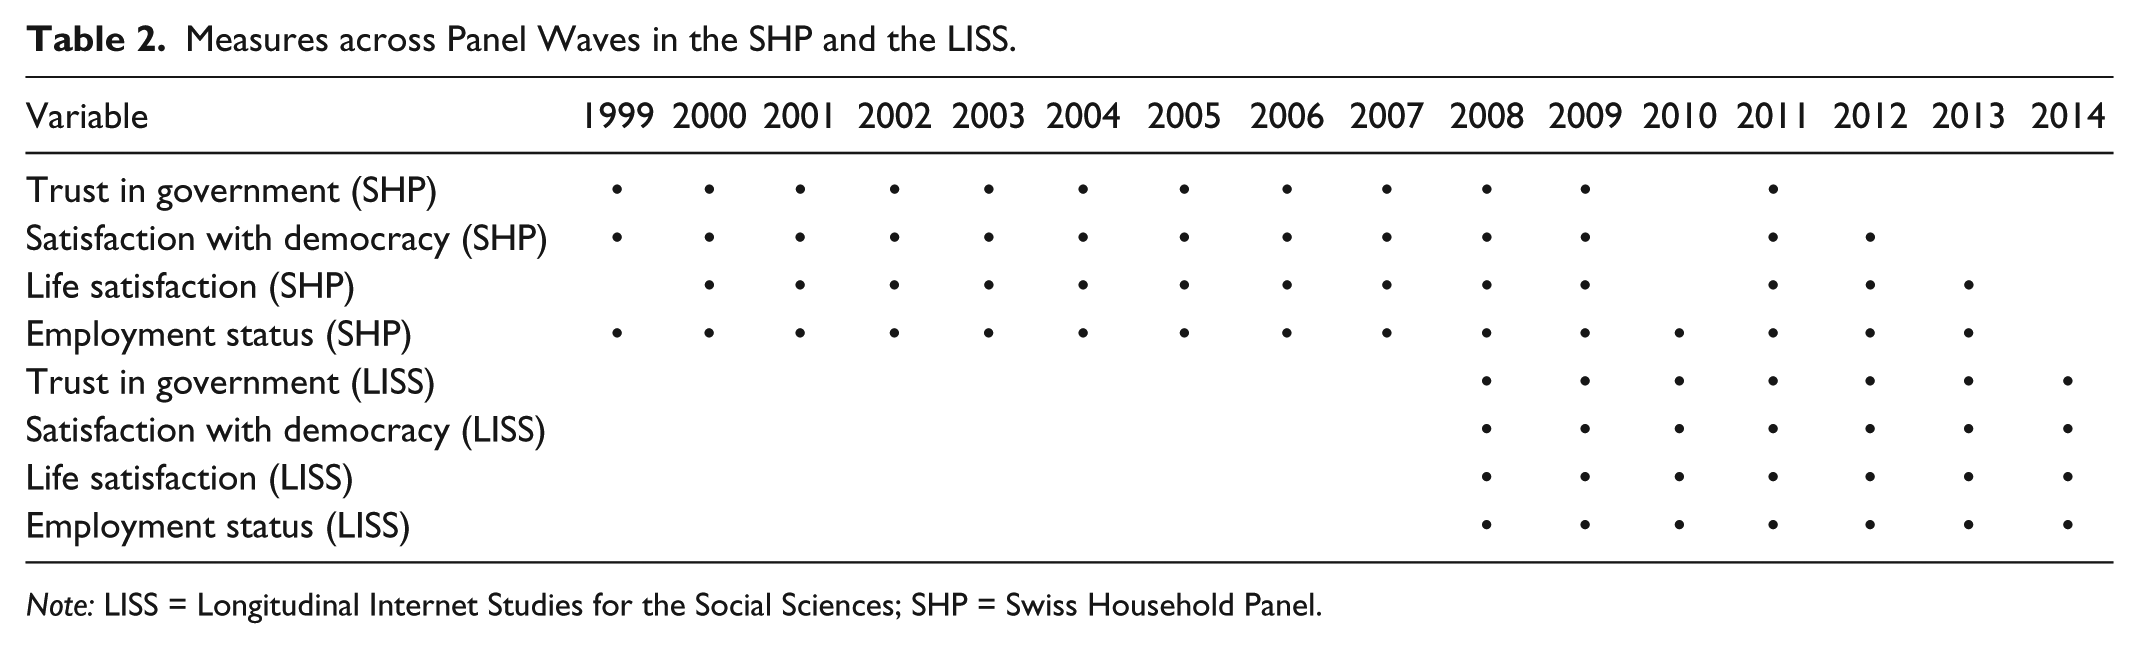
Note: LISS = Longitudinal Internet Studies for the Social Sciences; SHP = Swiss Household Panel.
In the SHP, outcomes are measured as follows: Beginning with the first wave in 1999 (with the exception of 2010), respondents were asked both a trust question and a satisfaction-with-democracy question: “How much confidence do you have in [the federal government (in Bern)], if 0 means ‘no confidence’ and 10 means ‘full confidence’?” and “Overall, how satisfied are you with the way in which democracy works in our country, if 0 means ‘not at all satisfied’ and 10 ‘completely satisfied’?” In addition, life satisfaction was queried starting in 2000: “In general, how satisfied are you with your life if 0 means ‘not at all satisfied’ and 10 means ‘completely satisfied’?” The treatment variable, unemployed, takes the value 1 if a respondent’s working status is actively occupied and 0 if a respondent’s working status is unemployed. Respondents who are not in the labor force are coded as missing. Most of the models I estimate focus on change in employment status (i.e., the treatment group consists of respondents who have become unemployed, whereas the control group is made up of people who have remained employed). 4
In the LISS, outcomes are measured as follows: Beginning with the first wave in October 2007, respondents were asked to respond to questions about trust in government, satisfaction with democracy, and life satisfaction. Trust in government is measured using the question “Can you indicate, on a scale from 0 to 10, how much confidence you personally have in each of the following institutions [Dutch government]? 0 means that you have no confidence in an institution and 10 means that you have full confidence.” Satisfaction with democracy is measured with the question “How satisfied are you with the way in which the following institutions operate in the Netherlands? 0 means that you are very dissatisfied with how the institution operates and 10 means that you are very satisfied,” and respondents evaluate the institution “democracy.” Life satisfaction is measured with the question “How satisfied are you with the life you lead at the moment? 0 means not at all satisfied with the life you lead at the moment and 10 means you are completely satisfied.” Apart from that, respondents are queried about their employment situation. The treatment variable, unemployed, takes the value 1 if a respondent indicates “I perform paid work (even if is it just for one or several hours per week or for a brief period)” and 0 if a respondent indicates “I am looking for work following the loss of my previous job.” Although the LISS measures are not exactly the same as in the SHP, they represent satisfactory proxies. Tables A1 and A2 in the Appendix presents summary statistics for all variables used in the analysis.
In terms of design, a major concern in investigating the link between unemployment and the outcomes measured in this study is time-invariant and time-variant confounders that may affect both phenomena. Observing units at multiple points in time allows me to link the variance of within-unit changes in unemployment to the variance of within-unit changes in the outcomes of interest.
I rely on models classically used to analyze panel data (Croissant, Millo, and Others 2008) but proceed with newer estimation techniques (Imai and Kim 2016). 5 First, I estimate linear models that pool the data across all units i and time periods t (Croissant et al. 2008:2). The estimated treatment effects represent the difference between observations of individuals who became unemployed and observations of individuals who did not. Thus, treatment and control group may comprise observations of the same individual at different points in time. I estimate those models with and without controls (see Table 3). The results from this first step serve as a point of reference.
SHP Switzerland and LISS Netherlands: Pooled Models.

Note: Heteroscedastic/autocorrelation robust standard errors are in parentheses. LISS = Longitudinal Internet Studies for the Social Sciences; M = model; SHP = Swiss Household Panel.
p < .001.
Second, I continue with fixed-effects (FE) models. Through demeaning the data, time-invariant individual components are removed (Croissant et al. 2008:3; Wooldridge 2010:300ff). Again, I estimate models with and without controls for all three outcomes (see Table 4).
SHP Switzerland and LISS Netherlands: Fixed-effects Models.

Note: Heteroscedastic/autocorrelation robust standard errors are in parentheses. LISS = Longitudinal Internet Studies for the Social Sciences; M = model; SHP = Swiss Household Panel.
p < .05. **p < .01. ***p < .001.
Third, I contrast the results from the classic FE estimation strategy with newer methods developed by Imai and Kim (2016), namely, weighted linear FE (WFE) regression models. I refer the reader to Imai and Kim (2016) for an elaborate discussion of the assumptions that are necessary to interpret estimates from FE models as causal effects. Kim et al. (2017) provide the software to estimate WFE models for causal inference relying on different weighting schemes (see Table 5). In what concerns causality, the main concern is selection on time-invariant covariates (i.e., stable variables that may affect both an individual’s propensity to become unemployed and his or her political evaluations). However, time-invariant confounders cancel out of the equation in the FE and WFE models. Then there may be attributes or variables that are time-variant and affect both unemployment and trust in government and satisfaction with democracy. However, such events or changes represent a problem (i.e., introduce bias) only if they are linked to both treatment and outcome and occur among a large enough number of units in our sample. Although it is difficult to come up with realistic examples of that kind, I do account for a set of variables that tend to be linked to the risk for unemployment and to trust in government and satisfaction with democracy, namely, age, education, and organizational membership (Blackaby et al. 1999; Blundell, Ham, and Meghir 1987; Collier 2005:144; Granovetter 1973:1360; Mishler and Rose 2001:49; Newton and Zmerli 2011; Putnam 2000). Although the phenomena I control for are largely stable, they still do change at particular times of an individual’s life. And changes in education, or particular jumps on the age scale, could be related to treatment and outcomes. Moreover, they may also function as proxies for other nonstable phenomena, that is, events that affect both unemployment and political evaluations may be more likely among those with low education. Tables A1 and A2 in the Appendix present summary statistics for all variables used in the analysis. 6 Apart from the effect on political evaluations, I investigate the effect of unemployment on life satisfaction. This is to safeguard that the findings are not merely a result of design choices.
SHP Switzerland and LISS Netherlands: Weighted Fixed-Effects Models.

Note: Heteroscedastic/autocorrelation robust standard errors are in parentheses. LISS = Longitudinal Internet Studies for the Social Sciences; M = model; SHP = Swiss Household Panel.
p < .05. **p < .01. ***p < .001.
Finally, a comment on reverse causality. I rely on data that measure both outcome and treatment at the beginning and end of yearly periods. I relate within-year changes in the treatment to within-year changes in the outcome. In principle, it is not known when those changes occur within these time periods. In other words, it is not known when exactly people changed their employment status or their political evaluations (and what precedes what). This is a general limitation of panel data. However, in my view it is unlikely that changes in trust in government and satisfaction with democracy cause people to become unemployed. In other words, arguments that describe a causal path from trust in government and satisfaction with democracy to unemployment seem implausible, meaning that such causal paths do not realistically apply to a significant number of people in our sample.
Empirical Results
Table 3 displays the results for the pooled data for both the SHP and the LISS, pooling all units (individuals) across time. The large values of n in the respective models reflects the number of unit × time observations. The coefficients for unemployed describe the differences in the outcome averages between those who are employed and those who are not. The respective models (models 1–12) consistently show that unemployment negatively affects trust in government, satisfaction with democracy, and life satisfaction. All coefficients are statistically significant both with and without controls. Moreover, although I would argue that all coefficients are also substantively significant (outcomes are measured on 11-point scales) (i.e., in terms of size), unemployment has a much larger effect on life satisfaction than on political evaluations, as can be seen from models 5, 6, 11, and 12 in Table 3. Table 3 also reveals that the effects are relatively consistent across the two panel data sets. All are negative, and the differences across the two data sets are altogether not that strong. However, one would expect that the results in Table 3 are biased, as there are various unobserved time-invariant and time-variant confounders affecting both unemployment and our outcomes of interest.
Therefore, in a second step, I rely on FE models, as displayed in Table 4. I find that the differences to the pooled models are considerable. The effect on life satisfaction is consistently statistically significant and substantially significant (models 17, 18, 23, and 24). In contrast, the effect on satisfaction with democracy is not statistically significant and is substantially small (models 15, 16, 21, and 22). The effects on trust in government are substantially small and not statistically significant in the SHP (models 13 and 14). In the LISS data set, the effect is stronger in the model that excludes controls (model 19); however, it weakens as controls are added (model 20). Although these results are not exactly clear-cut, in my view, they are not consistent enough to infer that there is a causal effect of unemployment on satisfaction with democracy or trust in government in the present sample, especially for the latter outcome. First, the effects on outcomes are much smaller compared with the effect on life satisfaction, especially when focusing on the models that include covariates (models 14, 16, 20, and 22). Second, only a single coefficient (model 20) reaches statistical significance considering a threshold of p < .05. However, such a p value is regarded by some as providing only suggestive evidence (Benjamin et al. 2017), while others suggest to abandon such arbitrary cutoff values altogether (McShane et al. 2017).
Finally, following the arguments provided by Imai and Kim (2016), I estimate a further set of WFE models. Table 5 displays the corresponding results, which mirror those obtained through FE estimation. The effect on life satisfaction remains robust, with and without controls. Moreover, the effect sizes seem substantively significant. In comparison, the effects on trust in government and satisfaction (models 26, 28, 32, and 34) are only partly statistically significant (p < .05 in models 28 and 32). Furthermore, they are generally small in size compared with the effect on life satisfaction, despite the fact that all outcomes are measured on 11-point scales. 7 Given this inconsistency, these results seem to support H0, namely, that unemployment has no effect on trust in government or satisfaction with democracy. This general pattern is visualized in Figure 1, which summarizes the results. I discuss limitations that may undermine this conclusion below.

Visualization of effects across models, outcomes and data sets.
Discussion and Conclusion
This study investigates whether unemployment affects trust in government and satisfaction with democracy. The study thereby contributes to current scholarship on the effects of unemployment (Brand 2015; Margalit 2013; Naumann et al. 2016), on causes of political trust and satisfaction with democracy (e.g., Listhaug and Jakobsen 2017), and on the more general link between experiences and trust (Bauer 2015; Listhaug and Jakobsen 2017; Dinesen and Bekkers 2015). Relying on panel data and corresponding models, I find no consistent evidence that unemployment negatively affects trust in government or satisfaction with democracy, which is in line with H0. However, I can replicate earlier findings on the negative relationship between unemployment and life satisfaction (cf. Winkelmann and Winkelmann 1998), which suggest that the apparent nonfinding is not merely a result of the methods applied. The present findings somewhat contrast macro-level evidence that links unemployment to political trust (e.g., Kroknes et al. 2015; Roth et al. 2011) but also micro-level evidence that links unemployment to support for the welfare state and unemployment benefits (Margalit 2013; Naumann et al. 2016). The former contrast can possibly be explained by both the classic pocketbook–sociotropic voter argument and by case selection. The latter difference is more intriguing. It seems to indicate that an experience of unemployment may affect concrete attitudes toward policies linked to unemployment, whereas more abstract attitudes remain largely unaffected.
This study is characterized by limitations. These may explain the aforementioned differences but also serve as starting points for future research. First, in line with other panel-data studies that focus on single countries (e.g., Margalit 2013; Naumann et al. 2016), I analyze panel data from “only” two countries, Switzerland and the Netherlands. As discussed before, the relationship between unemployment and political evaluations may hinge on the prevalence of certain norms, on the basis of which the unemployed blame the government or the political system for their fate or not. Such a mechanism seems highly unlikely in some contexts, such as the United States, but more likely in other contexts, such as Spain. Although the effects I find are relatively consistent across two countries, more panel data from a wider set of countries may allow researchers to investigate such potential for context dependence.
A second drawback concerns the particular types of unemployment experiences studied. I do not have enough information to properly unpack what experiences lurk behind the unemployment variable. The reasons why someone has become unemployed should matter. Future studies would ideally measure and differentiate among such reasons for unemployment in a more fine-grained way. For instance, someone whose unemployment was a direct consequence of the crisis may be quicker to connect his or her situation to politics. Furthermore, I focus on the effects of direct unemployment experiences. However, following the sociotropic argument, indirect experiences of unemployment, such as observing people in one’s network (Newman and Vickrey 2017) or in one’s neighborhood (Bisgaard 2015; Oesch and Lipps 2013), may equally matter. Studying and contrasting such indirect experiences with direct experiences is an important area of future research.
Third, time matters. To start, the length of treatment could matter. It seems plausible that long-term unemployment affects political evaluations to a greater extent than short-term unemployment. The present data do not contain enough observations of the long-term unemployed. Although collecting such data is challenging, I nevertheless think that studying the political attitudes of citizens who have been excluded from the labor market for long periods is relevant, especially given predictions of how automation may increase levels of unemployment (e.g., Arntz, Gregory, and Zierahn 2016). Of course, studying such long-term lags and the effects of long-term unemployment is challenging from a design perspective. The longer an individual’s period of unemployment is, the less likely one is to find a suitable control unit or observation that displays a similar life trajectory and differentiates itself only through being employed. On another note, one-year panel periods may fail to capture effects that are more short term. Thus, future studies would ideally measure our individual-level outcomes on a more frequent basis both before and after the onset of unemployment.
Finally, the present investigation is limited by its sample size. In principle, it is possible that the effect of unemployment is heterogeneous across (subgroups of) individuals (treatment effect heterogeneity). For certain individuals, the causal story provided here may seem more plausible. For instance, unemployment may have a stronger effect on groups that are already disadvantaged in the labor market, such as women or individuals with lower class background. Similarly, individuals’ ideology should determine whether they link their personal economic situation to a government or to the wider political system. Future data collections that comprise more individuals may allow an exploration of such assumed treatment heterogeneity.
Footnotes
Appendix
Longitudinal Internet Studies for the Social Sciences: Summary Statistics.

| Variable | n | Time | Mean | SD | Minimum | Maximum |
|---|---|---|---|---|---|---|
| Age 2008 | 8,259 | 2008 | 42.27 | 13.08 | 18 | 65 |
| Age 2009 | 9,043 | 2009 | 42.38 | 13.36 | 18 | 65 |
| Age 2010 | 7,547 | 2010 | 42.62 | 13.69 | 18 | 65 |
| Age 2011 | 7,740 | 2011 | 42.75 | 13.83 | 18 | 65 |
| Age 2012 | 6,788 | 2012 | 42.92 | 13.97 | 18 | 65 |
| Age 2013 | 6,893 | 2013 | 42.73 | 14.1 | 18 | 65 |
| Age 2014 | 7,708 | 2014 | 41.78 | 14.04 | 18 | 65 |
| Education 2008 | 7,990 | 2008 | 3.58 | 1.45 | 0 | 6 |
| Education 2009 | 8,743 | 2009 | 3.59 | 1.47 | 0 | 6 |
| Education 2010 | 7,297 | 2010 | 3.61 | 1.45 | 0 | 6 |
| Education 2011 | 7,525 | 2011 | 3.64 | 1.46 | 0 | 6 |
| Education 2012 | 6,623 | 2012 | 3.68 | 1.45 | 0 | 6 |
| Education 2013 | 6,730 | 2013 | 3.75 | 1.43 | 0 | 6 |
| Education 2014 | 7,548 | 2014 | 3.78 | 1.44 | 0 | 6 |
| Life satisfaction 2008 | 5,634 | 2008 | 7.55 | 1.38 | 0 | 10 |
| Life satisfaction 2009 | 4,536 | 2009 | 7.49 | 1.39 | 0 | 10 |
| Life satisfaction 2010 | 4,625 | 2010 | 7.43 | 1.36 | 0 | 10 |
| Life satisfaction 2011 | 3,969 | 2011 | 7.38 | 1.37 | 0 | 10 |
| Life satisfaction 2012 | 4,423 | 2012 | 7.39 | 1.37 | 0 | 10 |
| Life satisfaction 2013 | 3,682 | 2013 | 7.4 | 1.39 | 0 | 10 |
| Life satisfaction 2014 | 4,866 | 2014 | 7.23 | 1.47 | 0 | 10 |
| Member 2008 | 8,259 | 2008 | 0.53 | 0.5 | 0 | 1 |
| Member 2009 | 9,043 | 2009 | 0.37 | 0.48 | 0 | 1 |
| Member 2010 | 7,547 | 2010 | 0.45 | 0.5 | 0 | 1 |
| Member 2011 | 7,740 | 2011 | 0.37 | 0.48 | 0 | 1 |
| Member 2012 | 6,788 | 2012 | 0.45 | 0.5 | 0 | 1 |
| Member 2013 | 6,893 | 2013 | 0.41 | 0.49 | 0 | 1 |
| Member 2014 | 7,708 | 2014 | 0.4 | 0.49 | 0 | 1 |
| Satisfaction with democracy 2008 | 5,341 | 2008 | 6.19 | 1.71 | 0 | 10 |
| Satisfaction with democracy 2009 | 4,652 | 2009 | 6.13 | 1.73 | 0 | 10 |
| Satisfaction with democracy 2010 | 4,617 | 2010 | 6.07 | 1.77 | 0 | 10 |
| Satisfaction with democracy 2011 | 3,713 | 2011 | 6.18 | 1.84 | 0 | 10 |
| Satisfaction with democracy 2012 | 4,084 | 2012 | 5.87 | 1.92 | 0 | 10 |
| Satisfaction with democracy 2013 | 3,896 | 2013 | 5.94 | 2.07 | 0 | 10 |
| Satisfaction with democracy 2014 | 3,810 | 2014 | 5.93 | 2.06 | 0 | 10 |
| Trust in government 2008 | 5,533 | 2008 | 5.35 | 1.8 | 0 | 10 |
| Trust in government 2009 | 4,780 | 2009 | 5.79 | 1.75 | 0 | 10 |
| Trust in government 2010 | 4,740 | 2010 | 5.46 | 1.87 | 0 | 10 |
| Trust in government 2011 | 3,852 | 2011 | 5.64 | 2.04 | 0 | 10 |
| Trust in government 2012 | 4,200 | 2012 | 5.18 | 2.06 | 0 | 10 |
| Trust in government 2013 | 4,024 | 2013 | 4.89 | 2.27 | 0 | 10 |
| Trust in government 2014 | 3,887 | 2014 | 4.96 | 2.18 | 0 | 10 |
| Unemployed 2008 | 4,347 | 2008 | 0.02 | 0.13 | 0 | 1 |
| Unemployed 2009 | 3,504 | 2009 | 0.02 | 0.15 | 0 | 1 |
| Unemployed 2010 | 3,671 | 2010 | 0.03 | 0.18 | 0 | 1 |
| Unemployed 2011 | 2,959 | 2011 | 0.03 | 0.17 | 0 | 1 |
| Unemployed 2012 | 3,295 | 2012 | 0.03 | 0.18 | 0 | 1 |
| Unemployed 2013 | 3,013 | 2013 | 0.05 | 0.22 | 0 | 1 |
| Unemployed 2014 | 3,550 | 2014 | 0.05 | 0.22 | 0 | 1 |
Acknowledgements
I thank the participants of the Swiss Political Science Conference 2016, the annual conference for the European Political Science Association 2015, Hanspeter Kriesi, Stefanie Reher, Jonathan Chapman, Florian Stöckel, and anonymous reviewers for their helpful comments. I am also grateful to Giada Gianola for excellent research assistance. Reproduction files and data are available here: ![]() . This study was realized using data collected by the SHP, which is based at the Swiss Centre of Expertise in the Social Sciences FORS and financed by the Swiss National Science Foundation as well as data from the LISS panel, administered by CentERdata (Tilburg University, the Netherlands). The publication of this article was funded by the Mannheim Centre for European Social Research.
. This study was realized using data collected by the SHP, which is based at the Swiss Centre of Expertise in the Social Sciences FORS and financed by the Swiss National Science Foundation as well as data from the LISS panel, administered by CentERdata (Tilburg University, the Netherlands). The publication of this article was funded by the Mannheim Centre for European Social Research.
1
Laurence (2015) used a similar approach but focused on its impact on generalized trust. Similarly, Margalit (2013) and Naumann, Buss, and Bähr (2016) investigated the impact of unemployment on social policy preferences.
2
3
Laurence (2015:48) suggested that the a potential effect of unemployment on generalized trust is mediated by individuals’ institutional trust. See also Delhey and Newton (2003), Misztal (2001), Perrucci and Perrucci (2009) and ![]() .
.
4
Because unemployment is measured in yearly intervals, a situation in which respondents become unemployed and get another job within this period cannot be observed. Nevertheless, I assume that the number of such cases is relatively small. In addition, all those coded as unemployed also answered “yes” to the question “In the past four weeks, have you been looking for a job?” In other words, they indicated that they were actively seeking a job.
5
Analyses were conducted relying on R (R Foundation for Statistical Computing, Vienna, Austria), the plm R package (Croissant et al. 2017), and the wfe R package (Kim, Imai, and Wang 2017). Tables were generated using the Stargazer R package (![]() ).
).
6
In principle, any conclusions I derive may be threatened by nonresponse bias (i.e., the treated and nontreated in our sample may be not representative of the corresponding groups in the population), selective attrition bias (i.e., individuals who drop out at time t are systematically different in terms of treatment and outcome), and finally measurement error (e.g., individuals who become unemployed do not reveal their status to the interviewer). I must assume that these biases are either absent or at least not strong enough to distort the findings.