
Abstract
The “crisis in science” today is rooted in genuine problems of model uncertainty and lack of transparency. Researchers estimate a large number of models in the course of their research but only publish a small number of preferred results. Authors have much influence on the results of an empirical study through their choices about model specification. I advance methods to quantify the influence of the author—or at least demonstrate the scope an author has to choose a preferred result. Multimodel analysis, combined with modern computational power, allows authors to present their preferred estimate alongside a distribution of estimates from many other plausible models. I demonstrate the method using new software and applied empirical examples. When evaluating research results, accounting for model uncertainty and model robustness is at least as important as statistical significance.
The “crisis in science” reflects a growing concern that published research in many fields cannot be replicated by other researchers. The concern is grounded in real problems facing social science. But these are problems we can address with better research practices and greater transparency, particularly using multimodel analysis.
Much of the challenge facing social science today stems from a basic problem of “model uncertainty.” For any given study, there is a tremendous variety of statistical methods and techniques that could be applied. The analytical process is a kind of “garden of forking paths” (Gelman and Loken 2014). The path to a final model includes how to clean and code the raw data, how to define key variables, what controls to include, which estimator or functional form to use, and how best to calculate the standard errors. This “thicket of possible models” offers a multiplying array of chances to find statistically significant results (Leamer 1983; 1985:308). Researchers are genuinely unsure of what is the “single best” statistical test for a research question. And readers often know that some other type of analysis could be used, possibly showing (very) different results.
Indeed, scholars today are faced with an “embarrassment of riches” in computational capacity: we have a lot more computational power than what is reflected in most journal articles. The past two decades have seen the proliferation of personal computers, the development of lightning-fast processing, and easy-to-use software packed with ever more statistical routines. The amount of computations and alternative analyses a researcher can perform in the course of writing a paper has expanded dramatically. Yet the amount of journal space available for reporting these extra results has stayed more or less fixed. As a result, there is a growing divergence between the many analyses researchers privately conduct and what few results are actually reported in publication. This is a fundamental asymmetry of information between analysts and readers: analysts know much more about the sensitivity of their results than do readers (Young 2009).
Analysts have incentives to find statistically significant effects (Brodeur et al. 2016), and through a process of motivated reasoning they may be prone to see superior methodology in a model that shows significant results. By the time an article is published, how should a reader evaluate the two or three estimates selected for publication? Do these “preferred results” reflect the most robust, compelling estimates distilled down from months or years of rigorous analytical work? Or do they simply give proof of concept that, with enough motivation, almost any data set can yield a “significant” result?
We need better ways of reporting the many possible and credible research results that can be generated from a data set. Closing the credibility gap between authors and readers is a challenging problem that calls for solutions on a variety of fronts. 1 I advance one key step: a computational model robustness framework, making multimodel analysis central to how we conduct and report analyses. 2 The goals of this framework are to (1) embrace model uncertainty as an inherent part of social science, (2) facilitate more rigorous and comprehensive robustness testing, and (3) reduce the asymmetry of information between analyst and reader. To facilitate use of the framework, a coauthor and I developed a model robustness command in Stata named mrobust (to download, type “ssc describe mrobust” in Stata). The command is easy to use and can demonstrate robustness across possible combinations of controls, variable definitions, standard errors, functional forms, and estimation commands (Young and Holsteen 2017). In practice, statistically significant results can range from strongly robust to remarkably dependent on a knife-edge specification.
The Model Uncertainty: A Blind Spot in Statistical Analysis
We can never be completely sure whether an empirical result represents a real and durable social fact or simply an error in the data or analysis. On one hand, skewed findings might arise because of a cluster of idiosyncratic, unrepresentative observations in any particular sample of data. Standard errors and confidence intervals account for this uncertainty and reflect how the results could reasonably change if we took a new sample of data. But this margin of error only captures how a new data set could change the results, assuming every other detail of the analysis remains constant. Confidence intervals, standard errors, and significance tests say nothing about what might happen if we make a change to the model specification. This leaves an enormous blind spot in how we estimate and acknowledge uncertainty in statistical analysis.
Classical statistical theory closes this gap in the least helpful way: by assuming that the “true model” is known and, moreover, is the only model the author used. This made sense as a simplifying assumption in the 1920s and 1930s, when scholars were developing the modern rules of statistical inference (e.g., Fisher 1925; Grier 2005). In those days, as today, there was uncertainty about what was the best statistical model for a problem. But computational power was so limited—largely conducted by hand—that researchers rarely if ever ran more than one regression model for a study. Limited computational power was, in essence, a “veil of ignorance” (Rawls 1971). Neither analyst nor reader knew what alternative model specifications might find.
Today, the sheer quantity and range of statistical procedures available is overwhelming. The Handbook of Econometrics, for example, runs to more than 5,700 pages across 77 chapters (Heckman and Leamer 2007). In field experiments of statistical methodology, different competent researchers almost never converge on the same techniques for analyzing the same data set (Magnus and Morgan 1999; Silberzahn et al. 2015). In meta-analysis, in which findings from many different studies on a topic are pooled together, the actual range of estimates is always far greater than what the standard errors from any one study suggested (Doucouliagos and Stanley 2012). Using different statistical methods appears to generate much greater variation across studies than using different data sets (Young 2009). The confidence intervals of a study are a poor guide to what the next researcher is likely to find, because model specifications almost never hold constant across studies.
Data sets do not speak for themselves. Results do not just “emerge” from the empirical evidence. Findings are a joint product of both the data and the statistical model. In an age when there is such a diversity of possible statistical models, many of which can be computed in seconds on a laptop computer, there needs to be more focus on how modeling choices can decide the outcome of empirical research. In many cases, the range of estimates from plausible models may be so great that the conclusions depend more on the author’s preferred statistical model than on the underlying data.
Questions about how to design the analysis and specify the model are often the biggest challenges authors grapple with. Diligent researchers are kept up at night with questions like “Am I doing this right?” and “Are there other reasonable methods that would give different results?” Skeptical readers—especially journal reviewers—tend to assume there must be better methods, techniques, and control variables than what the author is using. Indeed, critics tend to assume that any perceived “flaw” in the methods is a catastrophic error that, once corrected, will lead to entirely different conclusions.
Because these concerns relate to the model specification, rather than the data, our current notions of statistical significance are not directly relevant. Both “significant” and “not significant” results could be dramatically different in a reasonable new model specification. The significance level or p value has little to do with how stable a result is across models (Young and Holsteen 2017).
The fundamental problem is model uncertainty: no one truly knows what is the one definitively best model specification for a given study. As a result, there are often many plausible models, and in turn, there may be many different results that the data could support.
The Garden of Forking Paths
Statistical models represent a complex bundle of assumptions about how best to conduct an analysis. A single model specification includes decisions about variable definitions, data cleaning, treatment of outlier observations, selection of control variables, functional forms, estimation commands, and standard error calculations. Exact statistical models involve so many unique decisions that they become a “garden of forking paths” (Gelman and Loken 2014). Different competent researchers often find their way to very different final models (Magnus and Morgan 1999). Gary King and colleagues emphasized that choosing which among many models to report in an article is “fraught with ethical and methodological dilemmas” with few easy answers (Ho et al. 2007:232).
The modeling choices—the garden of forking paths—can drive the statistical conclusions of a paper just as much as the data. There is an unsettling amount of researcher “degrees of freedom” and discretion in what is discovered and what is reported. It is hard to tell if empirical results are something any reasonable researcher using these data would find, or if the conclusions are dependent largely on the model selected by the researcher. Today, there is a fundamental lack of transparency about the consequences of model specifications.
Model Robustness
The central challenge of model uncertainty is how to decide not what is the single best model but rather what set of models are “plausible” and worth considering. When we acknowledge model uncertainty, the question is not “Which is the best model?” but rather “What set of models deserve consideration?” In multimodel analysis, the challenge is how to define the model space. The most credible research will embrace a wide range of models so that the authors, journal reviewers, and ultimate readers all largely agree that the analysis is comprehensive, and that any resulting conclusion is robust to their methodological concerns. In practice, this means that researchers need to show more than just their preferred models, and demonstrate that their own discretion is not driving the result.
Defining the Model Space: Ideal-type Approaches
There are several ideal-type illustrations of how to develop a set of plausible models (and thus define the model space). One hypothetical approach I call the “uber log file” method. A second is the “task force” approach. As a third way, I advocate a computational method that embraces the best aspects of these approaches.
The Uber Log File Approach
Imagine an “uber log file” that automatically captures the results of every unique regression a researcher ever ran in the course of studying his or her data and preparing an article. This would be a background log file that records all work ever conducted in a Stata or an R project. Once the analysis is finalized, the log program generates a graph showing every unique regression result an author ever looked at. 3 The philosophy is this: any model an analyst considered worth running is also worth reporting (even if the model could be criticized, as almost all can be). This is full disclosure of all results the author has ever seen.
The Task Force Approach
Another ideal-type way to develop the model space is convene a task force of specialists to study an important social question. The task force would reflect a range of disciplinary and political perspectives, ensuring a healthy dose of theory competition and adversarial collaboration (Doucouliagos and Stanley 2013; Mellers, Hertwig and Kahneman 2001). The final report might include 50 or so different model specifications that best reflect the methodological views among the task force. Any model specification that a task force member credibly argues for becomes part of the model space. There might be one model and estimate favored by a majority of the task force, but a graphical display shows what results can be found by serious scholars using credible alternative methods.
Both of these approaches involve a graph showing the distribution of results, rather than reporting one or two preferred estimates. The distribution of results might be narrow, so that practical uncertainty or disagreements about modeling strategies do not matter, and all the statistical models yield the same basic conclusion. On the other hand, the range of results might be large enough to encompass fundamentally different conclusions. In this case, what anyone makes of the evidence depends on what they see as the better statistical model: the data do not settle the matter, and firm conclusions rest on methodological debates (which may align closely with political positions or prior beliefs). This unsatisfying outcome, however, may point the way to new rounds of research, critical testing and clarification that could generate wider empirical consensus.
The Computational Solution
Computational model robustness aims to incorporate features of both the uber log file and the task force approaches. The aim is to reduce the discretion of authors to pick an exactly preferred model and result (the merit of the uber log file approach), while expanding the range of models and results that any one author considers (the merit of the task force approach). The method involves specifying a set of plausible model ingredients (including possible controls, variable definitions, estimation commands, and standard error calculations) and estimating all possible combinations of those model ingredients.
This often means running many thousands of small variations of model specifications and reporting all the results as a graphical distribution of estimates. For example, if there are 10 plausible control variables, then there are 210 (1,024) unique combinations of those controls that could be estimated. If there are also two different ways of defining the outcome variable (Y and Y′), as well as three different estimation commands (ordinary least squares [OLS], logit, and probit), and two different standard error calculations (OLS default and heteroskedastic-robust standard errors), then there are 12,288 possible models. 4 The analyst is still free to present his or her preferred model or estimate, but within the context of a graph showing what other results can be found with these reasonable model ingredients.
New software, developed by Young and Holsteen (2017), facilitates the easy use of this approach in Stata. Conceptually, the method involves bootstrapping the model, and the software allows researchers to simultaneously bootstrap both the data and the model. I advocate “wide” robustness testing as a default, but the software is flexible, allowing analysts to incorporate many conditions and restrictions to ensure the model space is strongly grounded in sociological and statistical theory.
Empirical testing shows three basic patterns of model robustness (Young and Holsteen 2017):
a statistical result holds no matter how the model is specified: any combination of the model ingredients yields the same basic result;
a conclusion depends only on one or two model ingredients—such as a specific control variable—which in turn suggests informative follow-up analyses to better understand why the control variable is so important; and
a conclusion depends on a “knife edge” specification, supported in only one in a hundred plausible models.
For an applied example, consider the union wage premium: do union members earn significantly higher wages than non–union members? This is a critical question for any worker facing a vote for union representation. To study this, I use the 1988 wave of the National Longitudinal Survey of Women, examining what unions did for women historically (cf. Rosenfeld 2014). Our empirical test of the union wage premium uses log wages as the outcome and union membership as the explanatory variable of interest. There are also many factors one might like to control for, such as worker’s age, education, marital status, geographic location, lifetime work experience, and length of time with current employer. Because of model uncertainty, we do not know the one “true model.” We are tempted to include all of these controls, but also might drop any of the controls if they came out insignificant or were suspected of measurement error, endogeneity, or any other source of bias (e.g., Elwert and Winship 2014). Our default model robustness analysis treats the set of controls as simply plausible and estimates all possible combinations of the controls. With this set of possible controls, what is the range of estimates one could find?
Figure 1 shows the results from 1,024 possible model specifications. With all controls included, the results show an 11.1 percent wage premium for union members, which is strongly statistically significant. Across all 1,000-plus models, the results are positive and statistically significant 100 percent of the time. As shown in Figure 1, the estimates range from roughly a 9 percent union wage premium to a 22 percent premium. Among these plausible models, critics could debate the exact magnitude of the union wage premium for women, but the basic conclusion is very robust. 5
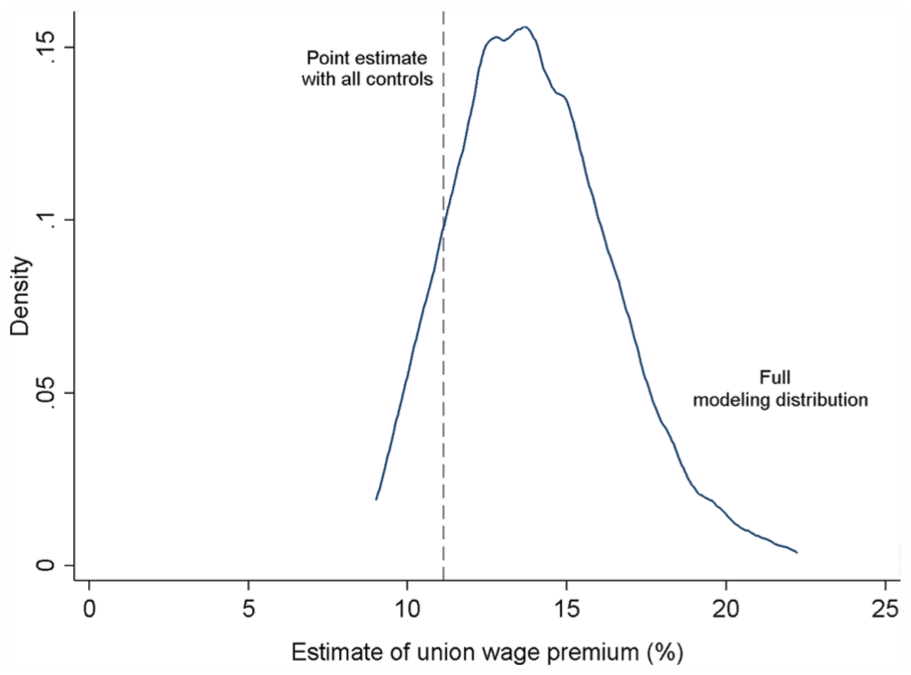
Modeling Distribution of Union Wage Premium.
This kind of outcome, in which empirical results are robust, is fairly common in my informal testing across many data sets, particularly when examining research published in top journals. Strong skeptics of social science will often be humbled when they see how many different models can support the same conclusion.
At the same time, there are clearly cases in which authors can present a handful of cherry-picked estimates that are wildly unrepresentative. As a second applied example, I look at “tax migration.” Across the United States, some states have very different income tax rates. Higher income taxes can be used to fund education, infrastructure, and social services. However, a common criticism is that high income taxes will lead people to “vote with their feet” by moving to states with lower tax rates, making progressive social policies impractical at the state level (Young et al. 2016).
The policy question is, Do people tend to move away from high-tax states and into low-tax states, such as from California to Texas? To examine this, I draw on two large data sets on cross-state migration in the United States (the American Community Survey and Internal Revenue Service tax records). The outcome variable is migration across states, and the explanatory variable of interest is the difference in income taxes between states. I draw on a rich set of plausible control variables, and consider three different plausible estimators (OLS, Poisson, and negative binomial). In short, the analysis allows uncertainty about which set of control variables is best (from a list of 12), and which estimation command is best (among three), in consideration with two possible data sets. Considering all possible combinations of model ingredients, there are 24,576 models to estimate. 6
The distribution of results across these models is shown in Figure 2. The overall conclusion is clear enough: income tax rates are statistically insignificant as a factor in migration in 98.5 percent of models. The modeling distribution is clearly centered on zero. The evidence that income taxes influence people’s decisions to move across state lines seems remarkably weak. But the results are not completely uniform.

Modeling Distribution of Tax Migration Effect.
At the extreme tails of the modeling distribution, a handful of idiosyncratic models could be reported to show either tax flight migration (significant in 0.2 percent of models) or tax attraction (significant in 1.3 percent of models). The vertical line in Figure 2 shows how one could draw a statistically significant point estimate supporting the tax flight argument. For any political viewpoint on taxes, one could construct a reasonable-looking table with several statistically significant estimates in support of that viewpoint. Even though a story could be crafted around these 1-in-100 significant estimates that turn up in the modeling distribution, they are better regarded as idiosyncratic, “false positive” results (Muñoz and Young 2017).
This drives home the point that statistical significance, in itself, is an insufficient basis for accepting a result or “believing” a conclusion. In many cases, knife-edge model specifications can be found to support a preferred conclusion, even when 98 percent of results are insignificant or opposite-signed. Indeed, Figure 2 represents the current “crisis of science”: the concern that many published findings are cherry-picked estimates rather than genuinely compelling conclusions. By reporting a broad modeling distribution of results, it is much easier to see when a preferred point estimate represents a robust result or a highly selective, knife-edge estimate. Model robustness is at least as important as statistical significance in evaluating a research result.
Several final points should be made. First, it is not necessary for an estimate to be stable and significant in 100 percent of plausible models to be regarded as robust. A simple rule of thumb for multimodel inference is that 50 percent sets a lower bound for weak robustness, and 95 percent would indicate very strong robustness (Raftery 1995). Multimodel analysis is ultimately about transparency: reducing the information asymmetry between author and reader. The goal is to relax assumptions about how the model “must” be specified and relax some of the author’s control over what estimates readers are allowed to see. Skeptical readers want to see much more than just the author’s preferred specification. Ideally, computational robustness analysis is broad enough to reflect a “task force” range of perspectives on appropriate modeling choices, or at least to reveal the range of estimates the author has actually seen in the course of conducting their research.
Second, computational robustness testing can also allow one to “unpack” a model specification and identify which model ingredients are most influential in the results (Young and Holsteen 2017). This shows which model assumptions matter most—and thus deserve more careful inspection—and which model assumptions have little or no impact on the results. For example, when deciding which control variables to include, the statistical significance of a control variable has little bearing on whether the control influences the main results. Sometimes highly significant controls make no difference for the results, while other times including nonsignificant controls can change the results dramatically. This method that helps researchers and readers understand what is important in a model specification is an illuminating additional benefit of computational multimodel analysis.
Conclusions
Multimodel analysis allows us to address some of the biggest challenges facing scientific research in the twenty-first century: model uncertainty, limited transparency about modeling choices, and the growing skepticism about published research.
The “crisis in science” reflects a fear that many published research findings either cannot be replicated or can be easily overturned (Ioannidis 2005). This is not just a declining faith in science among the public. Many social scientists themselves express deep skepticism about the reliability and replicability of others’ research, mostly when they disagree with the conclusions.
Empirical results should not depend fundamentally on which analyst conducts the research. Authors with different prior beliefs, methodological leanings, or political views should be able to draw roughly the same conclusions from a data set. This happens in part by giving genuine consideration to a wide range of different plausible models, including the preferred models of one’s critics.
Developing a specific statistical test—one concrete model specification, with one point estimate—requires taking a long methodological walk down a garden of forking paths. At each decision point, analysts make prudent, informed judgements. But even the best of us are susceptible to motivated reasoning and the lure of significant results.
We need to more openly acknowledge that for almost any decision—choice of variable definitions, control variables to include, functional forms, estimation commands, standard errors, and more—other reasonable choices could have been made, and other plausible models could have emerged. Computational multimodel analysis allows authors to backtrack along the garden of forking paths and allow reasonable alternatives for every ingredient in their preferred specification.
The focus on statistical significance in social science has left a deep blind spot in how we acknowledge uncertainty and evaluate results. We openly acknowledge that random samples of data can be misleading: they can have idiosyncratic observations that bias the results and give support to wrong conclusions. Significance tests and confidence intervals reflect this uncertainty about the data, showing how much an estimate might change if we took a new random sample. Yet these tests say nothing about how the results might change if we used a different model. By ignoring model uncertainty, we pretend that data sets simply speak for themselves. Ignoring model uncertainty makes it appear as if analysts had no analytical work to do, as if they simply discovered a data source and revealed the contents to their readers.
Model uncertainty provides an umbrella concept for understanding the crisis of science today. We know that authors, through the choices they make in how to analyze their data, can have great influence on the results of an empirical study. But we do not have routine methods for quantifying the influence of the author—or the scope the author has to choose a preferred result. Multimodel analysis, combined with modern computational power, allows researchers to show the range of estimates available from different plausible models. In an era when the authority of science is in doubt, embracing multimodel analysis and accounting for model uncertainty is central to making our research credible and compelling.
Footnotes
Acknowledgements
I thank John Muñoz for research assistance and David Grusky and Patricia Young for helpful conversations and feedback in preparing this article.