
Abstract
Researchers increasingly use correspondence audit studies to study racial/ethnic discrimination in employment, housing, and other domains. Although this method provides strong causal evidence of racial/ethnic discrimination, these claims depend on the signal being clearly conveyed through names. Few studies have pretested individual racial and ethnic perceptions of the names used to examine discrimination. The author conducts a survey experiment in which respondents are asked to identify the races or ethnicities they associate with a series of names. Respondents are provided with combinations of Hispanic and Anglo first and last names. Hispanic first names paired with Anglo last names are least likely to be recognized as Hispanic, while all versions of Hispanic first and last names are highly recognized (≥90 percent). The results suggest that researchers must use caution when trying to signal Hispanic ethnicity in experiments, and prior findings from correspondence audits may be biased from poor signals.
In recent years, researchers have increasingly used a type of field experiment known as the correspondence audit study to study racial and ethnic discrimination in employment, housing, and other domains (Bertrand and Mullainathan 2004; Butler and Broockman 2011; Correll, Benard, and Paik 2007; Gaddis 2015; Gaddis and Ghoshal 2015; Hanson and Hawley 2011). Correspondence audits allow scholars to covertly test for racial and ethnic discrimination by submitting fake applications and inquiries using names to signal race and ethnicity (Gaddis forthcoming). Additionally, researchers use names to signal race and ethnicity in a variety of noncovert lab and survey experiments as well (Chavez et al. 2010; Schram et al. 2009). Experiments using names to convey race and ethnicity have been used across a variety of disciplines—sociology, economics, political science, psychology, and management—and surpass 250 studies since 2000. 1
Prior research has examined discrimination against Hispanics across multiple domains using names to signal Hispanic ethnicity (Darolia et al. 2015, 2016; Hanson and Santas 2014; Milkman, Akinola, and Chugh 2012). However, rather than scientifically examine the perceptions of race and ethnicity from names, researchers seem to assume that Hispanic ethnicity can be easily inferred from any name selected. Worse, studies have mixed Anglo first names, Hispanic first names, Anglo last names, and Hispanic last names to signal Hispanic ethnicity. In this research, I use a survey experiment to test individual perceptions of race and ethnicity from names. I find that respondents are least likely to recognize Hispanic first names with Anglo last names as Hispanic but extremely likely to recognize most Hispanic first names with Hispanic last names as Hispanic. However, I also find considerable variation by each first name’s gender and social class characteristics. This research suggests that scholars must use caution and create their own pretests to examine the racial/ethnic perceptions from names before testing for discrimination.
Background
The Need for Audit Studies
Audit studies are an extremely important social science endeavor, as they provide causal evidence regarding racial and ethnic discrimination (Gaddis forthcoming; Pager 2007). Absent audit data, researchers would have to rely on self-reports of discrimination from the perpetrators or victims or indirectly examine discrimination through residual attribution. Perpetrators are unlikely to acknowledge discrimination. Social desirability bias may prevent individuals from disclosing discriminatory attitudes while still engaging in discriminatory actions (Pager and Quillian 2005). Additionally, although the perceived experience of discrimination by victims certainly has important consequences (Finch, Kolody, and Vega 2000; Krieger et al. 2005; Sanchez and Brock 1996), discrimination requires knowing more about the choice set and actions of a decision maker than an individual can know.
Statistical models may provide an alternative indirect method to examine discrimination. In the practice of residual attribution, researchers include a litany of control variables that affect the dependent variable of interest and on which racial/ethnic groups differ. Scholars then claim the residual coefficient for race or ethnicity represents discrimination (Lucas 2008). However, this method is unlikely to accurately attribute the correct portion of racial and ethnic inequality to discrimination, because of omitted variable bias, among other issues (Blank, Dabady, and Citro 2004; Farkas and Vicknair 1996; Quillian 2006).
Thus, researchers have turned to audits to obtain causal estimates of racial and ethnic discrimination. Audits match two or more individuals with nearly identical characteristics to test an outcome. The experimental manipulation is often race/ethnicity so that researchers may, for instance in a correspondence audit, submit two job applications to an employer, one with an Anglo name and one with a Hispanic name. Researchers can then properly attribute differences in outcomes to race/ethnicity of the applicants due to careful sampling and randomization along with matching on important criteria between applications.
Although correspondence audits may strengthen causal claims, these claims rely on researchers’ sending a clear signal of race and ethnicity through names. Recent research has noted that more than 80 percent of all audit studies conducted in the United States that use names to signal race/ethnicity fail to pretest these signals (Gaddis 2017). Moreover, when researchers use pretests to gauge racial/ethnic perceptions from names, they often use college students or small samples. The lack of scientific inquiry into individual racial/ethnic perceptions from names is particularly troubling given that for nearly two decades, correspondence audits have provided the primary evidence of racial and ethnic discrimination in the United States.
A Review of Audit Evidence Documenting Discrimination against Hispanics
Through the 1990s, only a few audit studies had ever been conducted to examine discrimination against Hispanics. As an extension of the U.S. Department of Housing and Urban Development’s (HUD) commissioned Housing Market Practices Survey, researchers examined housing discrimination against Hispanics in Dallas (Hakken 1979). The second iteration of HUD audits, the Housing Discrimination Study 1989, expanded the focus on Hispanics by including more audits over a larger geographic area. In these in-person tests, researchers found that Hispanics faced discrimination compared with whites in both sales and rental markets in terms of being told a unit was available, offered to inspect more units, and steered to more minority neighborhoods (Turner, Mikelsons, and Edwards 1990; Turner, Struyk, and Yinger 1991; Yinger 1991). Additionally, an Urban Institute study found that Hispanics faced discrimination in the labor markets in Chicago and San Diego (Cross et al. 1990). Other researchers found similar results in Denver as well (James and DelCastillo 1992). A more recent in-person audit did not find significant differences in employer callback rates for Hispanics versus whites but found that Hispanics were often recommended for lower status jobs than those they originally applied for (Pager, Western, and Bonikowski 2009).
The earliest example of a correspondence audit in the United States focusing on Hispanics was conducted in the early 1990s (Bendick et al. 1991). The authors responded to job advertisements in the Washington, D.C., area via mail and phone using names and accents (respectively) to convey Hispanic ethnicity. This study found stronger evidence of discrimination in the phone rather than mail portion of the audit.
Only recently have researchers started to examine discrimination against Hispanics using correspondence audits with any regularity (Quillian et al. 2017). Overall, this line of research finds mixed evidence of discrimination against Hispanics across multiple domains. A number of correspondence audits examining employment discrimination have found no significant difference between response rates for whites and Hispanics (Darolia et al. 2015, 2016; Decker et al. 2015; Deming et al. 2016; Kleykamp 2009). Other have found evidence of discrimination against Hispanics by landlords (Feldman and Weseley 2013; Friedman, Squires, and Galvan 2010; Hanson and Santas 2014), local election officials and legislators (Mendez and Grose 2014; White, Nathan, and Faller 2015), prospective roommates (Gaddis and Ghoshal 2017; Ghoshal and Gaddis 2015), and professors (Milkman et al. 2012).
These correspondence audits typically have used only a few different names within each study to signal Hispanic ethnicity. 2 Some studies have used four or more different Hispanic names (Deming et al. 2016; Gaddis and Ghoshal 2017; Ghoshal and Gaddis 2015; Hanson and Santas 2014; Milkman et al. 2012), and some have used Anglo first names with Hispanic last names as well as Hispanic first and last names (Gaddis and Ghoshal 2017; Ghoshal and Gaddis 2015; Hanson and Santas 2014). Moreover, unlike studies using African American and white names (e.g., Bertrand and Mullainathan 2004), there is a lack of variation across the total number of names used as well as studies repeating the same names (Gaddis 2017). Thus, the mixed findings of prior correspondence audits examining discrimination against Hispanics raise questions about whether recent discrimination varies significantly across domains (e.g., housing vs. employment), if employment discrimination has decreased significantly over time (e.g., older in-person findings vs. recent correspondence findings), or if racial/ethnic signals—names—used in correspondence audits are accurately and consistently perceived. Below, I focus on one research question: How do individual perceptions of Hispanic ethnicity from names vary by the characteristics of those names?
Data and Methods
Using Amazon Mechanical Turk
From September 2014 through August 2015, I conducted a survey experiment using Amazon Mechanical Turk (MTurk). MTurk is a crowdsourcing marketplace where individuals can assign (requesters) or perform (workers) tasks (human intelligence tasks [HITs]) for monetary compensation. MTurk is popular among social scientists, particularly for conducting survey experiments in the fields of psychology, political science, sociology, and health, among others (Campbell and Gaddis forthcoming; Dowling and Miller 2016; Horne et al. 2015). MTurk is also a relatively cheap and fast platform for collecting survey experiment data, and researchers have grown optimistic about MTurk’s generalizability (Horton, Rand, and Zeckhauser 2011; Weinberg, Freese, and McElhattan 2014).
Although scholars have raised concerns about MTurk’s generalizability and validity, recent studies address these issues in depth. Numerous studies examine MTurk’s generalizability and show that the participants are not radically different from the U.S. population (Berinsky, Huber, and Lenz 2012). MTurk samples slightly overrepresent whites and Asians, women, young people, and the more educated (Berinsky et al. 2012; Buhrmester, Kwang, and Gosling 2011; Chandler, Mueller, and Paolacci 2014; Ipeirotis 2010; Paolacci, Chandler, and Ipeirotis 2010). There is some evidence that these demographic differences account for minimal differences in effect sizes between MTurk and other Internet survey platforms that claim representative samples (Weinberg et al. 2014). Moreover, careful checks of moderating demographic variables that are not representative of the United States in MTurk samples and/or weighting may alleviate concerns regarding external validity (Mullinix et al. 2016; Weinberg et al. 2014).
Other studies suggest that MTurk is more reliable than undergraduate lab experiment samples and, at minimum, equal to other Internet samples (Behrend et al 2011; Buhrmester et al. 2011; Paolacci et al. 2010; Weinberg et al. 2014). A number of studies use “catch trials” and/or longitudinal samples to verify respondent demographics and attention to the tasks at hand (Mason and Suri 2012; Rand 2012). Additionally, limiting HITs to high reputation workers (those whose work has been approved by requesters for ≥95 percent of the HITs they have completed) helps maintain high data quality (Peer, Vosgerau, and Acquisti 2014).
Sample and Survey Setup
I created a sampling frame within MTurk by limiting workers to only those with U.S. addresses and HIT approval rates ≥95 percent. I then published a batch of 150 to 200 HITs approximately every week during the 12-month period. After each assignment closed, I flagged previous participants so they could neither repeat nor see new batches of the survey. I chose to open small batches of the survey experiment at multiple intervals rather than post a single large batch with thousands of assignments so that the experiment was always relatively fresh to anyone who had not yet completed the survey.
I chose to pay respondents $0.20 to complete the survey. The average completion time for these HITs was 2 minutes and 42 seconds, for an average hourly rate of $4.45, approximately $3.08 above the median reservation wage on the basis of prior research (Horton and Chilton 2010). Although prior research suggests that compensation rate does not affect data quality, it does affect data collection speed (Buhrmester et al. 2011; Crump, McDonnell, and Gureckis 2013; Mason and Watts 2010).
Respondents who accepted the HIT were taken to a redirect page written in JavaScript that randomized the survey condition by randomly sending the respondent to 1 of 50 different survey Web pages to complete the survey. The first treatment assignment phase directed respondents to 1 of 10 sets of first names (each set contained 20 different first names) with the goal of 10 percent to each. The second treatment assignment phase directed respondents to either first names only or one of four last name sets with the goal of 30 percent to first names only and 17.5 percent to each of the last name conditions (within each assignment from phase 1). In total, 8,424 respondents started the survey, and 7,881 completed the survey (93.5 percent).
To test individual perceptions of names, I selected a total of 200 first names; 10 different sets of 20 names, 80 of which are African American, 80 of which are Anglo, and 40 of which are Hispanic. Within each set of 20 first names, 8 are African American, 8 are Anglo, and 4 are Hispanic. For brevity, in this article I focus only on Hispanic first names with both Anglo and Hispanic last names and Anglo first names when paired with a Hispanic last name (see Gaddis 2017 for an analysis of Anglo and African American names).
Table 1 shows the list of Anglo and Hispanic first names in each set. For both Anglo and Hispanic first names, I chose names used in prior correspondence audits when possible. This will permit me, in future work, to compare how different racial/ethnic response rates by individual names in prior studies match with the perception rates of this study. I chose last names using frequently occurring surnames from the 2000 census (see Appendix Table A1), which lists the population racial composition of last names in the United States (U.S. Census Bureau 2012). 3 To capture population characteristics on the racial composition, social class status, and popularity of these names, I used data from New York State birth records for all births from 1994 to 2012 obtained from the New York State Department of Health. More details on selecting names, the New York data, and the name characteristics are available in the Appendix.
Sets of Names Used in Survey Experiment.
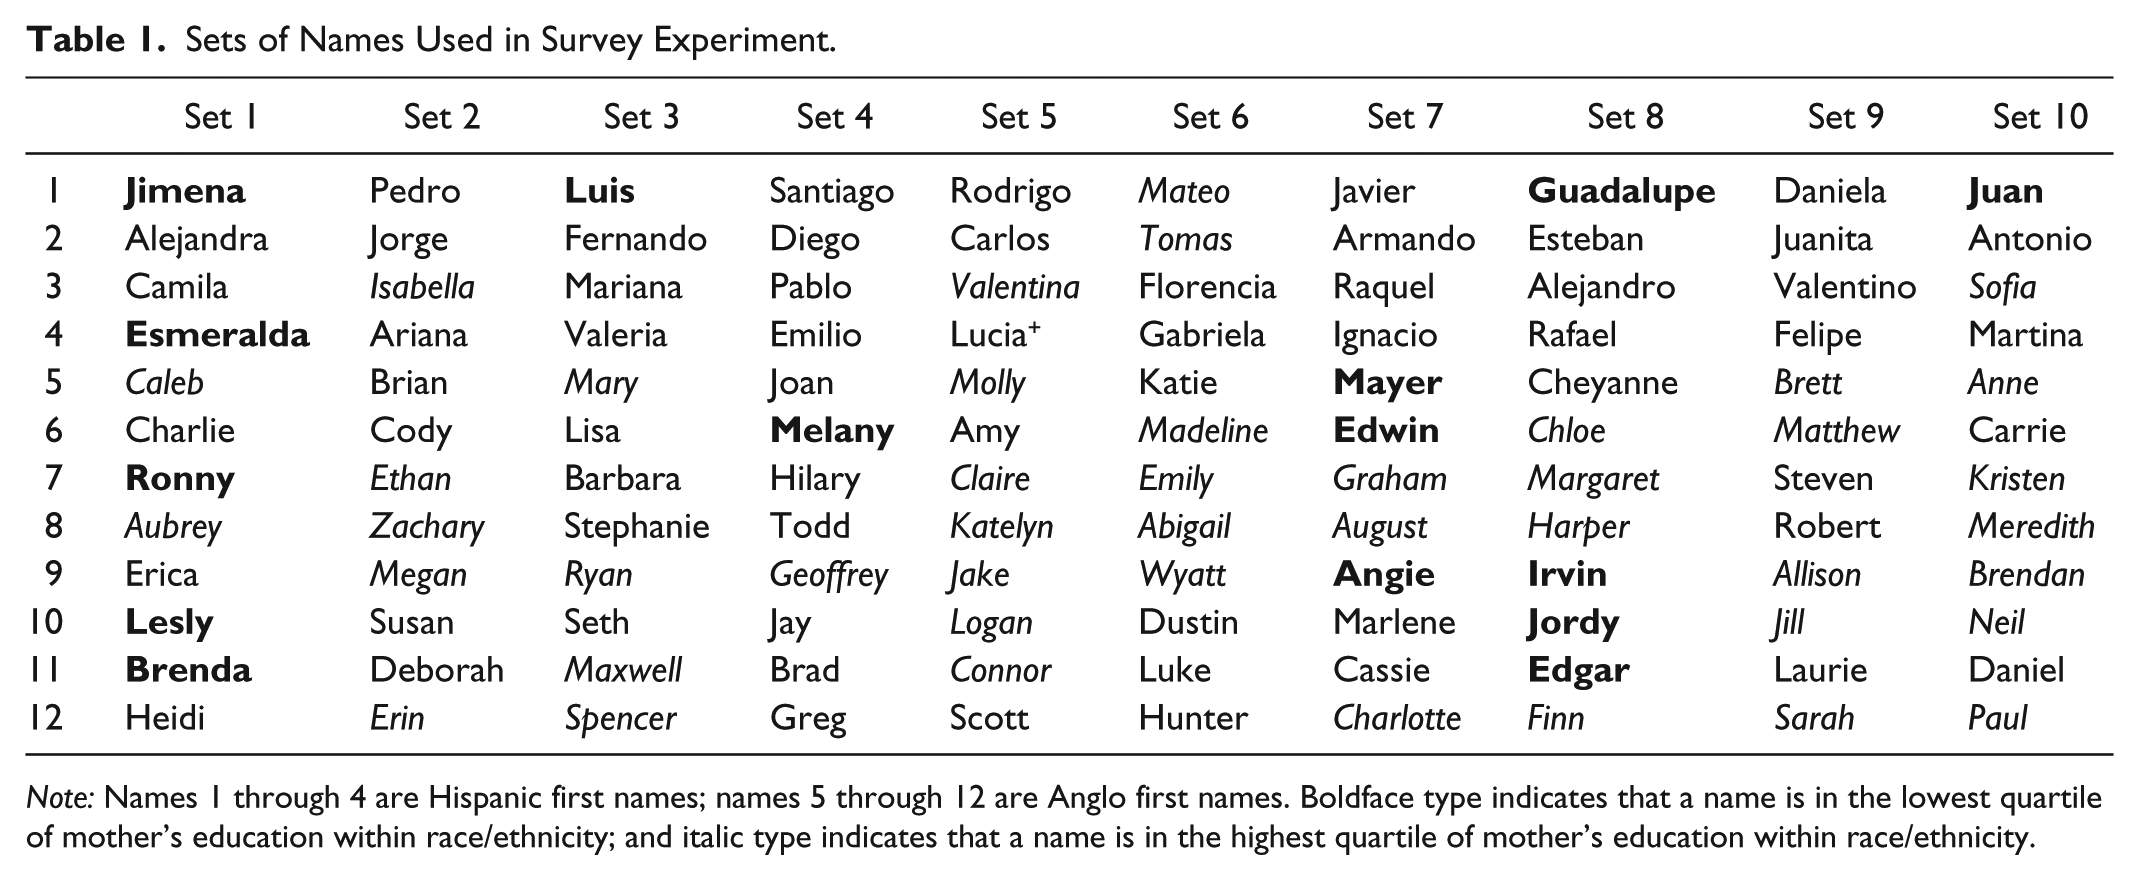
Note: Names 1 through 4 are Hispanic first names; names 5 through 12 are Anglo first names. Boldface type indicates that a name is in the lowest quartile of mother’s education within race/ethnicity; and italic type indicates that a name is in the highest quartile of mother’s education within race/ethnicity.
Survey Questions
The pertinent survey question on racial/ethnic identification asked, “For each of the following names, list the race or ethnicity that you associate with that name (for example: white, black, Hispanic, Latino, Asian, etc.). If you do not have a clear racial or ethnic association with a name, you may type ‘none’.” Open-ended responses were recoded to indicate one of six categories: Asian (0.9 percent of all responses), black (3.7 percent), Hispanic or Latino (75.7 percent), 4 white (16.2 percent), none (3.6 percent), or other (0.03 percent). 5 When multiple racial/ethnic categories were suggested by the respondent, I used the first word typed as the primary identification, but only 0.06 percent of all answers indicated some form of bi- or multiracial identification. A number of alternative coding specifications suggest minimal differences in the results that do not affect the substantive findings.
In addition to the questions on names, the first page of the survey included nine demographic and background questions about the respondent: age, race/ethnicity, sex, relationship status, any children under 18 years of age, highest level of education completed, combined household income, employment status, and ZIP code. The second page included the name questions, and the final page of the survey asked for the respondent’s MTurk ID for verification and payment.
Method of Analysis
Beyond basic bivariate descriptive results, I use logistic regression to model the effects of name characteristics and respondent characteristics in predicting odds ratios (ORs) of Hispanic identification of names:
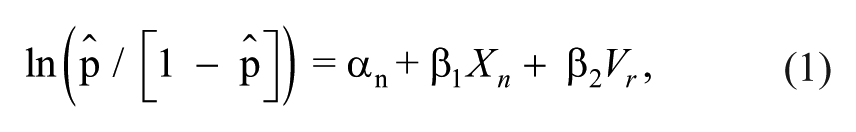
where αn is the name-level intercept; Xn represents a vector of name variables (gender, last name, mother’s education quartile, mother’s race percentage, and total frequency), and Vr represents a vector of respondent variables (age, race/ethnicity, sex, relationship status, any children under 18 years of age, highest level of education completed, combined household income, and employment status). Mother’s race percentage (white) is a continuous variable, while mother’s education is transformed into race-specific quartiles of the percentage of mothers with some college or more education. Both of these name variables as well as the total frequency variable come from the New York state birth records (see Appendix). These models include cluster-corrected standard errors at the respondent level.
Results
Descriptive Results
Table 2 shows respondents’ aggregate Hispanic identification rates across all names, by characteristics of the names, and by characteristics of the respondent. Column 1 shows Anglo first names with Hispanic last names, and column 2 shows Hispanic first names. As the first row shows, respondents overall identified the sets of Anglo and Hispanic names as Hispanic at similar rates. However, this aggregate rate hides the fact that significant differences occur for Hispanic first names by last name type. In fact, we see that Hispanic first names with no last name are identified as Hispanic (75.5 percent) about as often as Anglo first names with Hispanic last names (75.1 percent). Hispanic first names with Anglo last names are much less likely to be identified as Hispanic (54.8 percent), while Hispanic first names with Hispanic last names are much more likely to be identified as Hispanic (97.3 percent).
Descriptive Statistics: Hispanic Identification.

Note: Each respondent was asked to identify 20 different names; only results for 2 Anglo first names with Hispanic last names (column 1) and 4 Hispanic first names (column 2) per respondent are included.
Beyond the last name type, two other characteristics stand out as extremely important in influencing the likelihood that respondents identify a name as Hispanic: the gender of the name and the social class associated with that name. Although 85 percent of the time respondents identified male Hispanic first names as Hispanic, respondents identified female Hispanic first names as Hispanic only 65 percent of the time. This was likely influenced by the particular selection of names, as there were only 22 male and 18 female Hispanic first names. Additionally, for both Anglo and Hispanic first names, the likelihood that respondents identified a name as Hispanic decreases as the percentage of mothers with some college or more education who choose that names for their child increases.
Regression Analyses
Table 3 shows logistic regression analyses predicting Hispanic identification of the various names for 42,680 cases of names across 7,881 respondents. The first model controls only for name characteristics, and the second model also includes respondent characteristics. Model 1 shows that respondents are more likely to identify names as Hispanic when they are given an Anglo first name and a Hispanic last name (OR = 1.34) or a Hispanic first name and Hispanic last name (OR = 12.54) and less likely to identify names as Hispanic when they are given a Hispanic first name and an Anglo last name (OR = 0.37), all with reference to a Hispanic first name and no last name. Respondents are also more likely to identify a name as Hispanic when a name is in the lowest quartile of mother’s education (OR = 1.30) and when a name is more often given by white mothers in the New York birth record data (OR = 2.44). Finally, respondents are less likely to identify a name as Hispanic when a name is female (OR = 0.43), when a name is in the highest quartile of mother’s education (OR = 0.50), and when a name is more popular in the aggregate New York birth record data (OR = 0.96).
Logistic Regressions Predicting Identification as Hispanic.

Note: Odds ratios are shown. Regressions also control for respondent’s marital status, employment status, and whether respondent has any children under the age of 18 years. Cluster-corrected (respondent-level) standard errors.
p < .05. **p < .01. ***p < .001.
In the second model, we see that the respondent’s own characteristics matter. None of the ORs for the name characteristics change significantly, but the results suggest that female (OR = 1.07) and Hispanic (OR = 1.27) respondents as well as those aged 25 to 34 years (OR = 1.09) are more likely to identify a name as Hispanic. Additionally, higher levels of education beyond high school and income above $25,000 are all associated with identifying a name as Hispanic.
Discussion and Conclusion
Correspondence audits provide strong causal evidence of racial and ethnic discrimination. However, these claims depend on the signal of race and ethnicity being clearly conveyed through names. Few studies have pretested individual racial and ethnic perceptions of the names used to examine discrimination. Thus, the scientific evidence on racial and ethnic discrimination is potentially faulty and, at a minimum, researchers should begin to examine the validity of the signals used in correspondence audits.
In this study, I found significant variation in whether respondents identified a name as Hispanic on the basis of the type of first and last names used, the gender of the name, and the social class associated with the name. Generally, respondents identified Hispanic first names at extremely high rates when matched with a Hispanic last name. In fact, this Hispanic first and last name tandem led to Hispanic identification among more than 94 percent of the respondents for each of the 40 Hispanic first names, indicating very good choices for use in field experiments conveying Hispanic ethnicity. However, respondents identified Anglo first names with Hispanic last names as Hispanic about 75 percent of the time and Hispanic first names with Anglo last names as Hispanic about 55 percent of the time.
Two important implications are immediate from this article regarding prior research and future research. First, we must consider whether prior research examining discrimination against Hispanics has done an accurate job in properly conveying signals of ethnicity. Although Hispanic identification rates are generally high when ethnicity is signaled using both Hispanic first and last names, some names are still better than others. For example, the name in this study least likely to be identified as Hispanic (Tomas) has been used in a previous audit (Deming et al. 2016). I suggest that we need more data from audits using a variety of Hispanic names before we can examine whether these signals may bias audit results. Still, we must be cautious to interpret any research results using names to indirectly signal race and ethnicity. Names may not only signal race and ethnicity with different levels of strength, but may also convey signals about culture, generational status, assimilation, or a variety of other characteristics.
Second, this research should help scholars design experiments to better signal Hispanic ethnicity in the future. Although I tested only 40 different Hispanic names, researchers might use these names or choose to use other names but design a similar pretest using a survey experiment to examine their own names. To help with this effort, the Appendix includes the Hispanic identification rates of all 40 Hispanic first names by last name status (shown in Figure A1). For example, the three names least likely to be identified as Hispanic were Tomas, Raquel, and Ariana, while the three names most likely to be identified as Hispanic were Mariana, Alejandro, and Pedro. Additionally, researchers should avoid using signals that combine Anglo first names and Hispanic last names or, worse, Hispanic first names and Anglo last names. In particular, we need to think more carefully about whether using Anglo first names with Hispanic last names sends signals about generational status or assimilation cues and test these perceptions as well. It is my hope that the information on individual names garnered from this research will lead to more critical thinking about the ways we signal race and ethnicity as well as future correspondence audits with higher validity.
Footnotes
Appendix
Acknowledgements
Thanks to Larry D. Schoen for providing access to birth record data from New York and my excellent research assistants on this project: Anup Das, Qing Zheng, Betsy Cliff, and Neala Berkowski. Additional thanks to Shawn Bauldry, Colleen Carey, Philip Cohen, Jonathan Daw, René Flores, Devah Pager, Lincoln Quillian, Charles Seguin, and Ashton Verdery for providing helpful comments. Finally, thanks to the Robert Wood Johnson Scholars in Health Policy program and the University of Michigan for providing support while I undertook the design, data collection, and some analysis for this project.