
Abstract
Following the claim of a highly publicized National Football League (NFL) commercial, we test whether the Super Bowl provides a positive exogenous shock to fertility in counties of winning teams. Using stadium locations to identify teams’ counties, we analyze the number of births in counties of both winning and losing teams for 10 recent Super Bowls. We also test for state effects and general effects of the NFL playoffs. Overall, our results show no clear pattern of increases in the number of births in winning counties nine months after the Super Bowl. We also do not find that births are affected at the state level or that counties competing in the playoffs are affected. Altogether, these results cast doubt on the NFL’s claim that winning cities experience increases in births nine months after the Super Bowl.
Sports are a dominant part of the culture in the United States and around the world, with large-scale sporting events, such as the Super Bowl, Olympics, and World Cup, regularly attracting millions of viewers or attendees. The most recent World Cup, in 2014, even surpassed a billion viewers (Kantar Media 2015). Because fans are deeply invested in the success of their favorite teams, it is worth investigating how outcomes of these games affect population-level dynamics and behavior.
One particular area in need of further inquiry is that of sport-related fertility. A study conducted by Montesinos et al. (2013) found that births increased in Spain nine months after Barcelona won a semifinal match in the European Champions League tournament. Little other research on sport-related fertility exists, yet sporting events, competition, winning experiences, and even vicarious winning experiences have been associated with team identification (Cialdini et al. 1976), testosterone increases (Bernhardt et al. 1998), and heightened interest in sexual stimuli (Gorelik and Bjorklund 2015). For these reasons, large-scale sporting events have the potential to function as exogenous shocks to fertility.
The National Football League (NFL) is aware of this potential and claims to have confirmed birth increases following the annual Super Bowl in the United States. On February 7, 2016, the NFL aired a commercial during the Super Bowl that triggered a flurry of excitement across the Internet and social media platforms. 1 The commercial begins with the following claim: “Data suggests 9 months after a Super Bowl victory, winning cities see a rise in births” (NFL 2016b). The rest of the commercial features choirs of children—allegedly conceived on the nights of previous Super Bowls—singing a modified version of Seal’s “Kiss from a Rose” while dressed in the regalia of their hometown football teams. The clear assumption is that the euphoria following a Super Bowl victory leads to increased intercourse among local fans of that team. The NFL has since created two additional commercials based on the same phenomenon (NFL 2016a, 2017), and news outlets in Denver covered the arrival of “Super Bowl Babies” in their city last year (Brady 2016; Daru 2016).
As adorable as these commercials are, they prompt further empirical investigation into their claims and the broader idea of sport-related fertility shocks. Accordingly, our aim for this paper is to rigorously test the NFL’s central claim regarding “Super Bowl Babies” in cities of winning teams. Unfortunately, preliminary attempts to contact the NFL have been unsuccessful, and their sources of data, study design, and methodology are unclear (to our knowledge, this is not public information). Lacking those details, we propose our own analytic strategy to test whether this phenomenon is real. Overall, this paper makes two contributions to existing research. First, it is the study of a positive, recurring exogenous shock to fertility, which is uncommon in the existing literature. Second, it is one of the first studies to test whether large-scale sporting events can have demographic repercussions. Both of these contributions overlap in their relevance to diverse fields of inquiry such as sociology, psychology, demography, and even physiology.
To examine increases in births after winning the Super Bowl, we use county-level birth data across the United States for the 10 Super Bowls that correspond to the 2003–2012 seasons. We test the NFL’s claim by first analyzing Super Bowl winning and losing counties individually. We then compare Super Bowl winning and losing counties to all other metropolitan counties within their respective states. Next, we test whether births are affected at the state level for both winning and losing teams. We include counties of losing teams in our tests to ensure that any effect on winners is not simply due to playing in the Super Bowl but rather winning it. Finally, we test an effect that goes beyond the NFL’s claim but is consistent with their implied causal mechanism (celebratory intercourse): whether participating in the playoffs is associated with births nine months later. While the Super Bowl is only a brief event on a single day, the NFL playoffs that precede it are a month long, and dedicated fans across the country are teeming with excitement as they watch their favorite teams compete. Entering the playoffs, advancing to the second round, advancing to the third round, advancing to the Super Bowl, and winning the Super Bowl are all accomplishments and reasons for fans to feel euphoric and celebrate. Thus, we also test whether counties with playoff contenders have birth increases nine months later compared to counties that do not.
Background
The notion that significant events, or exogenous shocks, can influence fertility behaviors is not new. However, anecdotes and speculation abound more than empirical evidence. For example, baby booms have been given media attention after the New York City blackout in 1965 (Tolchin 1966); the terrorist attacks of September 11, 2001; the northeast blackout of 2003; hurricanes Charley, Frances, and Jeanne in 2004; the election of President Obama in 2008; Hurricane Sandy in 2012; and ice storms in Toronto in 2013, to name a few. 2 One of these events, the New York City blackout of 1965, was discredited a few years later (Udry 1970). To our knowledge, rigorous empirical studies do not yet exist for the others.
While some fertility stories are surely no more than rumors or even “urban legends” (Brunvand 1993), some studies have found fertility effects of exogenous shocks. For example, there was a decrease in fertility among southern U.S. women after the Brown v. Board of Education decision in 1954 (Rindfuss, Reed, and St. John 1978). There was an increase in births following Hurricane Hugo in 1989 (Cohan and Cole 2002). A nuanced study on hurricanes along the Atlantic and Gulf coasts in the United States found that low-severity advisories were associated with increases in births but that high-severity advisories were associated with decreases in births (Evans, Hu, and Zhao 2010). There was also an increase in births following the Oklahoma City bombing in 1995 (Rodgers, St. John, and Coleman 2005). For sporting events, Montesinos et al. (2013) found an increase in births in central Catalonia, Spain, nine months after a last-minute goal placed Barcelona into the Union of European Football Associations (UEFA) Champions League final. Very recent anecdotal reports could suggest a similar soccer-related boom in Iceland (Gibson 2017).
The Super Bowl provides an interesting case study as an exogenous shock to fertility for two main reasons. First, the viewership is substantial, with 111 million viewers in 2017 and over 40 million households tuning in nearly every year since 1993 (Nielson 2017). Despite this massive population viewership and symbolic importance of the game, very little research has investigated the relationship between large-scale sporting events and fertility. Second, the suggested causal mechanism, alluded to in the modified version of Seal’s song, is a state of euphoria that leads to intercourse. It is thus an opportunity to study a positive and recurring exogenous shock to fertility, which is uncommon in the existing literature. 3
Possible Explanations for “Super Bowl Babies”
Insight from numerous fields, including sociology, psychology, and physiology, can all guide theorizing about the creation of Super Bowl babies among elated fans. To begin, the devotion of sports fans is often extreme, and sports are followed, practiced, and revered like religion by a large number of fans and athletes alike. Not only do sports contain rituals, relics, and practices, but they also engender values, devotion, and commitment and provide a sense of purpose, meaning, and community to individuals (Price 2001a; Schultz and Sheffer 2016). One scholar even metaphorically refers to the Super Bowl as a “religious festival” (Price 2001b). Given that religion is positively associated with fertility (Hayford and Morgan 2008; Pew Research Center 2015), perhaps sports could be as well (Montesinos et al. 2013). While the connection between sports and family is surely not as clear nor well documented as that between religion and family, all three NFL commercials for Super Bowl Babies use the tagline “Football Is Family” at the end of them (NFL 2016a, 2016b, 2017). For many, this might not just be a metaphor but an invitation to expand the family of fans—or perhaps “believers.”
While sports fans sense that they are members of a larger community of players, coaches, and fans, the salience and claim of that membership may vary by the success or failure of their supported team. Research on “basking in reflected glory” (BIRG) and “cutting off reflected failure” (CORF) suggests that sports fans will enhance or protect their image by associating closely with teams after a victory but distancing themselves following a loss (Cialdini et al. 1976; Kwon, Trail, and Lee 2008; Snyder, Lassegard, and Ford 1986). Specifically, fans are more likely to wear team memorabilia and use collective pronouns such as we following a victory compared to a loss (Cialdini et al. 1976). A strong identification with the team is also predictive of BIRGing behavior (Kwon et al. 2008). There is likely no greater climax of identification with a team’s success nor greater opportunity to BIRG than when that team wins a national or world championship. Therefore, the Super Bowl provides the quintessential opportunity for fans to feel vicariously victorious, socially elevated, and personally euphoric.
Emotional and psychological effects of competition, including vicarious competition, are also tied to physiology and could potentially explain Super Bowl babies. Across a wide range of competitions, winning males experience an increase in testosterone levels while losing males experience a decrease (Archer 2006; Van Anders and Watson 2006). Fascinatingly, this effect persists even when the winning is vicarious. Bernhardt et. al (1998) found that testosterone levels increased among male fans of winning teams after watching either a soccer or basketball game and decreased for fans of the losing teams. Very similar effects have been found among male supporters of winning and losing presidential candidates (Stanton et al. 2009). Because football is a highly competitive and violent sport, played by powerful men attempting to conquer new territory and defend their own (Price 2001b), male fans may be especially prone to vicarious testosterone boosts following a Super Bowl win. Testosterone is associated with sexual activity (Archer 2006; Isidori et al. 2005; Rupp and Wallen 2007), and competitive success is also associated with sexual interest at the individual level (Gorelik and Bjorklund 2015) and even pornography-seeking behaviors at the state level following political elections (Markey and Markey 2010, 2011). Therefore, the Super Bowl provides a unique context in which vicarious competition is extremely high and could perhaps lead to physiological changes among massive amounts of fans simultaneously.
In addition to the Super Bowl, sociologists and demographers may also be interested in fertility following other sporting events across the world. These could include the Indianapolis 500, which attracts more than a quarter million live attendees (Oreovicz 2016), the Olympic Games, the National Basketball Association (NBA) finals, the Masters, Wimbledon, the World Series, the UEFA Champions League, the World Cup, and the Cricket World Cup (Lande and Lande 2008; Tharoor 2016). The last three events in this list all have more viewership than the Super Bowl (Tharoor 2016), with viewership at about 180 million for the UEFA Champions League final (Ashby 2015) and about one billion for both the recent World Cup final and the World Cup Cricket match between India and Pakistan (Kantar Media 2015; Shemit 2015). Overall, the entire World Cup tournament from 2014 is estimated to have had 3.2 billion viewers (Kantar Media 2015). If euphoria and celebratory intercourse are veritable responses to winning such monumental events, perhaps thousands of sport-related babies have heretofore gone undetected empirically.
In sum, while some exogenous shocks to fertility gain widespread media attention, many are not empirically verified, and some are even discredited. However, some exogenous shocks are empirically supported, including at least one from a large-scale sporting event. Given the pervasiveness of sports around the world and the massive populations of devoted fans that sporting events attract, we consider it worthwhile to investigate the highly publicized NFL claim from 2016 that births increase nine months after the Super Bowl in cities of winning teams. In this paper, we test this claim in numerous ways. However, we do not propose hypotheses since there is little previous research on sport-related fertility to draw from.
Methods
Data and Measures
Births
While the NFL commercial specifically claims that “cities” of winning teams see increases in births, we use county-level birth data here instead. 4 All county-level birth data are obtained from the CDC WONDER database (Centers for Disease Control and Prevention 2016a, 2016b). Births are available by month for all counties in the United States from 2003 to 2015. However, counties containing less than 100,000 people are aggregated into an “unidentified” category, and we exclude these from analyses. We also restrict our sample to metropolitan counties since they are likely similar to our focal NFL teams’ counties in terms of economy and demography (e.g., population density, urbanization, employment). We obtained data on metropolitan designations from the U.S. Census Bureau (2017b). 5 This brings our sample to 491 to 509 metropolitan counties, depending on the year, with monthly birth data for all 13 years.
Connecting counties to teams
The city listed for every stadium address is used to identify the corresponding county. Stadium names and locations are available on each NFL team’s website. Most teams (20 out of 32) play in a city that corresponds exactly to their team name, and thus the county of the stadium is the same as the county of the city. 6 Of the remaining 12 teams, there are 5 whose names apply to broader regions. 7 There are another 5 whose names actually belie their true location. 8 Finally, there are 2 teams that play in a different city than their name suggests but within the same county as that city. 9 While different arguments can be made for which counties best represent the fans of these teams, all counties are chosen based on the stadium’s location for consistency. 10 Table 1 summarizes this information.
NFL Teams, Stadium Locations, and Counties Used in Analyses.

Source. NFL.com, individual NFL team websites, and Google Maps.
Note. All counties listed correspond to stadium locations.
The New York Giants and the New York Jets share a home stadium.
The St. Louis Rams became the Los Angeles Rams in 2016, but they are referred to here by their name during the years of interest. Accordingly, their stadium and county apply to their St. Louis location.
Super Bowls and playoffs
All playoff games, including Super Bowls, and their dates are obtained from NFL.com (NFL Enterprises 2017). We limit the analyses to seasons for which we have birth data at least 18 months before and after the October following each Super Bowl. October is our primary month of interest because approximately 80 percent of conceptions on the night of our Super Bowls will come to term in this month. 11 This leaves us with the 10 NFL seasons from 2003 to 2012, presented in Table 2.
Approximate Dates of Birth for Super Bowl Babies by Length of Pregnancy.

Note. All shaded cells indicate October births. Thirty-seven to 38 weeks of gestation are considered early term, 39 to 40 are considered full term, and 41 weeks is considered late term (Martin et al. 2015). According to Centers for Disease Control estimates from 2005 to 2013 (Martin et al. 2015), between 81.44 and 83.13 percent of all births will fall within the range of gestational ages presented here. We calculate gestational age by adding two weeks to the date of conception (Engle 2004).
Additional measures
We create dummy variables to identify whether counties had a playoff team, Super Bowl losing team, or Super Bowl winning team for each season (0 = no, 1 = yes). The former of these is used in our playoff analysis only. It is important to note that while Super Bowl conceptions will come to term predominately in October, the slight majority of playoff conceptions will come to term in September. Many other playoff conceptions could end up in either month. An illustration of this is presented in Table 3. As a result, when we incorporate playoff effects into our final model, we decompose birth effects to allow for separate effects in September.
Approximate Dates of Birth for Babies Conceived during the Playoffs by Length of Pregnancy.
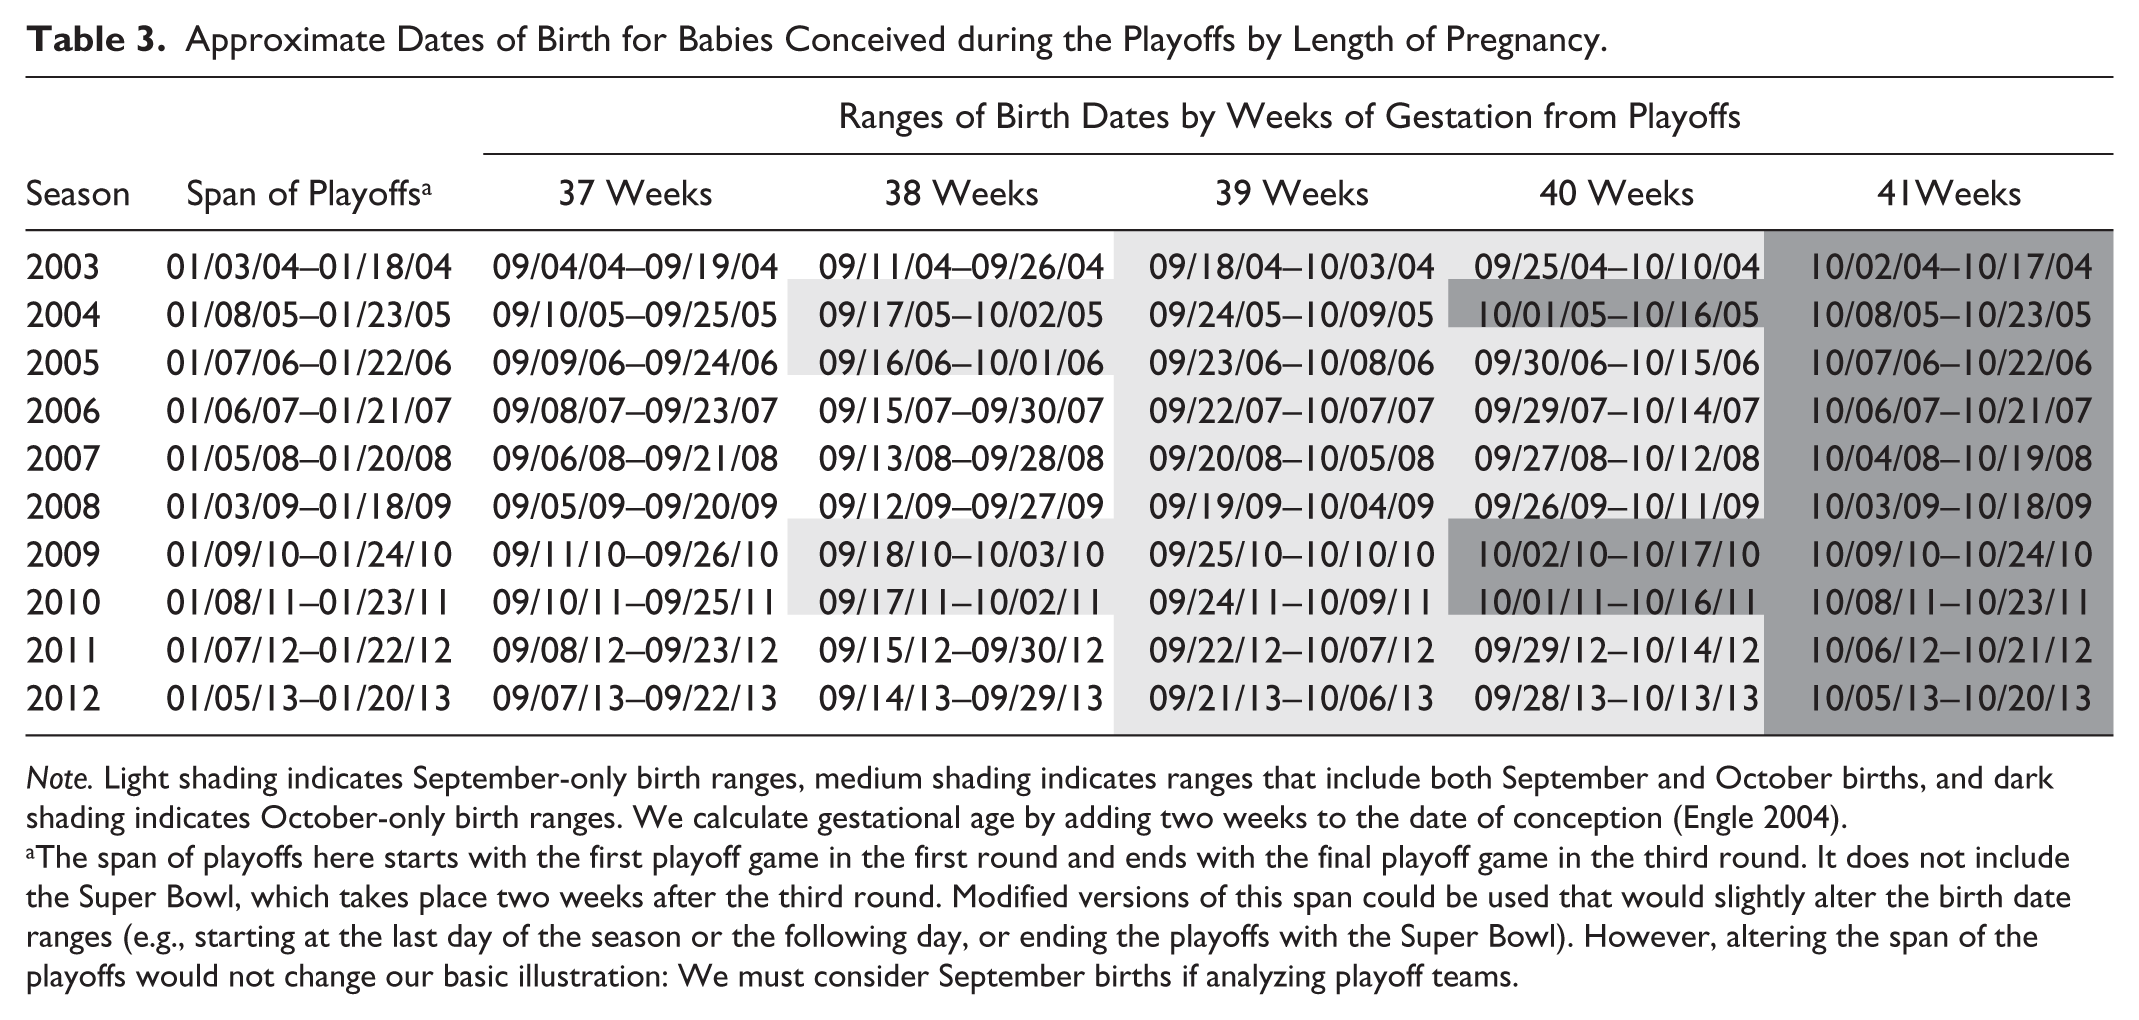
Note. Light shading indicates September-only birth ranges, medium shading indicates ranges that include both September and October births, and dark shading indicates October-only birth ranges. We calculate gestational age by adding two weeks to the date of conception (Engle 2004).
The span of playoffs here starts with the first playoff game in the first round and ends with the final playoff game in the third round. It does not include the Super Bowl, which takes place two weeks after the third round. Modified versions of this span could be used that would slightly alter the birth date ranges (e.g., starting at the last day of the season or the following day, or ending the playoffs with the Super Bowl). However, altering the span of the playoffs would not change our basic illustration: We must consider September births if analyzing playoff teams.
In sum, 31 of our counties have an NFL team (we combine the New York Giants and the New York Jets). For a given season, either 11 or 12 of the 31 counties with an NFL team will compete in the playoffs while the rest will not. 12 Two of those counties will be represented in the Super Bowl, and one of them will experience a Super Bowl victory.
Analytical Strategy
In this paper, we examine four separate birth effects: (1) the effect of winning or losing a Super Bowl for a given team’s county, (2) the effect of winning or losing a Super Bowl for a given team’s county as compared to other metropolitan counties in the same state, (3) the effect of winning or losing a Super Bowl on the state level, and (4) the effect of participating in the NFL playoffs on the national level.
To identify the effects of winning and losing the Super Bowl on county births, we compare the number of births in the October following the Super Bowl to an average monthly number of births in the respective county and then to the average number of births in that county in October. We use a time range of 37 months centered at the October following the Super Bowl to estimate the monthly births average and five consecutive Octobers (two before and two after the October following the Super Bowl) to estimate the October births average. Figure 1 provides a visualization of the time range we use. The time span of 37 months provides sufficient information about the birth trends before and after the Super Bowl but is narrow enough to allow for 10 different seasons in the sample (the CDC Wonder monthly data only span from 2003 to 2015). We tested multiple variants of the time range, and the results are statistically and substantively the same.

Timeline of each season in sample.
We then compare the counties with winning teams and losing teams with other metropolitan counties in their respective states. The expectation here is that any effects will be most visible in the counties of the winning or losing teams. We estimate a difference-in-differences (DD) regression with a linear time trend and a treatment cutoff date centered at the October following the Super Bowl. The effects are decomposed into October, November, and an average effect over the next 17 months to account for the initial bump in births and a lagged effect. We identify the winning and losing counties as the treated counties and the remaining metropolitan counties in their respective states as controls. We account for county-level fixed-effects but also tested models without the fixed-effects (available on request). We also tested models that assumed a change in the time trend after the cutoff date; the results are numerically and substantively similar.
In the next step, we suppose the whole state could be affected by the euphoria of the Super Bowl win (or the grief of the Super Bowl loss) and estimate a statewide effect. Importantly, this approach remedies one of the shortcomings of the county-level analyses: Since not all stadium counties overlap with city counties, we could have missed an effect of the win by using an incorrect county to identify the location of a team’s most ecstatic fans. By using the state analysis, we broaden the regional scope and potentially include pockets of fans that were affected by the win but lived outside of the county of interest. We again use the DD regression to compare metropolitan counties from the winning or losing state (treated counties) to metropolitan counties from states from the same census regional division (control counties). 13 We also estimated the effect using all counties in the state—the results are similar and available from the authors on request. We account for county-level fixed-effects and cluster standard errors at the state level.
Our final analysis goes beyond the claim made in the NFL commercial. We test whether there is a general effect of participating in the NFL playoffs. Our speculation here is that counties of teams in the playoffs may experience euphoria related to playoff events, specifically, entry into the playoffs and victories in subsequent games, culminating in the Super Bowl. These mini-euphoric events happen over a period of about 35 days and culminate on the Super Bowl night. In this step, we estimate the effect of the NFL playoffs in October but also separate the effect for September of the same year. As it can be observed in Table 3, some conceptions from early playoff games will come to term in September instead of October. Each year, there are 12 playoff teams, except in 2006 when there are 11 (both the New York Giants and New York Jets are combined into one). We compare the counties with competing teams to all other metropolitan counties in the United States, again including county-level fixed-effects and clustered standard errors at the state level.
Results
Table 4 shows October births and two different birth averages for the counties of each Super Bowl winner and loser in our analysis. Starting with winning counties, the number of births in October of the Super Bowl year is slightly higher than the 37-month average in five seasons and slightly lower than average in five seasons. Notably, most of these changes are small, and only one fluctuation exceeds one standard deviation from the mean (and in the negative direction). Comparing October births to the average births for five Octobers (two before and two after the Super Bowl October), one county has a change in births greater than one standard deviation from the mean, and again it is a decrease.
Number of County Births Following Super Bowl Victories and Losses Compared to Mean Numbers of County Births.

October births following the Super Bowl victory.
Mean of births for 37 months (the October following the Super Bowl and 18 months before and after).
Calculated as (x – Meanx)/SDx.
Mean of births for five Octobers (two Octobers before the Super Bowl, the October following the Super Bowl, and the next two Octobers). For 2003 only, we use one Super Bowl before our focal October and two Octobers afterward since we do not have data from 2002.
Looking at losing counties in the bottom half of the table, we see that the story is similar. Seven out of 10 have more births in October following the Super Bowl than their 37-month average. The other three have decreases. Of the increases, only one is a standard deviation above the mean. Comparing births only across the five Octobers, two counties have increases and two counties have decreases that exceed one standard deviation from the mean. Overall, then, this table shows inconsistent changes in births following the Super Bowl for both winning and losing counties.
Table 5 shows birth changes in counties of winning and losing teams compared to all other metropolitan counties in their respective states. Our focal month of interest is October, but to account for possible delayed effects of winning or losing, we also present estimates for November and the subsequent 17 months. While these tables only show the winning and losing counties for each Super Bowl, full tables that include all other metropolitan counties for winning and losing states are presented in the online supplement.
Birth Changes in Counties of Winning and Losing Teams Following the Super Bowl Compared to All Other Metropolitan Counties in Their Respective States.

Note. October is our focal month of interest, but we also show November and the following 17 months to allow for a lagged effect of winning or losing. Each row for winners and losers is a separate regression in which the county listed is compared to all other metropolitan counties in its respective state. Regressions include county-level fixed-effects.
p < .05. **p < .01. ***p < .001.
Among winning counties, only one birth change in October is statistically significant, and it is a decrease in births relative to other metropolitan counties. For November, there is again only one statistically significant change, and it is a decrease in births relative to other metropolitan counties. For the following 17 months, four winning counties experience decreases in births while two counties experience increases. Losing counties are not very different overall. Interestingly, one losing county has a statistically significant increase in births in October. Four losing counties experience decreases in November, while three experience increases and three experience decreases for the following 17 months. Generally, this table shows inconsistent changes in births for both winning and losing counties similar to those presented in Table 4.
Table 6 presents the results from the statewide analysis, aggregating the birth data from the metropolitan counties within winning and losing states and comparing them to metropolitan counties in states within the same census division. For winning states, in October, two of them experience a statistically significant decrease in births compared to other states within the same census division. For November, three experience increases while one experiences a decrease. Finally, for the 17 months following November, two states experience an increase in births while one experiences a decrease. Losing states are similar in their inconsistency of results but show slightly divergent trends. Three losing states actually experience a statistically significant increase in births compared to states within the same census division. In November, three experience birth decreases while one experiences an increase. Over the next 17 months, three have increases in births while two have decreases.
Birth Changes in States a of Winning and Losing Teams Following the Super Bowl Compared to Other States in the Same Census Division.
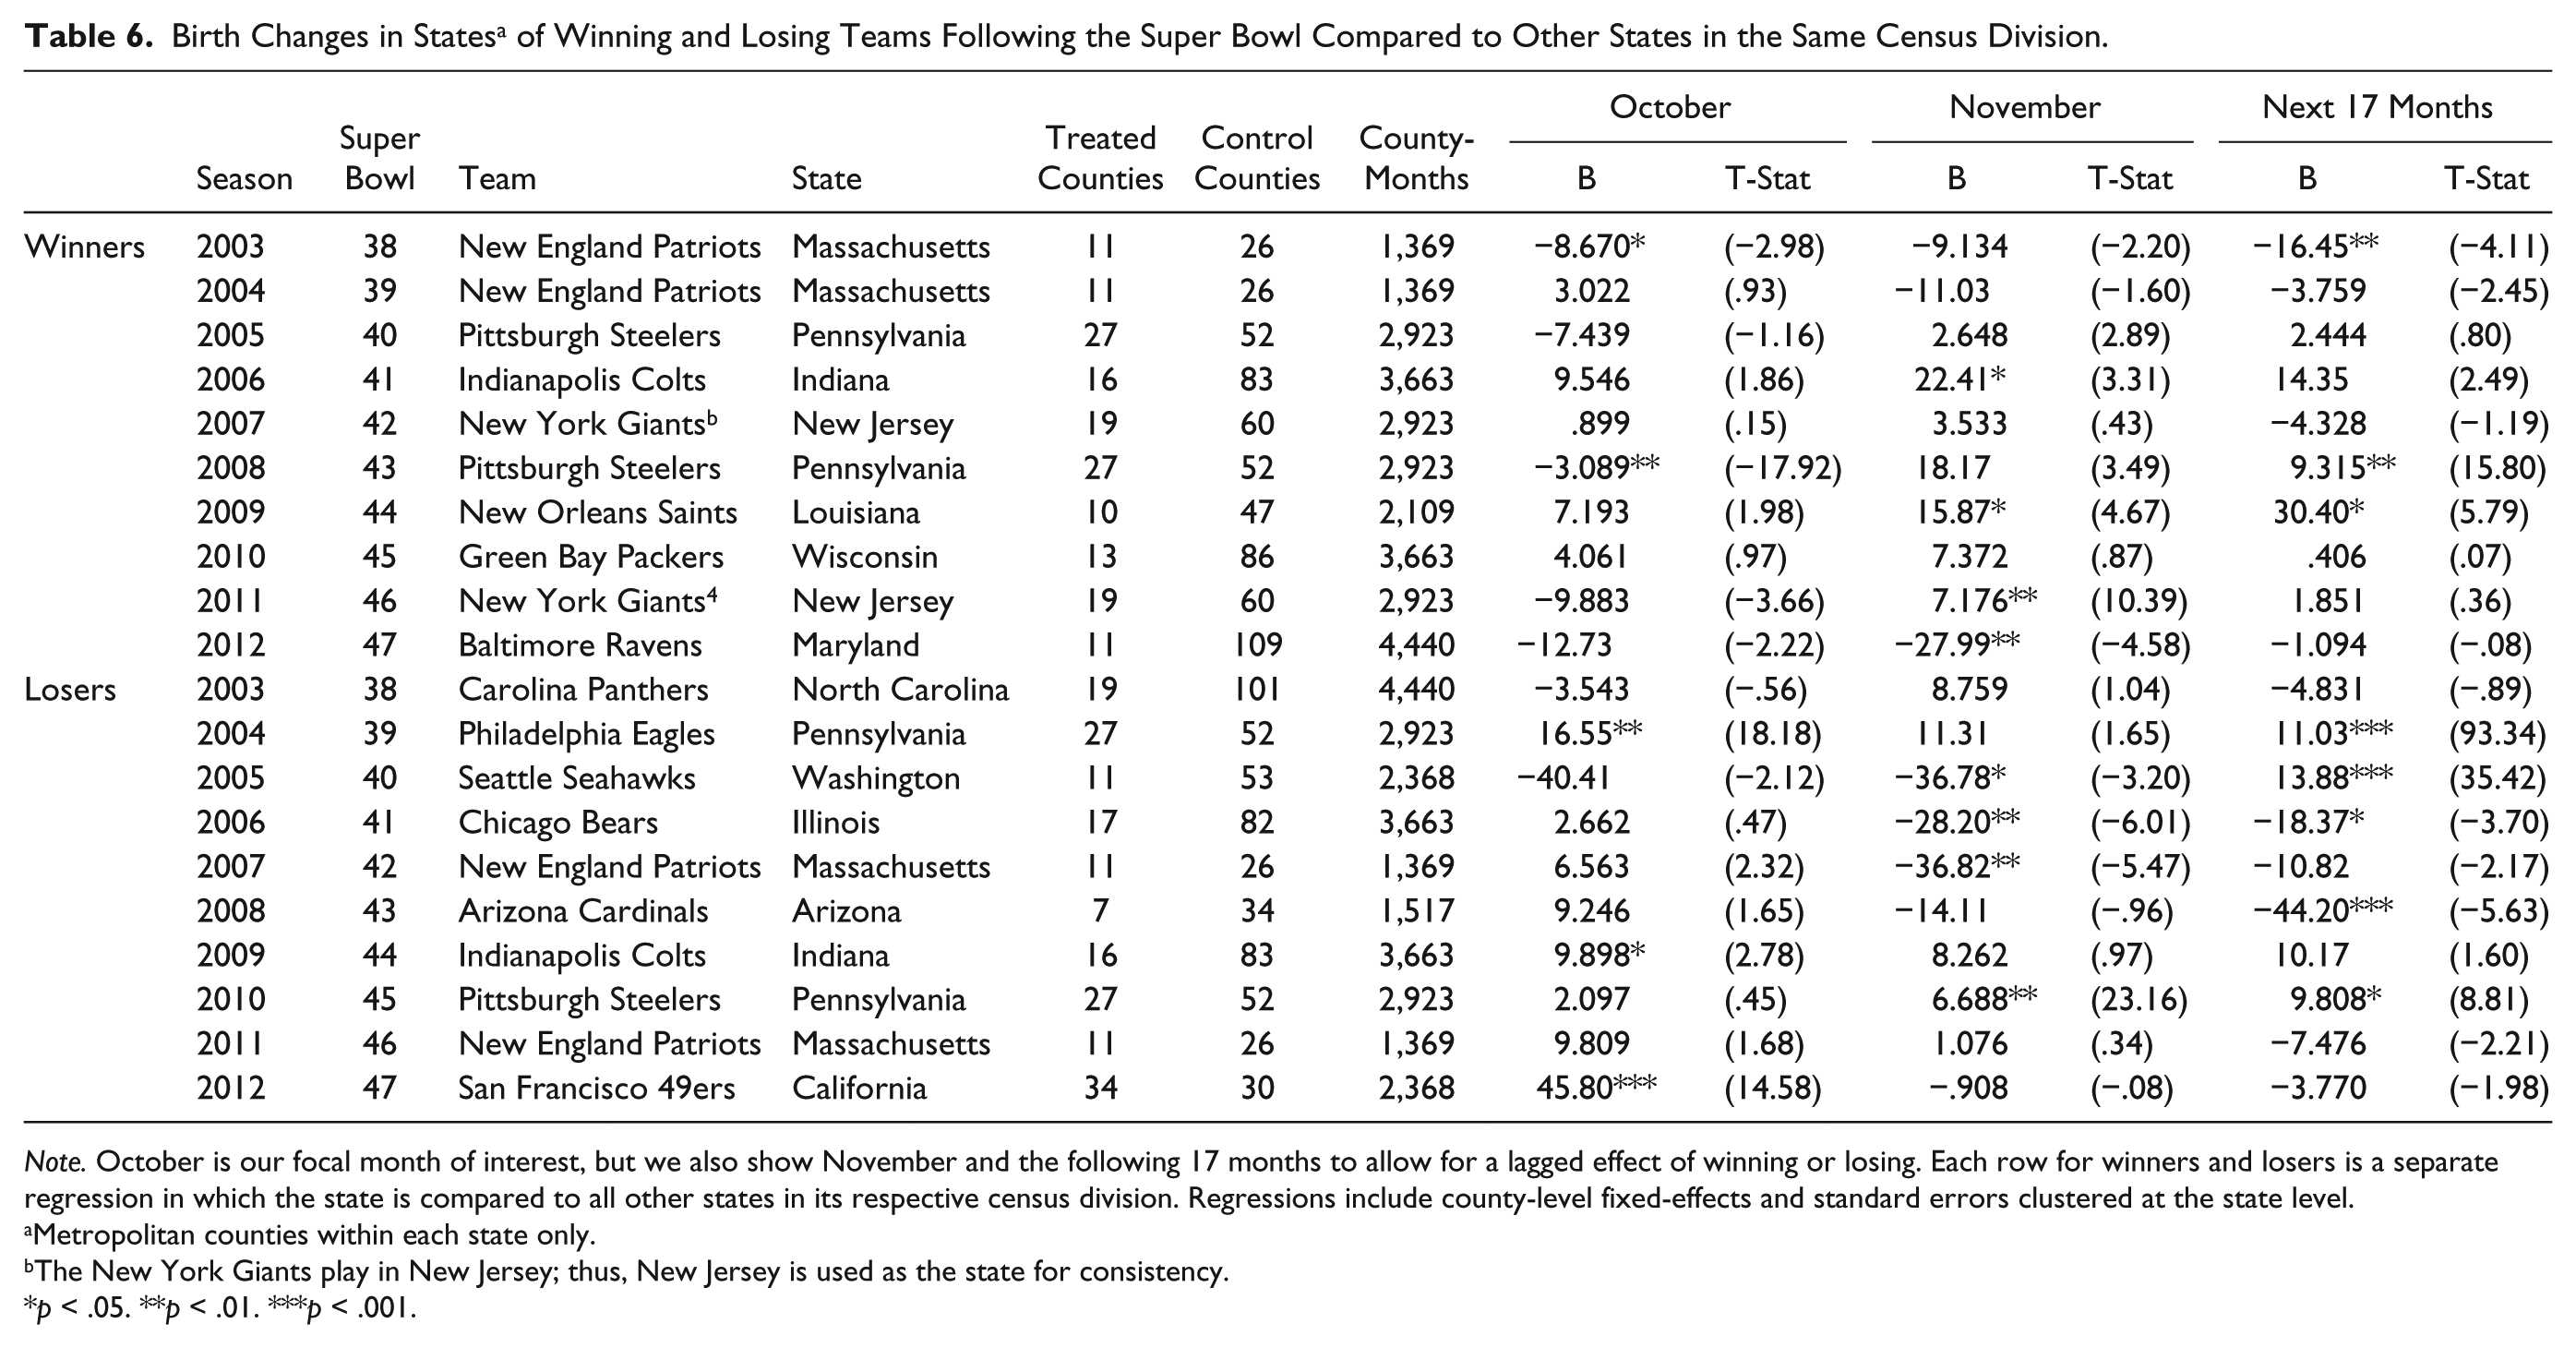
Note. October is our focal month of interest, but we also show November and the following 17 months to allow for a lagged effect of winning or losing. Each row for winners and losers is a separate regression in which the state is compared to all other states in its respective census division. Regressions include county-level fixed-effects and standard errors clustered at the state level.
Metropolitan counties within each state only.
The New York Giants play in New Jersey; thus, New Jersey is used as the state for consistency.
p < .05. **p < .01. ***p < .001.
Finally, Table 7 presents our analysis that extends beyond the NFL commercial; we test whether counties of playoff contenders experience birth increases compared to all other metropolitan counties in the country. Interestingly, statistically significant birth increases in September (compared to all other metropolitan counties) can be observed following three NFL seasons. There are no statistically significant changes for October in either the positive or negative direction. For November, playoff counties experience five statistically significant decreases in births compared to noncompeting counties. Finally, over the following 17 months, on one occasion, playoff counties experience a decrease in births compared to noncompeting counties.
Birth Changes in Counties of Playoff Contenders Compared to All Other Metropolitan Counties in the United States.

Note. In each row, all counties with playoff teams, regardless of how far they advanced, are compared to all other metropolitan counties in the country. Standard errors are clustered by state. The majority of conceptions during the playoffs would come to term during September and October. However, we also show November and the following 17 months to allow for a lagged effect of participating in the playoffs.
In 2006, there is one less playoff county because the New York Giants and New York Jets both make the playoffs, and they share the same stadium and county.
p < .05. **p < .01. ***p < .001.
Discussion
In this paper, we challenged the NFL’s assumption in a highly publicized Super Bowl commercial that winning cities experience increases in births nine months after the Super Bowl. Using stadium locations and county data as proxies for teams’ cities, we analyzed the number of births in counties of both winning and losing teams, tested for differences between similar counties within their respective states, tested for state-level effects, and also tested a general effect of the NFL playoffs. We decomposed parts of our analyses to allow for different effects in the key months of September, October, and November and to allow for lagged effects (17 months after November).
It is worth reiterating here, however, that we do not know what data the NFL used to make their claim, the particular Super Bowls they analyzed, or their methodological techniques. Lacking this information, we proposed our own analytic strategy using 10 recent Super Bowls and county-level birth data with identifiers for metropolitan designations. We approached the question from multiple angles in an attempt to be as comprehensive and thorough as possible.
One general theme of these results emerged: We find no clear pattern of birth increases in winning counties nine months after the Super Bowl. Compared to their mean number of monthly births, counties with Super Bowl winning teams experienced five small increases and five small decreases nine months after the game. If we limit our means comparisons to two Octobers before and after our main October of interest, winning counties experienced three small increases and seven small decreases. Similarly, there is no consistent effect of losing a Super Bowl. In the counties of losing teams, during 7 out of 10 seasons, we observed a small increase in mean births nine months after the Super Bowl. When we limit our comparisons to two Octobers before and after our October of interest, five losing counties experienced a small increase, and five experienced a small decrease.
Comparing birth changes in winning and losing counties to other metropolitan counties within their states produces similar results; a few increases and decreases appear for both winners and losers, but many times, there are no statistically significant differences. Of those differences that do reach statistical significance, we actually observe slightly more negative effects on births for either winning or losing the Super Bowl.
At the state level, the findings continue to be inconclusive. Interestingly, for October following the Super Bowl, winning states experienced two decreases in births compared to other states within the same census division, while losing states experienced three increases in births compared to states within the same division. Lagged birth changes, for November and the 17 months afterward, also do not have a consistent pattern. Finally, to push the NFL’s idea even further, we tested for general effects of the NFL playoffs. We did find three birth increases in September for counties with teams in the playoffs, but we found no significant birth changes in October. All six statistically significant changes from November onward were in the negative direction.
Altogether, these results cast doubt on the claim that winning cities see increases in birth nine months after the Super Bowl. While it is certainly feasible that some counties in some years have had euphoric Super Bowl celebrations and created new cohorts of children, we did not choose to pursue case studies here. The central claim we tested suggested that this phenomenon was consistent, but we do not find such consistency. For every significant birth effect in either direction, there are several more instances for which we do not find birth effects at all.
There are several possible explanations for why we do not find the birth increases that the NFL proposes in the commercial. First, we may have simply lacked statistical power, as the difference-in-differences analyses compare one treated county (or state) with multiple control counties (or states). However, the playoff analysis has a larger sample of treated counties, and the effects were still inconsistent. We also only have 10 Super Bowls with enough data beforehand and afterward to include, and we only have 13 unique Super Bowl participants in our data because 4 teams made multiple appearances. Ideally, we would like to have many more Super Bowls to increase our sample size and diversify our pool of winners and losers (which would have different fan bases and geographic locations in the country). In other words, it is possible that our limited number of Super Bowls and unique competitors could fail to represent the typical Super Bowl or typical behaviors of fans following the game.
Second, we may be limited by the richness of our data. To truly link the effect of the Super Bowl with fertility in winning cities, the analysis of the number of conceptions following the win would be more appropriate. Even if we assume that a Super Bowl victory is followed by increased intercourse, that intercourse may not lead to many conceptions given the increasing popularity of long-term, highly effective contraceptive methods in the United States (Mosher and Jones 2010). There is also a general availability of abortion services in the United States (Jones and Jerman 2014), and about 40 percent of unintended pregnancies end in abortion (Finer and Zolna 2014). Obtaining data from earlier football seasons, when contraceptive methods and abortion access were not as widely available (e.g., the 1960s or 1970s), could provide a robustness check in this regard. It would also be advantageous to have daily birth data for our analyses, perhaps from hospital records. However, analyzing hospital data within winning and losing counties presents issues of both practicality and generalizability. There are no publicly available data sets with hospital-level daily birth records, and to collect such data would be time and cost intensive. Choosing a sample of hospitals would be more feasible for our purposes but would be vulnerable to large sampling variations and could produce misleading results.
Third, Super Bowl effects might be concentrated within smaller populations of diehard fans that are not influential enough to be observed in county birth rates. Indeed, the NFL contacted season ticket holders to recruit the Super Bowl Babies for the commercial (Yuccas and Banerji 2016). Of course, it would be highly impractical to build a sufficiently detailed data set from just season ticket holders or other such deeply committed fans for analyses like those presented here. However, even if there were an effect concentrated among such a small minority of fans, it is unlikely that the NFL’s claim of citywide increases would be true anyway; it would take a large group to alter birth patterns noticeably beyond sampling fluctuations. Thus, while we recognize this shortcoming, we think our county-level analysis is a very reasonable test of the NFL’s claim.
In sum, while the Super Bowl commercial has undoubtedly sparked thousands of interesting and potentially awkward conversations among fans and viewers alike, we do not find evidence for increases in births associated with Super Bowl wins, losses, or even participation in the NFL playoffs. Meanwhile, the commercial lives on and has amassed nearly 5 million views at the time of this writing. Perhaps, ironically, the commercial has implanted an idea that people did not already have. Indeed, at least one Broncos fan from last year, who conceived on the night of the Super Bowl, says that it did (Daru 2016). Now we must wait until October of 2017 to see if Patriots fans celebrated their recent Super Bowl victory—arguably the greatest of all time (Silver 2017)—in the same way.
Interested researchers in sport-related fertility need not wait that long, though. While we did not find an effect of the Super Bowl on birth increases, our aforementioned limitations could be overcome by future researchers, and perhaps there is more to the story than we have identified here. There are also other sporting events from around the world that are worth investigating, especially those with larger audiences than the Super Bowl, such as the World Cup and UEFA Champions League final (Tharoor 2016). Different events will have different viewership, fan bases, and perhaps celebratory rituals that could lead to fertility effects contrary to those found here. As long as sports are a worldwide cultural phenomenon, attracting millions of emotionally invested and devout followers, we believe that these types of analyses will be worthy of attention.
Footnotes
Acknowledgements
The authors would like to thank S. Philip Morgan for helpful suggestions throughout the development of this paper.
Funding
The author(s) disclosed receipt of the following financial support for the research, authorship, and/or publication of this article: This research received support from the Population Research Training grant (T32 HD007168) and the Population Research Infrastructure Program (P2C HD050924) awarded to the Carolina Population Center at The University of North Carolina at Chapel Hill by the Eunice Kennedy Shriver National Institute of Child Health and Human Development.
Notes
Author Biographies
References
Supplementary Material
Please find the following supplemental material available below.
For Open Access articles published under a Creative Commons License, all supplemental material carries the same license as the article it is associated with.
For non-Open Access articles published, all supplemental material carries a non-exclusive license, and permission requests for re-use of supplemental material or any part of supplemental material shall be sent directly to the copyright owner as specified in the copyright notice associated with the article.