
Abstract
Research on attitudes toward immigrants has come to divergent conclusions regarding the role of race and ethnicity in shaping these attitudes. Using survey data from 18 European countries, the authors analyze how conditions associated with both economic and cultural threat shape respondents’ receptivity to establishing relationships with immigrants of the same race or ethnicity versus immigrants of a different race or ethnicity. The analyses reveal that the salience of racial and ethnic differences in shaping attitudes toward immigrants is asymmetric. Those who are more likely to express negative attitudes toward immigrants are also more likely to differentiate between immigrants on the basis of race and ethnicity, whereas those less likely to express negative attitudes are also less likely to distinguish between immigrants on the basis of racial and ethnic differences. The authors discuss the substantive and theoretical implications of these findings.
Since the 1950s, rates of immigration into developed countries have dramatically increased (Hainmueller and Hopkins 2014:226). This has resulted in substantial demographic shifts marked by rising racial and ethnic diversity (see Qian and Lichter 2007). With these changes, there have been corresponding increases in negative or exclusionary attitudes toward immigrants and ethnic/racial minorities, and a growing body of research has sought to understand the dynamics of these attitudinal shifts (Ceobanu and Escandell 2010; Dancygier and Laitin 2014; Hainmueller and Hopkins 2014).
In their review of the scholarship on attitudes toward immigrants, Ceobanu and Escandell (2010) highlighted that cross-national research draws predominantly on theories of racial and ethnic prejudice to explain negative attitudes. This is perhaps most readily observable in research using theories of competitive threat to explain sentiments toward out-group populations. The competitive threat perspective distinguishes between economic threats that are associated with the perception of individual socioeconomic vulnerability and cultural threats that are associated with the perception that “the presence of out-group populations may constitute a threat to . . . the cultural, national, and ethnic homogeneity of society” (Semyonov, Raijman, and Gorodzeisky 2006:428; see also Malhotra, Margalit, and Mo 2013; Manevska and Achterberg 2011; Scheepers et al. 2002a). Support for the impact of perceived economic threats on attitudes toward immigrants has been mixed, at best. However, support for the impact of perceived cultural threat has been remarkably consistent across analyses, data sets, and approaches to measuring attitudes toward immigrants (for a review, see Hainmueller and Hopkins 2014).
Although the robustness of research showing the importance of perceived cultural threats in shaping attitudes toward immigrants has been generally interpreted as showing that cultural considerations are central in shaping attitudes toward ethnic out-groups (e.g., Hainmueller and Hiscox 2007; Manevska and Achterberg 2011), the consistency of empirical support for the cultural threat perspective actually appears to challenge this assumption. Comparative and cross-national research has shown that perceived cultural threat shapes attitudes toward immigrants regardless of where an immigrant is from or whether an immigrant is clearly of a different race/ethnicity than the majority of the native population (Hainmueller and Hiscox 2007; Malhotra et al. 2013; Sniderman et al. 2000). As such, the research to date indicates that cultural threats are important in shaping attitudes toward all immigrants and that the effect is not contingent on the presence of racial or ethnic differences.
In light of the privileged theoretical position of race and ethnicity in explanations of attitudes toward immigrants, these findings raise important questions regarding the conditions under which race and ethnicity matter in shaping natives’ attitudes toward immigrants and to whom these differences matter. In this research, we engage these questions through analyses of a unique set of paired questions included in Round 1 of the European Social Survey (ESS), which asks respondents to rate their receptivity toward establishing specific personal and professional relationships with an immigrant if that immigrant shared the same race/ethnicity as the majority of the population in the country versus if that immigrant was of a different race/ethnicity. Accounting for both individual and contextual conditions, our analyses show that older respondents, more conservative respondents, and respondents with lower levels of education are more likely to report divergent attitudes toward immigrants of a different race or ethnicity than toward immigrants who are the same race or ethnicity as the respondent.
These findings reveal that the effects of perceived cultural threat on attitudes toward minority immigrants versus nonminority immigrants are asymmetric. Contrary to research that has treated attitudes toward immigrants as interchangeable with attitudes toward minorities (i.e., Manevska and Achterberg 2011; Scheepers et al. 2002a, 2002b), we find that as competitive threat increases, the extent to which natives view these different outgroups (i.e., immigrants vs. minorities) as interchangeable actually diminishes. Although our analyses show that conditions associated with heightened cultural and economic threats do well in predicting attitudes toward immigrants generally, we find that as natives’ individual propensity toward perceived cultural threat increases, they are more likely to express divergent attitudes toward immigrants on the basis of race and ethnicity. Conversely, natives with a low propensity toward cultural threat are more likely to view immigrants similarly, regardless of their race or ethnicity. As we detail below, intranational and subnational studies have come to divergent conclusions regarding the extent to which ethnic and racial differences shape natives’ attitudes toward immigrants. At the same time, cross-national studies have relied heavily on the assumption that attitudes toward immigrants are driven by ethnic identities and ethnoracial competition but typically do not empirically differentiate between minority and nonminority immigrants. Our research helps address these gaps in the literature by highlighting conditions under which race and ethnicity emerge as salient points of distinction in shaping individuals’ attitudes.
Race, Ethnicity, and Attitudes toward Immigrants
Previous research examining the sources of natives’ attitudes toward immigrants has addressed the effects of racial and ethnic differences between natives and immigrants in three distinct ways. First, many multinational studies theoretically focus on ethnic prejudice while exclusively measuring attitudes toward immigrants (Hello et al. 2002; Manevska and Achterberg 2011; Scheepers et al. 2002a, 2002b; Schneider 2008). For example, in their examination of how education shapes ethnic prejudice, Hello et al. (2002) constructed an index of ethnic discrimination from a series of survey questions asking respondents about the extent to which they agreed with three different statements about immigrants (e.g., “Immigrants area no less intelligent than the [nationals],” p. 10). Similarly, in their study of ethnic exclusionism across 15 European countries, Scheepers et al. (2002a) constructed their dependent variable from a series of five questions asking respondents to rate their agreement with statements about immigrants from outside the European Union.
Second, though less common, several studies measure the dynamics of ethnic prejudice by constructing indices that combine measures of attitudes toward immigrants and attitudes toward racial or ethnic minorities. Analyzing the determinants of ethnic discrimination in the Netherlands, Coenders and Scheepers (1998) construct an index measuring attitudes by combining a series of questions that ask respondents whom they would prefer to see receive a scarce social resource. One set of questions listed “a migrant worker’s family,” “Dutch family,” “should not make any difference,” and “don’t know” as possible responses, while another set of questions included the options, “someone with another skin colour” and “a white person” (p. 420). Similarly, in later research on the effects of education on nationalism and ethnic exclusion, these authors measured ethnic exclusion using a series of questions that asked people to indicate their attitudes on the basis of the immigrant status, refugee status, and linguistic abilities of outsiders (Coenders and Scheepers 2003).
Third, experimental and quasi-experimental research has relied on contextual indicators of ethnoracial difference (e.g., immigrants’ countries of origin) to examine the sociotropic threats posed by immigrants (Brader et al. 2008; Ford 2011; Hainmueller and Hangartner 2013; Hartman, Newman, and Bell 2013; Hopkins 2014; Newman, Hartman, and Taber 2012; Sniderman et al. 2000; Valentino, Brader, and Jardina 2013). For example, Hainmueller and Hangartner (2013) examined a unique situation wherein certain municipalities in Switzerland used popular referendums to make decisions on foreign residents’ citizenship applications. Through a series of surveys, they found that applicants from Turkey and the former Yugoslavia experienced rejection at a far higher rate than immigrants from Northern and Western Europe. Similarly, using survey-embedded experiments, Hartman et al. (2013) showed that attitudes of white Americans are significantly more negative when immigrants are Hispanic rather than white or of an unspecified race.
Although these latter studies conclude that ethnoracial differences do shape attitudes toward immigrants, other experimental research has found that ethnoracial differences do not serve as a meaningful basis for distinction. For example, Sniderman et al. (2000) showed that natives’ attitudes toward immigrants to Italy did not vary significantly on the basis of whether the hypothetical immigrant was from Eastern Europe or Africa. Instead, the authors found that individuals who exhibited prejudicial attitudes against one group were likely to exhibit similar attitudes against other groups. In a different context, research measuring attitudes toward immigrants in Iowa found that ethnoracial differences have weak effects that are salient only among a narrowly defined subset of the study population (Knoll, Redlawsk, and Sanborn 2011). Similarly, Malhotra et al. (2013) found that indicators of cultural threat were significant regardless of whether respondents were asked to report their attitudes toward immigrants with specific visas for high-skilled labor without specifying race, ethnicity, or country of origin, compared with attitudes toward immigrants from India.
Across these different approaches, we see important divisions. Cross-national survey-based research has largely theorized the effects of ethnoracial discrimination on attitudes toward immigrants without measuring the effects ethnoracial differences between immigrants and natives. As a result, many of these studies contend that race and ethnicity are salient in shaping attitudes toward immigrants but do not directly test this proposition. Conversely, although experimental and quasi-experimental research has worked to isolate the effects of ethnoracial differences on attitudes toward immigrants, the results of these studies vary across countries and contexts. As such, although there is compelling evidence to suggest that race and ethnicity are salient in shaping attitudes toward immigrants, it is unclear when race and ethnicity are salient, and to whom.
Conditions Shaping Attitudes toward Immigrants
Although multiple theories have been advanced in an effort to explain sentiments toward out-group populations (for a detailed discussion, see Wimmer 1997), we specifically engage research using competitive threat as an explanation for attitudes toward immigrants because this perspective is the most widely used in multinational survey research (see Ceobanu and Escandell 2010). The competitive threat model presumes that negative sentiments toward out-group populations are driven by fear of competition and are shaped by group identification and unequal access to collective identity, rewards, and resources (Semyonov et al. 2006). Competitive threat has been widely used to explain general attitudes toward out-group populations (e.g., Gorodzeisky and Semyonov 2009; Manevska and Achterberg 2011; Semyonov, Raijman, and Gorodzeisky 2008) and to explain prejudice and discrimination against racial and ethnic minorities (e.g., Bobo and Hutchings 1996; Scheepers et al. 2002a; Kunovich 2004; Quillian 1995; Taylor 1998).
The widespread use of competitive threat in research on attitudes toward immigrants provides us with a well-established foundation on which to build our analyses. As Semyonov et al. (2006) note, two views of competitive threat are common in research on attitudes toward immigrants. The first view focuses on tangible threats resulting from fear of competition for social and economic resources. 1 The second view focuses on threats to the majority culture or national identity (see Wimmer 1997).
In addition to the division between economic and cultural threat, research drawing on competitive threat theories typically account for both individual-level and macro-contextual conditions that are associated with both real and perceived threat against the native population (Kunovich 2004). Macro-contextual conditions, typically measured at the level of countries, have been shown to support and in some cases exacerbate individuals’ threat perception (Ceobanu and Escandell 2010; Kunovich 2004; Semyonov et al. 2006). For example, following this logic, we would expect that individuals’ perceptions of economic vulnerability are rooted not only in their own economic position but in their potential for upward mobility. Consistent with this assumption, scholars have suggested that stronger economies likely contribute to a decline in negative attitudes and improvements in racial and ethnic relations, whereas other national conditions will increase negative attitudes and lead to the deterioration of racial and ethnic relations (Blalock 1967; Kinloch 1974).
Individual-level Predictors
Within the economic view of competitive threat, the most common indicators of vulnerability are income and employment status (Schneider 2008). Previous research has argued that those with low levels of income relative to the general population are more prone to ethnic exclusionism, anti-immigrant prejudice, and negative attitudes toward outgroups more generally (Kiecolt 1988; Scheepers et al. 2002a; Semyonov et al. 2006). Similarly, those who are unemployed are presumed to face the greatest threat from an influx of new potential workers, resulting in higher rates of discrimination and exclusionary attitudes (see Ceobanu and Escandell 2010).
Within the cultural perspective of competitive threat, research has shown that more conservative political ideologies and higher rates of reported religiosity increase perceptions of threat and contribute to negative attitudes toward out-groups (de Figueiredo and Elkins 2003; Kunovich 2009; Scheepers et al. 2002b; Semyonov et al. 2008; Sides and Citrin 2007). For example, Scheepers et al. (2002b) found that both Catholics and Protestants exhibited higher levels of prejudice against ethnic minorities than nonreligious people. Moreover, they found that higher levels of church attendance were significantly and positively associated with prejudicial attitudes. Similarly, multiple studies have found that individuals who report politically conservative views are more likely to hold discriminatory attitudes (Scheepers et al. 2002a; Semyonov et al. 2006, 2008).
One of the most consistent findings across research in this area is an inverse relationship between levels of education and anti-immigrant sentiment (Hainmueller and Hiscox 2007; Hello et al. 2002; Quillian 1995). Despite this consistency, there remains some debate regarding the mechanisms underlying education’s effect on attitudes toward immigrants. Some authors have argued that the association is a result of the liberalizing effect of education (i.e., Hainmueller and Hiscox 2007; for a review, see Ceobanu and Escandell 2010). However, these effects are not uniformly observed in all education systems (see Kunovich 2004), and other scholars have treated education as an indicator of socioeconomic status, including it as a measure of economic threat (Semyonov et al. 2006, 2008). On the basis of Manevska and Achterberg’s (2011) findings that the effects of education are more consistent with the cultural threat perspective rather than the economic, for the purpose of developing hypotheses, we treat education as an indicator of cultural threat (see also Hainmueller and Hiscox 2007).
Country-level Predictors
The emergence of a robust body of cross-national comparative research over the past 20 years has contributed significantly to the theorizing and analysis of how contextual variation affects attitudes toward immigrants. Researchers have focused largely on the effects of a country’s economic conditions and the size of the nonnative population relative to the native population (Coenders et al. 2008; Kunovich 2004; Quillian 1995; Semyonov et al. 2006, 2008). As mentioned previously, strong national economies are typically assumed to decrease negative attitudes toward immigrants and ethnoracial minorities. This follows the logic that as economic opportunities decline, natives’ perceptions of threat posed by immigrants will increase. This association has received mixed support across the literature, yet it remains central to research and theory on anti-immigrant sentiment and ethnic discrimination. For example, Kunovich (2004) found that the effect of individuals’ economic position was weaker in countries with weaker economies, while Quillian (1995) found that gross domestic product (GDP) became significant only when the size of the foreign population was also included in the model. Moreover, Semyonov et al. (2006) found in their analysis of attitudes toward immigrants during four periods between 1988 and 2000 that GDP was significant in 1988 but was not significant in subsequent years.
Another key indicator used in cross-national research on sentiments toward out-group populations is the size of the nonnative population, which has been argued to affect both attitudes toward immigrants and ethnic prejudice (Kunovich 2004; Quillian 1995; Scheepers et al. 2002a). The theoretical assumption underlying these findings is that larger nonnative populations actually introduce a greater degree of competition for resources. Moreover, a larger nonnative population can pose more meaningful challenges to the rights and privileges that are reserved exclusively for the native population (Manevska and Achterberg 2011; Semyonov et al. 2006).
Beyond the strength of the economy and the size of the nonnative population, recent research has drawn on scholarship arguing that anti-immigrant attitudes are exacerbated by extreme right-wing political mobilization showing that, in some cases, the political and ideological climate in a country can meaningfully affect attitudes toward immigrants (Semyonov et al. 2006, 2008). Consistent with the cultural/identity threat view of competition, many extreme right-wing parties use claims of protecting local populations and demonizing immigrants to rally political support. Semyonov et al. (2006, 2008) found that the percentage of the national vote going to such parties is statistically associated with negative sentiments toward out-groups.
Competitive Threat and the Salience of Ethno-racial Differences on Attitudes toward Immigrants
The research highlighted above provides specific theoretical expectations regarding how key conditions should affect sentiments toward out-group populations. The logic underlying the associations between these conditions and out-group sentiments has been used to explain negative attitudes toward immigrants as well as prejudice or discrimination against ethnoracial minorities. As such, we propose the following hypotheses:
Hypothesis 1: Natives who are socioeconomically vulnerable (i.e., low income, unemployed) will be more likely to express negative attitudes toward (a) immigrants of the same race/ethnicity as the majority of the native population and (b) immigrants of a different race/ethnicity as the majority of the native population.
Hypothesis 2: Natives who are ideologically conservative (i.e., politically right leaning, highly religious) will be more likely to express negative attitudes toward (a) immigrants of the same race/ethnicity as the majority of the native population and (b) immigrants of a different race/ethnicity as the majority of the native population.
Hypothesis 3: Natives with higher levels of education will be less likely to express negative attitudes toward (a) immigrants of the same race/ethnicity as the majority of the native population and (b) immigrants of a different race/ethnicity as the majority of the native population.
Hypothesis 4: Regardless of the presence of ethnoracial differences between natives and immigrants, negative attitudes toward immigrants will be positively associated with (a) the relative size of the nonnative population and (b) the percentage of the population that voted for right-wing nationalist parties.
Hypothesis 5: Regardless of the presence of ethnoracial differences between natives and immigrants, negative attitudes toward immigrants will be negatively associated with the strength of the national economy.
Although previous research has found that these conditions broadly affect attitudes toward immigrants, the division between predominantly economic and predominantly cultural threats suggests that some sources of competitive threat should exert a stronger influence on attitudes toward ethnoracial minority immigrants than they do on attitudes toward nonminority immigrants. For example, although nonnative entrants into the labor force may threaten natives’ economic opportunities, and a dramatic population expansion may impose strains on scarce social resources, there is no evidence that those specific threats would be meaningfully affected by the presence of racial or ethnic differences between natives and immigrants (e.g., Knoll et al. 2011; Sniderman et al. 2000). Conversely, though an influx of immigrants may be viewed as posing a threat to the culture and national identity of the majority population, previous research indicates that the presence of ethnoracial differences between natives and immigrants is likely to exacerbate perceptions of those specific threats (e.g., Hainmueller and Hangartner 2013; Newman, et al. 2012). As such, we propose the following hypotheses:
Hypothesis 6: Natives who are ideologically conservative (i.e., politically right leaning, highly religious) will be more likely to express attitudes that are more negative toward racial/ethnic minority immigrants than nonminority immigrants.
Hypothesis 7: Natives with higher levels of education will be less likely to express attitudes that are more negative toward racial/ethnic minority immigrants than nonminority immigrants.
Moreover, although the strength of the national economy and the relative size of the nonnative population are commonly associated with economic threats, a higher proportion of votes awarded to right-wing nationalist parties is more associated with perceptions of cultural or identity-related group threats. As such, we further hypothesize as follows:
Hypothesis 8: Natives in countries where higher percentages of the national vote went to right-wing nationalist parties will be more likely to express attitudes that are more negative toward racial/ethnic minority immigrants than nonminority immigrants.
Data and Methods
To test these hypotheses, we analyze data from Round 1 of the ESS (Norwegian Social Science Data Services 2002). The ESS is a broad, cross-national survey conducted every two years to measure trends in attitudes, behaviors, and beliefs across Europe. The first round of the ESS includes data from 21 European countries and contains an extensive module on immigration, which was not included in subsequent rounds of data collection. Data for the ESS is collected through in-person interviews, and participants are selected through a simple random sampling process of persons aged 15 and older. Data collection procedures and translation processes are standardized across all participating countries to ensure data comparability. As detailed below, the questions used in our dependent variables specify the race/ethnicity of immigrants relative to the racial/ethnic majority in each country surveyed. As such, we limit our sample to only those respondents who do not identify as racial or ethnic minorities in their countries (806 respondents [2.88 percent of the total sample] are excluded on this criterion). This allows us to assess how ethnoracial differences between natives and immigrants affect natives’ attitudes.
Dependent Variables
Our analysis centers on four indicators measuring how much a respondent would “mind” if an immigrant (1) was appointed as his or her boss or (2) married a close relative. Each situation is presented twice, once asking respondents to answer if the immigrant were of a different race/ethnicity than the national majority, then again if the immigrant were of the same race/ethnicity as the national majority. The respondents are asked to answer using a Likert-type scale ranging from 0 to 10, in which higher scores indicate greater discomfort. The structure of these questions is as follows:
Now thinking again of people who have come to live in [country] from another country who are of the same race or ethnic group as most [country] people, how much would you mind or not mind if someone like this [was appointed as your boss/married a close relative of yours]? And now thinking of people who have come to live in [country] from another country who are of a different race or ethnic group from most [country] people. How much would you mind or not mind if someone like this [was appointed as your boss/married a close relative of yours]?
Because all respondents who self-identified as being members of minority groups in their countries were excluded from our analyses, these questions reflect evaluations based on whether immigrants are of the same or a different race/ethnicity as the respondent.
These four questions are the only ones included in the ESS that are paired in a way that differentiates the same scenario based exclusively on the race or ethnicity of an immigrant. 2 Although the specificity of the question construction removes the comparative advantages associated with using a broader index of natives’ perceptions to measure attitudes toward outgroups (i.e., Coenders and Scheepers 2003; see also Hainmueller and Hopkins 2014), they nevertheless provide a unique opportunity to assess variance in responses on the basis of racial and ethnic differences across a far larger set of countries than would be feasible in an experimental design. They also allow us to assess any differences between attitudes toward familial relationships, which are associated more with the cultural dimensions of competitive threat, versus attitudes toward having an immigrant take on the role of a professional superior, which is more closely associated with the economic dimensions of competitive threat.
To measure the difference in people’s answers within each set (i.e., the difference between their attitudes toward intermarriage when the immigrant is of the same race/ethnicity vs. of a different race ethnicity), we subtracted each respondent’s responses on questions regarding immigrants of the same race/ethnicity from his or her responses on the paired question regarding immigrants of a different race/ethnicity. Higher scores indicate greater discomfort with immigrants of a different race/ethnicity.
Independent Variables
Our selection of independent variables follows directly from the extant multinational survey-based research outlined above. These variables include measures of low-income (1 = family income in lowest quintile, 0 = else) political ideology (10-point scale from left to right), 3 and religiosity (frequency of church attendance; e.g., Scheepers et al. 2002b). Employment status is measured as a binary indicator measuring whether the respondent was employed (1 = employed, 0 = else). Regarding our measure of income, the ESS does not code income as a continuous variable. Instead, to maximize cross-national comparability, each respondent’s income decile in his or her country of residence is presented. Because prior research has shown that income has a nonlinear effect on attitudes toward immigrants, we follow Semyonov et al. (2006) by coding income as a binary measurement of low-income status. Individual-level data on income for France, Hungary, and Ireland were coded in Round 1 of the ESS in a way that provided no basis for direct comparison with all other countries in the data (see ESS Round 1 documentation for full discussion). As such, individual income data for these countries were treated as missing for the purposes of our analyses. In an effort to ensure that these omissions did not unduly affect our findings, we ran all of our analyses both with and without income and compared across all other variables to examine whether the inclusion of these three countries affected our broader findings. We found no substantive differences between the results of these analyses, and chose to retain income for the analyses presented below. All alternative models are available on request.
Level of education is coded into a set of six binary variables. These include categories for less than lower secondary, lower secondary, upper secondary, nontertiary postsecondary, tertiary postsecondary, and other. The dummy variable indicating less than lower secondary is used as the reference group. Additionally, we control for respondent’s age (in years) and gender (1 = female, 0 = male). For the purposes of interpretation, we group-mean-center all individual-level independent variables.
In addition to our individual-level variables, we include four country-level independent variables: percentage of the total population of non-European foreigners living in the country, percentage of the population that is foreign born (of any origin), GDP per capita, and percentage of the vote for extreme right-wing political parties. For these variables, we used replication data published by Semyonov et al. (2008) for their analysis of the ESS Round 1 data. Data for each country’s GDP per capita were calculated as the mean of the real GDP per capita for 2000, 2001, and 2002 to account for the entire period of data collection. Data for the percentage foreign born population and percentage non-European population were drawn from Eurostat and were measured as the (1) mean percentage of non–European Union foreigners in 2000 and 2001 and (2) mean percentage of nonnatives in 2000 and 2001. Finally, the percentage of extreme right-wing vote was compiled by Golder (2003) and measured on the basis of the most recent election year to the period of data collection. Descriptive statistics for all variables used can be found in Table 1.
Descriptive Statistics for Variables Used in Statistical Models.

Note: Individual-level n = 22,662, country-level n = 18. EU = European Union; GDP = gross domestic product.
Methods
Following the standard modeling procedures in the cross-national comparative literature on attitudes toward immigrants, we estimate a series of hierarchical linear regression models for each independent variable. This multilevel approach accounts for the error dependence created by the nesting of individuals within countries (Raudenbush and Bryk 2002). More specifically, we use a restricted maximum likelihood estimation technique because of the small number of observations at the country level of analysis (maximum n = 18), which adjusts the variance estimates on the basis of the level of uncertainly regarding the fixed effects for the small level 2 sample size (Raudenbush and Bryk 2002). For each dependent variable, we present four models. Because our sample of 18 countries provides limited degrees of freedom for our country-level analysis, each model presented includes only one country-level independent variable, each of which is presented in turn. To assess whether the inclusion of multiple country-level variables in the same model affected our results (see Quillian 1995), we also ran models including all country-level variables as well as all combinations of country-level variables. The results were substantively consistent and are available on request.
Results
Attitudes toward an Immigrant as a Workplace Boss
Table 2 presents a series of hierarchical linear models measuring attitudes toward having an immigrant as a boss. Looking first at the individual-level conditions for our dependent variable measuring attitudes toward having an immigrant boss of the same race or ethnicity, we see that the results are largely consistent with hypotheses 1a and 2a. We find that those in the bottom income quintile, those with more conservative political ideologies, and those with higher levels of church attendance (indicating religiosity) are more likely to express negative attitudes toward immigrants. Moreover, we find that the effects of education are also consistent with hypothesis 3a. With the exception of those who have completed only some high school, respondents with each level of education are significantly less likely than the reference category to express negative attitudes toward immigrants. The magnitude of the effect also increases along with the level of education up to the tertiary (college) level. This shows that those who have completed high school are significantly less likely than those who have not entered high school to express negative attitudes, with the distance between those achieving higher levels of education and those with less than high school progressively increasing. We also find that age and gender both have significant effects. Age has a positive association with negative attitudes toward immigrants, and female has a negative association. Deviating from hypothesis 1a, we do not find a significant effect for employment status. However, the individual-level variables provide support for both economic and cultural threat explanations of attitudes toward immigrants.
Coefficients and Standard Errors (in Parentheses) from Hierarchical Linear Models of Attitudes toward an Immigrant as a Boss.

Note: Individual-level n = 22,662, country-level n = 18. Models also include constants. The pseudo-R2 values reflect the proportional reduction in error variance. For the same-race set of models, the error variance for the model with no individual-level or country-level variables is 7.118. The intercept variance for model with only individual-level variables is 0.500. For the different-race models, the error variance for the model with no individual-level or country-level variables is 9.304. The intercept variance for model with only individual-level variables is 0.615. AIC = Akaike information criterion; BIC = Bayesian information criterion; EU = European Union; GDP = gross domestic product.
Coefficients and standard errors are multiplied by 1,000 for ease of presentation.
p < .05, **p < .01, and ***p < .001 (two tailed).
Turning to the country-level variables, we find no significant effect for the percentage of non–European Union population. The percentage of the foreign-born population does have a significant effect, but the effect is the inverse of the expectations detailed in hypothesis 4. These results indicate that as the size of the foreign-born population increases, negative attitudes toward having an immigrant as a boss decrease. Specifically, every 1 percentage point increase in the foreign-born population in a country is related to a 0.05 decrease in negative attitudes (on a scale of 0–10). Although multiple studies have found that the size of the nonnative population increases perceptions of threat (e.g., Kunovich 2002; Quillian 1995; Scheepers et al. 2002a), Ceobanu and Escandell (2010) note that a larger nonnative population may actually suppress perceptions of group competition because larger populations result in greater interpersonal contact between natives and nonnatives, thereby decreasing negative attitudes (see also Schlueter and Wagner 2008). We also see that, consistent with hypothesis 5, there is an inverse relationship between GDP and negative attitudes toward immigrants. In this case, every $1,000 increase in GDP per capita in a country is related to a 0.046 decrease in negative attitudes toward immigrants of the same race (on a scale of 0–10). However, we find no significant effect for the percentage of the vote going to extreme right-wing parties.
Turning to our models measuring attitudes toward having a boss of a different race or ethnicity, we see that the results of the individual-level analysis are fully consistent with our analysis of attitudes toward a having a boss of the same race or ethnicity, largely confirming hypotheses 1b, 2b, and 3b. The primary difference between these models and the analysis of attitudes toward a boss of the same race/ethnicity is observed in the country-level variables, where we see no significant effect for the percentage of foreign born, and more substantively, the size of the coefficient is reduced (–0.05 vs. –0.034). Here, we still find support for the association between GDP and attitudes toward immigrants (hypothesis 5), but the size of the effect is again reduced (–0.046 vs. –0.038). For these two variables, the country-level pseudo-R2 value is also substantially lower, indicating that these variables do not explain as much of the variation at the country level. However, we find no association between the variables for percentage foreign born (both non–European Union and total) and percentage right-wing vote (hypothesis 4) when measuring attitudes toward a professional relationship with an immigrant.
Attitudes toward an Immigrant Marrying a Close Family Member
Table 3 presents the results of our analyses measuring attitudes toward a close family member marrying an immigrant. Again, beginning with our analysis of attitudes toward an immigrant of the same race/ethnicity as the respondent, we see that the results are highly similar to our analysis of attitudes toward having an immigrant of the same race/ethnicity as a boss. Generally consistent with hypotheses 1a and 2a, we see that income, political ideology, religiosity, age, and gender are all statistically significant with the same directions for the effects. Consistent with hypothesis 3a, we find that, with the exception of those who completed only some high school and those labeled “other” for education, the effects of education are similar to the models presented in Table 2. The results of our country-level variables are also consistent with our previous analysis of natives’ attitudes toward having an immigrant as a boss, with both percentage foreign born and GDP per capita having a significant negative effect.
Coefficients and Standard Errors (in Parentheses) from Hierarchical Linear Models of Attitudes toward Close Family Intermarriage.
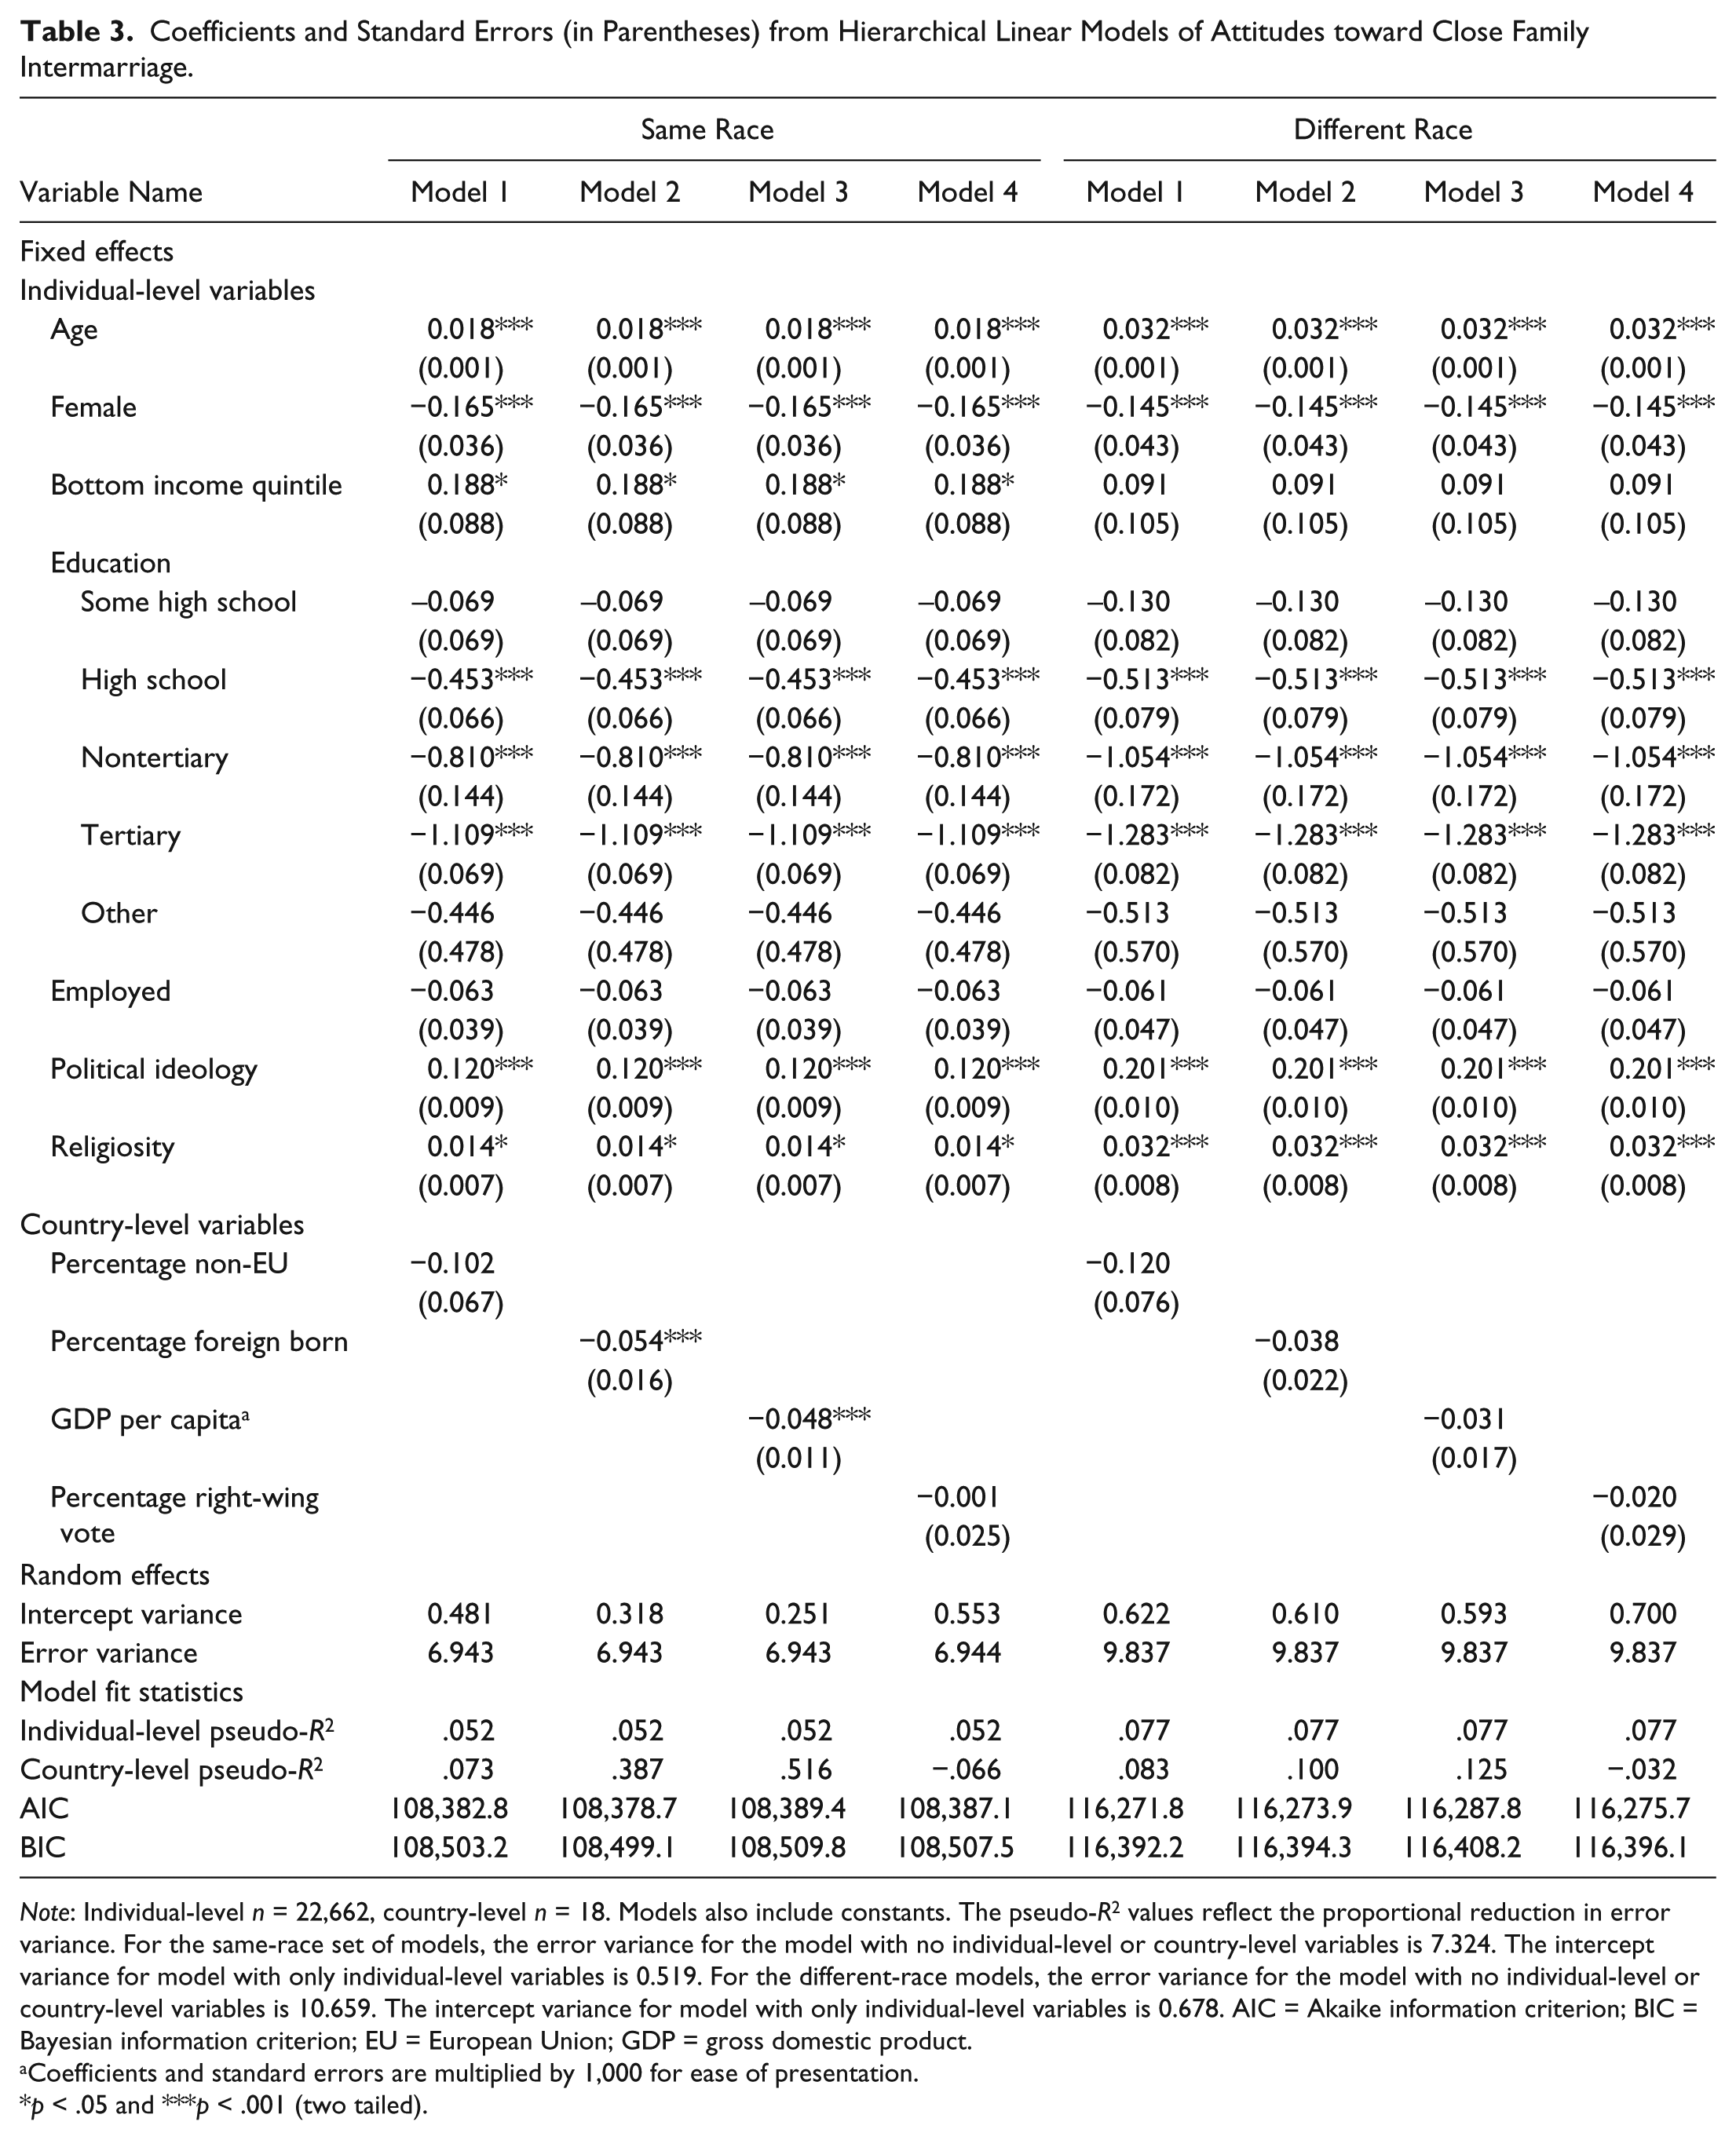
Note: Individual-level n = 22,662, country-level n = 18. Models also include constants. The pseudo-R2 values reflect the proportional reduction in error variance. For the same-race set of models, the error variance for the model with no individual-level or country-level variables is 7.324. The intercept variance for model with only individual-level variables is 0.519. For the different-race models, the error variance for the model with no individual-level or country-level variables is 10.659. The intercept variance for model with only individual-level variables is 0.678. AIC = Akaike information criterion; BIC = Bayesian information criterion; EU = European Union; GDP = gross domestic product.
Coefficients and standard errors are multiplied by 1,000 for ease of presentation.
p < .05 and ***p < .001 (two tailed).
Turning to the models measuring attitudes toward an immigrant of a different race/ethnicity marrying a close family relative, we see two distinct features. First, we find no significant effect for income. In conjunction with the nonsignificant effect of employment status, these results lead us to reject hypothesis 1b for this dependent variable. The lack of significance for income and employment status suggests that the relationship between economic threat and attitudes toward establishing a familial relationship with an immigrant are in fact quite weak.
Second, we find no significant country-level effects for attitudes toward an immigrant of a different race/ethnicity marrying a close family member. Beyond statistical significance, the relative sizes of these effects are also quite a bit smaller than in the previous models, and the country-level pseudo-R2 values are low. These results lead us to reject hypotheses 4 and 5 for this specific dependent variable.
Attitudinal Divergence by Racial/Ethnic Status
To test hypotheses 6, 7, and 8, we computed the difference between scores for each set of questions for each individual to examine what factors affect the degree of attitudinal divergence based on immigrants’ ethno-racial status for both familial and professional relationships. The results of this analysis are presented in Table 4.
Coefficients and Standard Errors (in Parentheses) from Hierarchical Linear Models of Attitudinal Divergence Based on Race/Ethnicity.

Note: Individual-level n = 22,662, country-level n = 18. Models also include constants. The pseudo-R2 values reflect the proportional reduction in error variance. For the marriage set of models, the error variance for the model with no individual-level or country-level variables is 5.854. The intercept variance for model with only individual-level variables is 0.247. For the boss set of models, the error variance for the model with no individual-level or country-level variables is 4.039. The intercept variance for model with only individual-level variables is 0.116. AIC = Akaike information criterion; BIC = Bayesian information criterion; EU = European Union; GDP = gross domestic product.
Coefficients and standard errors are multiplied by 1,000 for ease of presentation.
p < .05, **p < .01, and ***p < .001 (two tailed).
The results of our analysis for attitudes toward both professional and personal relationships support hypotheses 6. We see that respondents with conservative political leanings and with higher rates of church attendance are more likely to respond more negatively toward immigrants of a different race/ethnicity than immigrants of the same race/ethnicity. Consistent with a division between the economic view of competitive threat and the cultural/identity view, we see that income and employment status have no statistically significant effect.
Looking at the effects of education, we see that for attitudes toward intermarriage, only the tertiary level has a significant effect. For attitudes toward a boss, tertiary and high school levels have significant effects. These findings are generally consistent with assertions that higher education produces a liberalizing effect, resulting in a reduction in negative attitudes toward immigrants, supporting hypothesis 7.
We also find that across all models for both relationship types, age is positively associated with responding more negatively toward immigrants of a different race/ethnicity than immigrants of the same race/ethnicity. These findings appear consistent with previous research showing that older individuals are more likely to express greater levels of prejudice toward ethnoracial minorities (see Gorodzeisky and Semyonov 2009; Maykovich 1975; Quillian 1995). The effects of gender are less consistent. We find that in responses to intermarriage with an immigrant, there is no statistical difference between men and women. However, men are significantly more likely to respond more negatively to a minority boss than a nonminority boss.
The country-level analyses for both types of relationships show no significant effects, leading us to reject hypothesis 8. These findings suggest that deviation in attitudes toward immigrants on the basis of racial and ethnic difference is driven largely by conditions at the individual level. We recognize that failure to reject the null hypotheses is not tantamount to evidence for the null hypotheses and that there might be other factors at play with here with our measurement and model specification. However, given that some of these variables were significant in previous models, and here the size of the coefficients are substantially reduced, we contend that the lack of significant findings in these models is instructive.
Discussion
Our analyses inform how competitive threats shape attitudes toward immigrants. Consistent with previous research, we find that conditions associated with greater levels of cultural threat are relevant for explaining attitudes toward immigrants, and we find very little difference in how these conditions shape attitudes toward minority versus nonminority immigrants in general. However, when we examine the conditions that are associated with natives’ explicitly distinguishing attitudes toward immigrants on the basis of the presence or absence of racial/ethnic differences, we find that the only significant predictors are those most commonly associated with conservative political and social ideologies.
Beyond simply expressing more negative attitudes toward immigrants in general, respondents who are older, are more religious, are more politically conservative, and have lower levels of education are actually more likely to report different (more negative) attitudes toward immigrants of a different race or ethnicity than toward immigrants of the same race or ethnicity. These findings indicate that the effects of perceived cultural threat on attitudes toward minority immigrants versus nonminority immigrants are asymmetric. Although race and ethnicity are not salient in shaping attitudes toward immigrants for natives who are less prone to perceptions of cultural threat, natives who are more prone to perceptions of cultural threat also draw greater distinctions between immigrants on the basis of race or ethnicity.
This asymmetry is relevant for how cultural threat—and competitive threat, more generally—is theorized. Although a growing number of studies have worked to disentangle attitudes toward immigrants from attitudes toward ethnoracial minorities, cross-national research on attitudes toward immigrants has long treated these attitudes as interchangeable (i.e., Manevska and Achterberg 2011; Scheepers et al. 2002a; Schneider 2008). Our findings indicate that this is not the case, and as competitive threat increases, the extent to which these different outgroups (i.e., immigrants vs. minorities) are viewed as interchangeable actually diminishes. For respondents who are considered less prone to perceptions of cultural threat, we find no significant difference in attitudes toward immigrants on the basis of race or ethnicity. We contend that this does not indicate that attitudes toward immigrants and attitudes toward ethnoracial minorities are interchangeable for those who are more educated and more socially and politically liberal. Instead, it seems more probable, on the basis of our analyses and prior research (i.e., Malhotra et al. 2013), that race and ethnicity are simply not salient features in shaping the attitudes of natives who are not highly prone to perceptions of cultural threat. Importantly, the ethnic view of competitive threat tends to theoretically focus on negative attitudes, treating negative perceptions of immigrants as synonymous with ethnic prejudice. Yet it is precisely at the negative end of the attitudinal distribution that support for this assumption appears to break down.
It is possible that the results of our analysis were influenced by social desirability bias during data collection, which could have led some respondents to downplay their negative attitudes or overestimate their positive attitudes for fear of being perceived badly by the interviewer asking them questions (see Coenders and Scheepers 1998 for a discussion of this problem). However, if we assume that this is the case, we see that conservative respondents, older respondents, and those with less education were nevertheless significantly more willing to express divergent attitudes toward immigrants on the basis of the presence of racial and ethnic differences. Absent an experimental design, it would be prohibitive to explicitly isolate the effects of race and ethnicity without risking some social desirability bias. However, even with this limitation, our findings still stand to add depth to our knowledge of how race and ethnicity shape competitive threat.
The absence of contextual effects on ethnoracially driven attitudinal divergences also stands to inform how we understand attitudes toward immigrants. Immigrant status is defined in relation to the boundaries of nation-states (Bail 2008; Wimmer 1997). However, ethnoracial minority status is not uniformly embedded in state structures, and its salience can vary widely across cases and contexts (Wimmer 2008). This connection between state boundaries and the fundamental definition of an immigrant makes it unsurprising that country-level contextual factors would shape attitudes toward immigrants. Yet given that the salience of ethnic and racial boundaries varies widely across social contexts (Wimmer 2008), there is an intuitive logic in the absence of any significant contextual effects in predicting whether natives’ attitudes will differ when confronted with an immigrant of the same versus a different race or ethnicity. Although we are hesitant to draw strong conclusions on the basis of the absence of an effect, we believe that this distinction in the effects of contextual variables warrants further research.
Footnotes
Acknowledgements
We would like to thank Corey Abramson, Ronald Breiger, Andrew Fullerton, Megan Henley, and Daniel Martinez for their insights and encouragement.
1
We would note here that empirical support for the effects of economic competition has been inconsistent, and the perspective has been critiqued and called into question (for reviews, see Hainmueller and Hopkins 2014; ![]() ). However, because this perspective continues to inform cross-national survey research on attitudes toward immigrants, we consider it important to account for it in our research.
). However, because this perspective continues to inform cross-national survey research on attitudes toward immigrants, we consider it important to account for it in our research.
2
This version of the ESS also include a similar set of paired questions (differentiating by same and different race/ethnicity) on attitudes about immigration. Specifically, the questions ask respondents about the number of immigrants their countries should allow to come and live there. We did not include this set of questions in our analysis, as it is focused primarily on attitudes about immigration rather than attitudes about immigrants (and social distance with them), which is conceptually and theoretically a different consideration (see ![]() ). However, as a check on this choice, we also ran all of the same models using this pair of outcomes. Our conclusions as discussed below and our assessment of these theories would not change with this outcome. The only notable difference between the two sets of models was for the variable for religiosity: it is not significant in the attitudinal divergence models. Thus, our choice to exclude this pair of questions is a substantive and theoretical consideration and is not driven by the findings.
). However, as a check on this choice, we also ran all of the same models using this pair of outcomes. Our conclusions as discussed below and our assessment of these theories would not change with this outcome. The only notable difference between the two sets of models was for the variable for religiosity: it is not significant in the attitudinal divergence models. Thus, our choice to exclude this pair of questions is a substantive and theoretical consideration and is not driven by the findings.
3
We also tested other conceptualizations of cultural political conservatism at the individual level, including ![]() scale measuring support for authoritarianism using six items from the ESS. We found that this measure is significantly related to both dependent variables measuring attitudes toward immigrants with substantively large effects (results available on request). Specifically, we found that an increase in support for authoritarianism is related to an increase in negative attitudes toward immigrants in both contexts, as expected from the cultural perspective of competitive threat theory. However, we chose to exclude this variable from the final analysis as this set of questions was not used in the ESS across all locations. Thus, to include the measure, we would have had to exclude Italy and Luxembourg from the analysis. Given that we include other measures aimed at capturing this theoretical perspective, we chose to exclude the measure of authoritarianism to retain as many countries in the analysis as possible.
scale measuring support for authoritarianism using six items from the ESS. We found that this measure is significantly related to both dependent variables measuring attitudes toward immigrants with substantively large effects (results available on request). Specifically, we found that an increase in support for authoritarianism is related to an increase in negative attitudes toward immigrants in both contexts, as expected from the cultural perspective of competitive threat theory. However, we chose to exclude this variable from the final analysis as this set of questions was not used in the ESS across all locations. Thus, to include the measure, we would have had to exclude Italy and Luxembourg from the analysis. Given that we include other measures aimed at capturing this theoretical perspective, we chose to exclude the measure of authoritarianism to retain as many countries in the analysis as possible.