
Abstract
Changes in marriage and employment patterns may have affected health insurance coverage rates differently for women and men. The author investigates changes in health insurance coverage between 1988 and 2008, focusing on employer-sponsored insurance (ESI) dependent and employee coverage. Using Oaxaca-Blinder decompositions and Current Population Survey data, the author finds that married men’s coverage as dependents increased from 1988 to 2008, but a smaller share of men were married in 2008. Coupled with declines in ESI employee coverage, changes in marriage increased men’s uninsurance rate. In contrast, marital changes for women were offset by their increased employment and insurance coverage as employees.
Marital status influences access to many valued resources. On average, married individuals have higher household incomes and net worth than unmarried persons with similar characteristics (Schmidt and Sevak 2006; Waite 1995), but the magnitude of marital status differences is quite different for women and men. Women tend to economically benefit more than men from marriage, partially because of the gender wage gap and poor compensation for care work (England 2000). Gender differences in resource gains from marriage may be changing, however, as married women’s employment increases. This article considers changes in the distribution of the resource of health insurance coverage, access to which is closely tied to employment and marital status.
For the past several decades, most adults in the United States have obtained health insurance coverage through their own employers or their spouses’ employers (through dependent coverage), with only a small share of nonelderly adults covered through privately purchased insurance or public insurance (Buchmueller and Monheit 2009; Cohen et al. 2009). Legislative action in 2010 culminating in the Patient Protection and Affordable Care Act (ACA) substantially increased access to health insurance by increasing Medicaid eligibility and expanding access to the individual market for private insurance, but the ACA did not alter the primacy of employer-sponsored insurance (ESI).
Twenty years ago, Meyer and Pavalko (1996) noted that few studies considered how family characteristics associate with health insurance coverage even though, then and now, a large share of Americans obtain their health insurance as dependents through the employment-based insurance system. Despite a large body of scholarship on health insurance coverage, research on the relationship between family characteristics and health insurance coverage has been limited. Notably, many studies of family characteristics and health insurance have focused exclusively on women, neglecting the possibility that men’s access to insurance may also vary substantially by family characteristics.
Employment patterns among U.S. adults have changed substantially in recent decades (Mosisa and Hipple 2006), resulting in a smaller gap in women’s and men’s employment rates. Marriage patterns have also changed (Cherlin 2010), with adults married for a smaller share of their working-age years. To understand how these changes in employment and marriage affected insurance coverage for women and men, I examine how the associations of gender and marital status with health insurance coverage changed between 1988 and 2008, focusing on ESI coverage.
Background
Health Insurance Eligibility, Family Characteristics, and Gender
Prior to the implementation of the ACA, health insurance was not easily purchased on the private market (Swartz 2006). As a result, only 8.9 percent of the U.S. population had private nongroup health insurance in 2008 (DeNavas-Walt, Proctor, and Smith 2009). Instead, most adults with private insurance obtained coverage through group plans offered by employers. Because ESI coverage is much more affordable than private nongroup insurance, take-up rates for ESI coverage were high. One study found that only 7 percent of adults with employer offers of insurance were uninsured (Gruber 2008).
ESI plans often include an option to cover dependent family members. Notably, coverage as a dependent is usually limited to individuals who are the legally recognized spouses or dependent children of the employee; unmarried cohabiting partners and other relatives are usually ineligible for such coverage (Ashack 2014). 1 Thus, most adults cannot obtain ESI dependent coverage unless they are married. 2
One problem with the system of ESI coverage is that not all workers have the opportunity for coverage. In 2008, 63 percent of employers offered health insurance coverage to workers, with large employers and employers with more high-wage workers more likely to do so (Kaiser Family Foundation and Health Research & Educational Trust 2008). Additionally, employers are much less likely to offer ESI coverage to part-time workers (Buchmueller and Monheit 2009; Kaiser Family Foundation and Health Research & Educational Trust 2008). Because married women and mothers have lower full-time employment rates than unmarried women and childless women (Hoffman 2009), they may have less access to ESI. Partially as a result of employment patterns and employer offer rates, just over half of workers had ESI coverage in their own names in the 2000s (Buchmueller and Monheit 2009).
Access to public insurance was (and continues to be) conditional on family characteristics in many states. Prior to the welfare reform legislation (the Personal Responsibility and Work Opportunity Reconciliation Act) passed in 1996, many states automatically enrolled unmarried mothers who received welfare into state Medicaid programs. This link between welfare and Medicaid was severed in the years following welfare reform (Chavkin, Romero, and Wise 2000), and uninsurance rates among low-income unmarried mothers increased (Cawley, Schroeder, and Simon 2006). Medicaid continued to provide health insurance to some poor mothers after welfare reform, and some states began expanding eligibility for public health insurance to some poor fathers of qualified children (Heberlein et al. 2012). These expansions, however, were mostly limited to parents in families with extremely low incomes (Heberlein et al. 2012).
Changes in the Associations between Family Characteristics and Health Insurance
Several factors suggest that the associations among family characteristics, gender, and health insurance coverage have likely changed over the past two decades. First, as is well documented by family demographers, there have been tremendous changes in marriage patterns (Cherlin 2010). Women are marrying at a later age, and a higher percentage of adults are expected to never marry. Divorce rates are also fairly high. Thus, adults are married for fewer of their working years. Second, changes in the employment-related behaviors of women meant that both married and unmarried mothers began working more, but unmarried mothers increased their employment rates by more than married mothers (Hoffman 2009). Third, men’s employment rates decreased over this period, especially for men with low levels of education (Mosisa and Hipple 2006). Finally, the characteristics of those who occupied each family status changed. For example, marriage became less common among those with less education (Cherlin 2010). Together, these changes to marriage and employment patterns suggest that women and men’s access to health insurance, particularly ESI, may have changed in different ways over the past two decades.
Previous Research on Family Characteristics, Gender, and Health Insurance
Many government and foundation reports estimate the share of men and women covered by particular health insurance types, and some of these reports include separate estimates by marital status. Still, previous in-depth research on the connections between family characteristics and health insurance coverage for adults, especially for men, has been quite limited. Below, I discuss the relevant findings and gaps in the existing literature.
First, cross-sectional associations of marital status and insurance consistently find that married individuals are more likely to be insured than their unmarried peers (e.g. Levy 2007; Peters, Simon, and Taber 2014). Several studies that compared insurance rates for married and (unmarried) cohabiting couples also found that married adults have higher rates of insurance coverage (Ash and Badgett 2006; Buchmueller and Carpenter 2010; Ponce et al. 2010).
Second, recent research has found that adults change or lose insurance coverage following a divorce (Lavelle and Smock 2012; Peters et al. 2014; Zimmer 2007), though findings are mixed as to whether women and men are similarly affected. Zimmer (2007) found that both women and men have higher odds of uninsurance following a divorce, whereas Peters et al. (2014) found effects of divorce (controlling for individual fixed effects and other factors) only for women with children. The Peters research team also found that though women and men both experienced decreases in ESI dependent coverage following divorce, changes in ESI employee coverage varied by gender and education; women of all education levels had increases in ESI employee coverage, but men with low levels of education did not have increases in ESI employee coverage. In another analysis of insurance coverage following divorce, Lavelle and Smock (2012) found increases in uninsurance concentrated among women who previously had ESI dependent coverage.
Third, the associations of marriage with insurance coverage are not static but rather have changed over time. In the study that is most similar to my analysis, Glied, Jack, and Rachlin (2008) examined how the associations among insurance coverage, employment, and marital status for women changed over time from 1980 to 2005. They found that women’s coverage rates through ESI dependent coverage declined over time, whereas their coverage through public insurance increased. Using Oaxaca-Blinder decomposition methods (the same method used in this work), they found that increases in women’s full-time employment more than offset declines in the share who were married. Because Glied et al. did not examine men, it is unknown whether men experienced similar changes in ESI dependent coverage rates or whether the associations between marital status and coverage also changed over time for men.
In summary, the previous literature shows that being unmarried is a predictor of being uninsured, that divorce is often associated with being uninsured and with changes in insurance coverage type, and that the association between marital status and coverage type for women has changed over time. Still, several shortcomings characterize this literature. Importantly, little attention has been paid to the associations between marriage and insurance coverage for men. To my knowledge, only one study has focused on gender differences in the associations between health insurance types and marital status. Using data from the early 1990s, Short (1998) found surprising gender similarities. Because recent studies have focused on women, we do not know whether changes over time in marriage have affected men’s access to particular types of health insurance coverage, especially ESI dependent coverage and ESI employee coverage.
Other Factors Affecting ESI Coverage Rates
Employer offers of health insurance for workers have fluctuated in recent decades (Vistnes et al. 2012), but the trend in premium costs for workers is clear: ESI insurance premiums grew faster than wages or inflation for almost every year from 1988 to 2007 (Buchmueller and Monheit 2009). All else equal, these changes are expected to reduce ESI coverage rates and increase uninsurance rates for working-age adults.
Population-level changes in demographic characteristics may also have affected insurance coverage. The aging and increasing educational attainment of the population may have contributed to higher rates of ESI employee coverage, as both older age and higher education are positively associated with employer offers of ESI. Factors that might have decreased the share with ESI coverage include an increase in the percentage of the population who are immigrants (Buchmueller et al. 2007; Rutledge and McLaughlin 2008) and a decrease in union membership (Buchmueller, Dinardo, and Valletta 2002) as both nativity and union membership are associated with ESI coverage. Additionally, changes in the geographic distribution of the population may have affected insurance coverage, as states differ in their industry concentrations, regulation of health insurance markets, and public health insurance eligibility, all of which affect insurance coverage.
Data and Methods
In this article, I present estimates of the percentages of working-age adults with ESI coverage as dependents, ESI coverage as employees, and no health insurance and how these percentages would be different if the family characteristics and employment behavior of women and men had remained unchanged over time.
The data for this analysis are from the 1989 and 2009 March Current Population Survey (CPS), corresponding to coverage rates for years 1988 and 2008, respectively. Although it is possible to analyze data for years more recent than 2008 or years prior to 1988, I did not do so for theoretical and methodological reasons. First, the health insurance items on survey waves in the early 1980s were less detailed, making inclusion of years prior to 1988 problematic. Second, the first wave of changes resulting from the ACA, including changes to young adults’ eligibility for coverage under their parents’ insurance, were implemented in 2010, so I do not use post-2010 data. The year 2009 had particularly high unemployment, and family characteristics may differently associate with insurance coverage during high-unemployment periods. Thus, I use data for 1988 and 2008, years with similar unemployment rates: 5.5 percent in 1988 and 5.8 percent in 2008.
The CPS is considered one of the best sources of data for examining long-term trends in health insurance coverage because the data are nationally representative, the samples are large, and the health insurance items have been continuously collected for a long period. Notably, there are some limitations of CPS data. Estimates of uninsurance from the CPS are slightly higher than estimates from other sources (Call, Davern, and Blewett 2007), and information on several characteristics known to be associated with health insurance status (e.g., citizenship status and union membership) was not collected in all years. Additionally, the CPS includes information on insurance coverage but does not include information on employment offers of ESI insurance that employees turned down.
Sample
The population of interest is working-age adults (ages 19–64 years). (Adults age 65 and older are covered by Medicare.) My sample sizes are large: 40,353 for men in 1988, 57,432 for men in 2008, 41,620 for women in 1988, and 61,213 for women in 2008.
Variables
Health insurance coverage
Individuals are coded as having the following types of insurance: (1) ESI coverage as an employee, (2) ESI coverage as a dependent, (3) public insurance from Medicaid or Medicare, (4) military or veterans’ health care through CHAMPUS or TRICARE, or (5) private nongroup health insurance. If individuals do not report one of these types of insurance, I code them as uninsured. For the minority of individuals who report simultaneously holding multiple insurance types, I recode them having a single insurance type according to the following hierarchy: (1) ESI employee coverage, (2) ESI dependent coverage, (3) military coverage, (4) private nongroup coverage, and (5) public coverage.
Family structure
Because eligibility for ESI dependent status is associated with marital status and eligibility for public insurance is based on parental status, I use a combination of the individual’s marital status and whether there are children in the household to define family structure. The CPS does not include an item specifically asking men if they have biological or adopted children, so I use the presence of children as a proxy for parental status. Because some women and men with children in their households may not be the legally recognized parents or guardians of the resident children, my measure likely overstates the share of parents with resident children. (For public health insurance eligibility, parents living apart from their children are rarely treated as parents.)
The seven family structures are as follows: (1) married with no children present; (2) married parent; (3) divorced with no children present; (4) divorced parent; (5) all widowed, including those with children present and with no children present; (6) never married with no children present; and (7) never married parent. Because cohabitating status is rarely linked to insurance eligibility, I do not incorporate cohabitation into my measure of family structure.
Primary Activity and Sector
Four primary activity categories are used in the analysis to describe an individual’s level of involvement in paid employment and schooling. I follow the convention of defining full-time year-round work as employment for 50 or more weeks per year for 35 hours or more per week. Members of the Armed Forces are also coded as full-time, year-round workers. If an individual reports employment in the previous year but fewer than 35 hours per week, or employment for less than 50 weeks in the previous year, I categorize that individual as a part-time or partial-year worker. Individuals who report full-time enrollment in school or identify schooling as their major activity are coded as students. Finally, I define a fourth category that identifies individuals who are neither working nor enrolled in school. This category includes individuals who were not employed for any weeks in the previous year for any reason including inability to find work, illness or disability, or because they were caring for dependents or “keeping house.” These four categories of major activity are mutually exclusive.
Because employment sector is strongly related to ESI coverage, I categorize employed individuals as working in the private sector, public sector, or self-employed. Eight mutually exclusive categories emerge from crossing major activity with sector.
For age, I use six age categories: 19 to 25, 26 to 29, 30 to 39, 40 to 49, 50 to 59, and 60 to 64 years. Because adults under age 25 and over age 60 have lower employment rates than other adults, I use smaller bins to capture both tails of the distribution.
For race/ethnicity, previous research has found notable differences in insurance coverage by race and ethnicity that are not fully explained by employment or income. On the basis of individuals’ responses to the race and Hispanic ethnicity questions, I divide the population into four racial/ethnic groups: white non-Hispanic, black non-Hispanic; Hispanic, any race; and other.
Educational attainment is associated with an employee’s likelihood of having an employer offer of insurance. I classify individuals by their highest level of educational attainment into the following categories: less than high school, high school, some college, and college degree or higher degree.
Health insurance access varies substantially across states. I include state dummy variables so that changes in the population distribution across states do not affect my conclusions about the factors of primary interest: family characteristics, gender, and employment.
Methods
To examine changes in health insurance coverage rates between 1988 and 2008, I use Oaxaca-Blinder decompositions. These types of models have been used in many previous studies examining change in insurance coverage over time (e.g., Acs 1995; Glied et al. 2008). In brief, ordinary least squares (OLS) regression models predicting the percentage with a particular insurance type are estimated separately for the two groups under examination (e.g., women in 1988 and women in 2008), and then the difference in predicted means for these two groups is decomposed into the part attributable to two components: changes in the characteristics (also referred to as the composition or endowments) of the groups being compared and changes in the coefficients associated with these endowments or characteristics. For example, this decomposition method allows me to examine how much of the decrease in ESI dependent coverage for women between 1988 and 2008 can be attributed to a decline in the share of women who are married (a change in composition or endowments) versus a change in the ESI dependent coverage rate for married women (a change in the coefficient associated with marriage). To aid interpretation, I multiplied all coefficients by 100; coefficients refer to changes in percentage points of coverage.
I estimate regression models for all insurance coverage types, but I focus my discussion on the results for ESI coverage and uninsurance. The regression model for each coverage type includes variables for family structure, age, race/ethnicity, educational attainment, primary activity or employment sector, and state of residence. I tested alternative specifications, including (1) substituting the variables for education with those for family income and (2) excluding state variables. The patterns of results are fairly similar. (Results available upon request.)
In the results presented, I estimated regressions (and performed Oaxaca-Blinder decompositions) separately for women and men. In preliminary analyses, I estimated the regressions models with women and men pooled together and with interactions between family characteristics and gender included in the models. For all three of the most common insurance types (ESI employee, ESI dependent, public), I found statistically significant and sizable interactions between gender and all seven family types in both 1988 and 2008. Because the associations of education, employment, and state with insurance also vary by gender, I estimate separate models for women and men. This also facilitates comparisons with previous research that examines coverage for women and men separately.
My sample includes more than 40,000 individuals for each gender and year. Thus, the standard errors are small. Because of this, I focus on the direction and magnitude of differences, instead of simply on whether differences are statistically different from zero.
Results
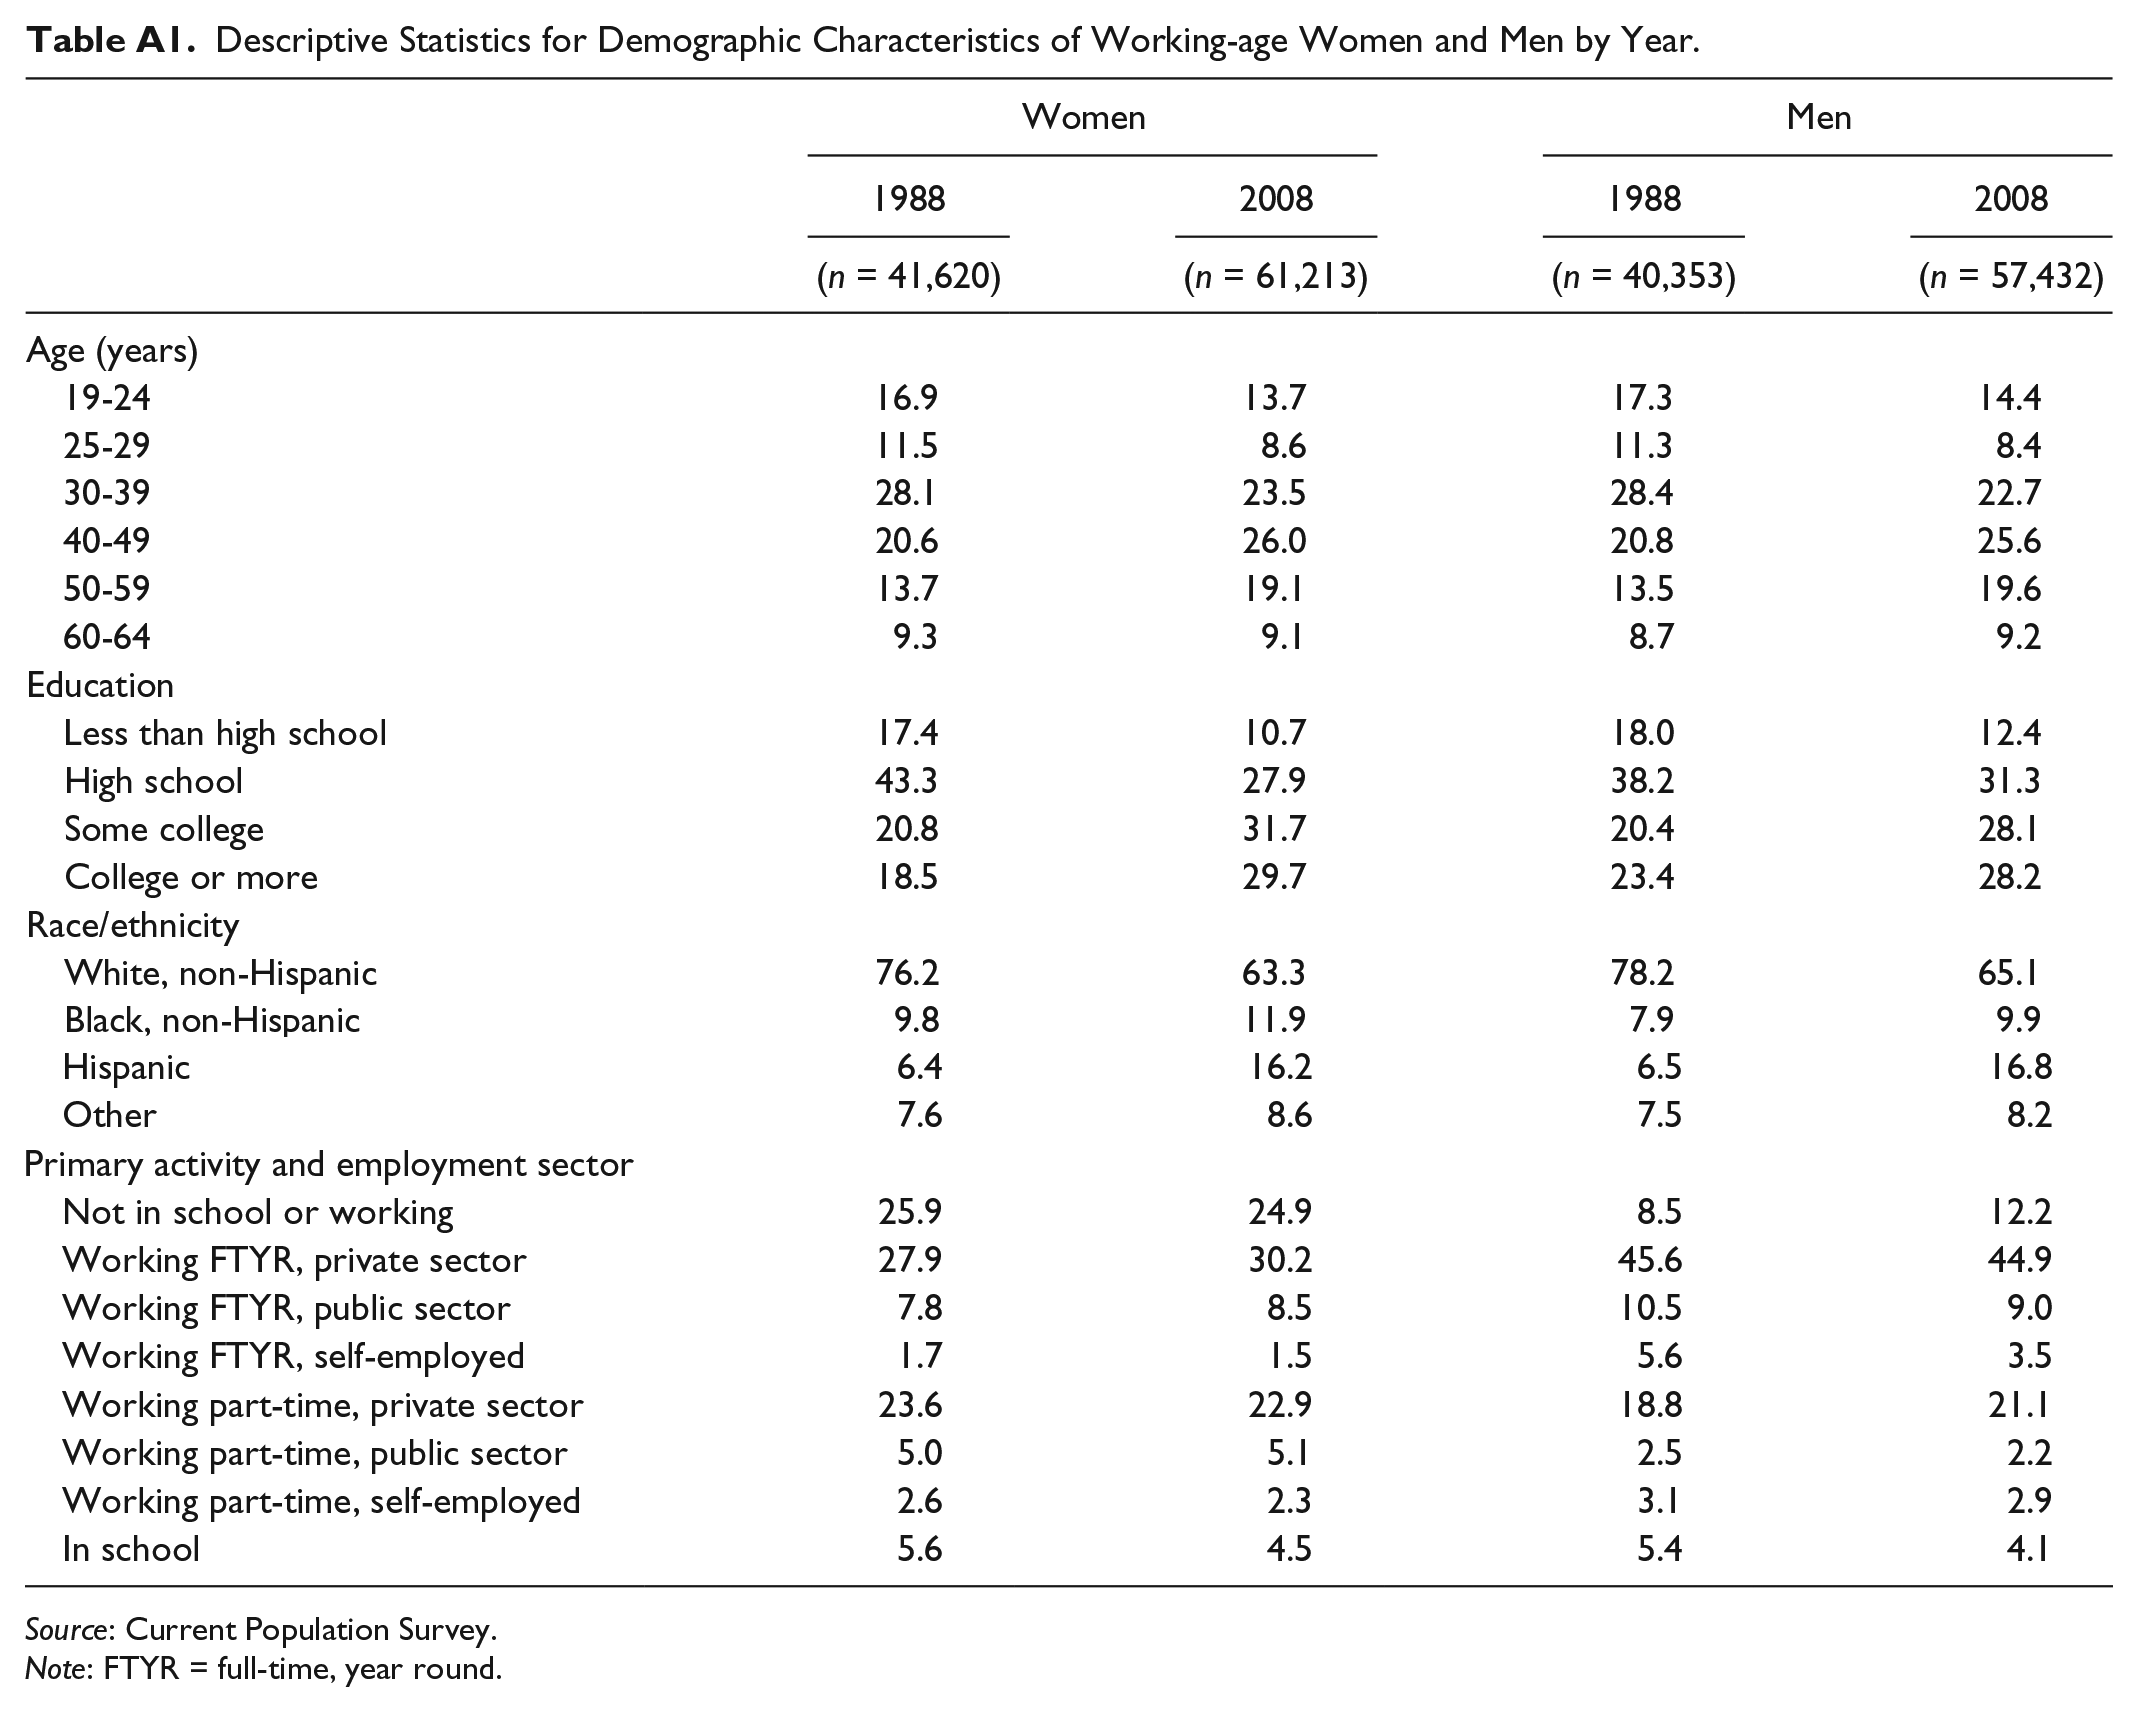
Table 1 shows the distribution of health insurance coverage, family structure, and employment for working-age women and men for 1988 and 2008. (The distributions of other demographic characteristics are shown in Table A1.) The percentage of working-age women who were uninsured increased from 14.3 in 1988 to 17.4 in 2008, a difference of 3.1 percentage points. For men, the increase in uninsurance was larger; from 17.6 percent in 1988 to 22.0 percent in 2008, a difference of 4.4 percentage points. ESI employee coverage rose slightly for women, while it fell substantially for men. In a similar pattern, women were slightly less likely to have ESI dependent coverage in 2008 than in 1988 (25.0 percent vs. 28.9 percent), whereas men were more likely to have dependent coverage in 2008 than in 1988 (13.0 percent vs. 8.8 percent). Public health insurance coverage rates increased for both women and men, with larger increases for men (from 3.4 percent in 1988 to 6.8 percent in 2008) than for women (from 7.2 percent to 9.9 percent).
Changes in Insurance Coverage, Family Structure, and Employment for Working-age Women and Men, 1988 and 2008.

Source: Current Population Survey.
For both women and men, the percentages of the population in the categories of “married parent” and “married, no children” decreased, whereas the percentages in the categories of “never married, no children” and “divorced, no children” increased somewhat. Men’s primary activity or employment status also changed; the percentage of men neither in school nor working increased, and the percentage working full-time decreased (from 61.7 percent to 57.4 percent). In contrast, the percentage of women working full-time year-round increased (from 37.4 percent to 40.2 percent).
Women’s health insurance coverage for 1988 and 2008 by family type is presented in Figure 1; men’s coverage patterns are shown in Figure 2. Several patterns are notable. First, for both women and men, married individuals were less likely to be uninsured than individuals in other family structures in both years. Second, ESI dependent coverage became more common for married men and less common for married women between 1988 and 2008. Third, ESI employee coverage rates vary more by family structure for women than for men. For men, ESI employee coverage was the most common form of insurance coverage in both 1988 and 2008 for all family types except never married with children. For women, ESI employee coverage was the modal form of coverage for divorced women and never-married women without children in both years and for married women without children in 2008. For married mothers, the modal insurance was ESI dependent coverage in both 1988 and 2008. Finally, the share of single mothers with public insurance coverage declined from 1988 to 2008.
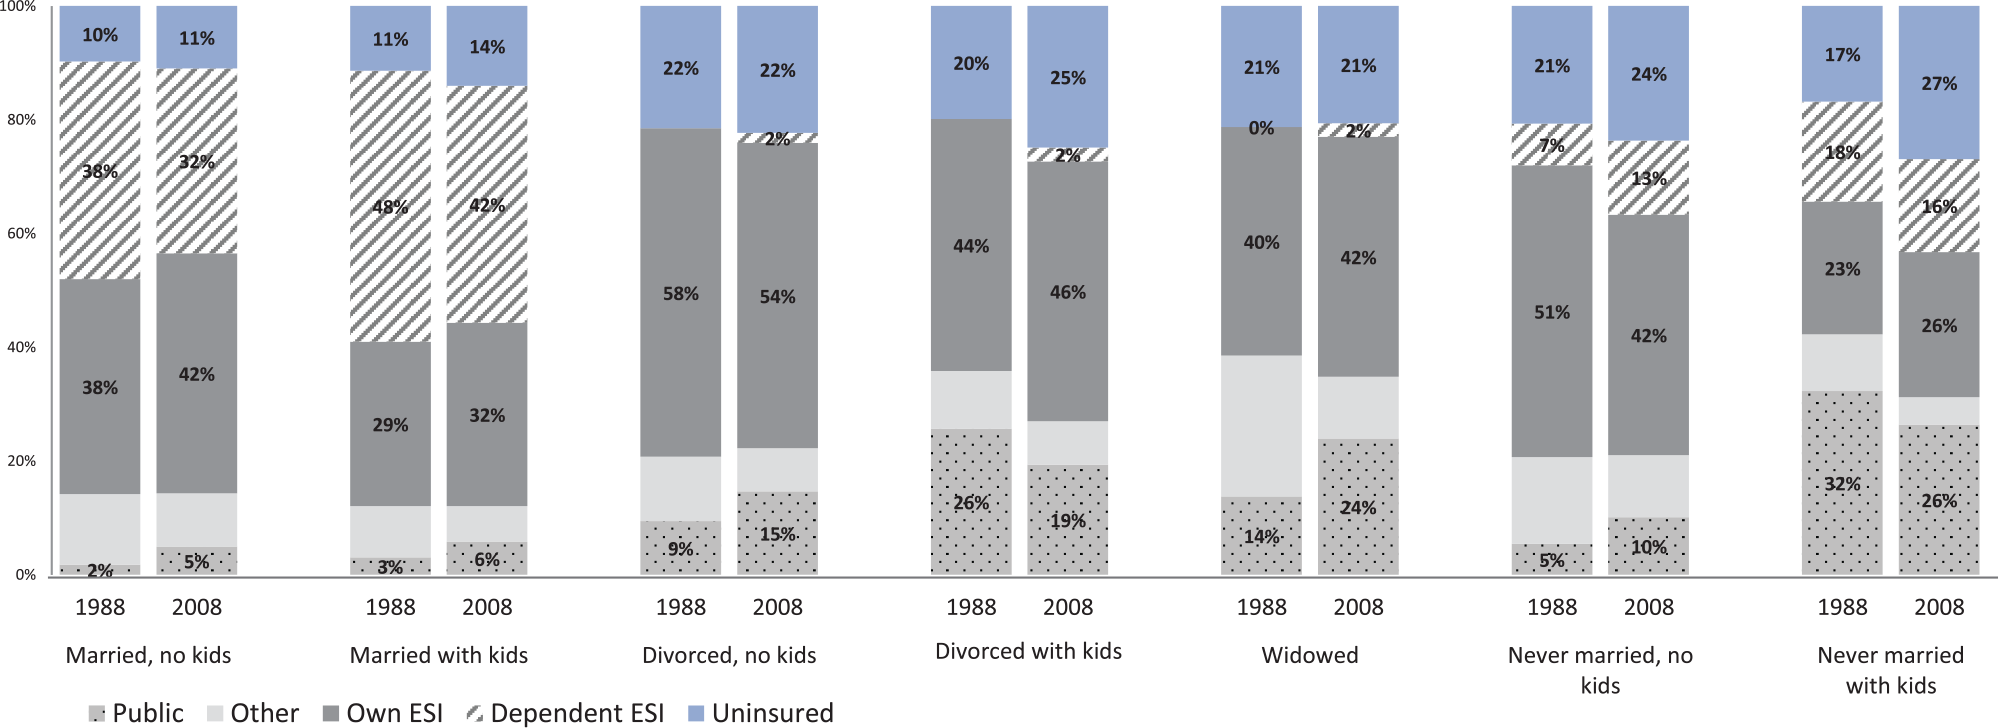
Women’s health insurance type by family structure and year.

Men’s health insurance type by family structure and year.
Decomposition Model Results
I turn to decomposition methods to (1) show associations between family structure and insurance, net of other characteristics; (2) examine the role of changes in employment; and (3) estimate how much of the change in coverage rates is attributable to changes in family characteristics. In the presentation of results, I first present the coefficients from the OLS models predicting ESI employee and ESI dependent coverage. I then present results from the Oaxaca-Blinder decompositions that are based on these OLS regressions. Finally, I present results from OLS models predicting the uninsurance rate and the corresponding Oaxaca-Blinder decomposition. (The tables include coefficients for employment and family structure variables; the full results are available from the author).
Panel A in Table 2 shows results from OLS models predicting ESI employee coverage for women and men. Comparing the intercepts across time periods, we can see that the percentage of men with the reference characteristics (non-Hispanic white with a high school degree, married with children, and working full-time, year-round in the private sector) predicted to have ESI employee coverage fell dramatically between 1988 and 2008 (from 82.0 percent to 66.5 percent), while it decreased more modestly for women from 60.0 percent to 53.5 percent. For both women and men and in both years, the variables most predictive of ESI employee coverage are primary activity and employment sector, with full-time workers (especially those in the public sector) having much higher rates of ESI employee coverage than part-time workers.
Coefficients from Ordinary Least Squares Models Predicting Employer-sponsored Insurance Employee Coverage and Dependent Coverage (Models Run Separately by Year and Gender).

Note: Additional variables included in the models are indicators of age, race/ethnicity, education, and state of residence. ESI = employer-sponsored insurance; FTYR = full-time, year-round; PT = part-time.
p < .05.
Family characteristics were highly predictive of ESI employee coverage for women but were less predictive of coverage for men. In both 2008 and 1988, married women with children had the lowest rates of ESI employee coverage, whereas divorced women with no children had the highest rates; the difference between these groups was large, at 16.2 percentage points in 2008 and 18.9 percentage points in 1988. In comparison, the difference in coverage rates between a woman with a high school degree and a woman with a college degree was 12 percentage points in 2008 and 9 percentage points in 1988. The regression results for men show that in 1988, married men with children had a higher rate of ESI employee coverage than divorced men without children and never married men. In 2008, married men with children had a slightly lower rate of ESI employee coverage than all other groups except never married men. Thus, even though men’s family characteristics are less predictive of their ESI employee coverage than women’s family characteristics, I find considerable change over time in the associations between men’s family characteristics and ESI employee coverage.
Panel A in Table 3 shows results from the decomposition of ESI employee coverage. For women, there was little overall change in the ESI employee coverage rate between 1988 and 2008: a 1 percentage point increase. The decomposition results suggest that greater ESI employee coverage rates can be partially accounted for by increases in women’s full-time employment, increases in the percentage with college education, and decreases in the percentage of women who were married mothers. Notably, the returns to employment changed somewhat; that is, the coefficients associated with full-time and part-time work changed across years. Unexplained changes—changes that are not accounted for by my model and are represented by the change in the intercept—decreased ESI employee coverage rates for women by more than 6 percentage points.
Selected Results from Oaxaca-Blinder Decomposition Models.
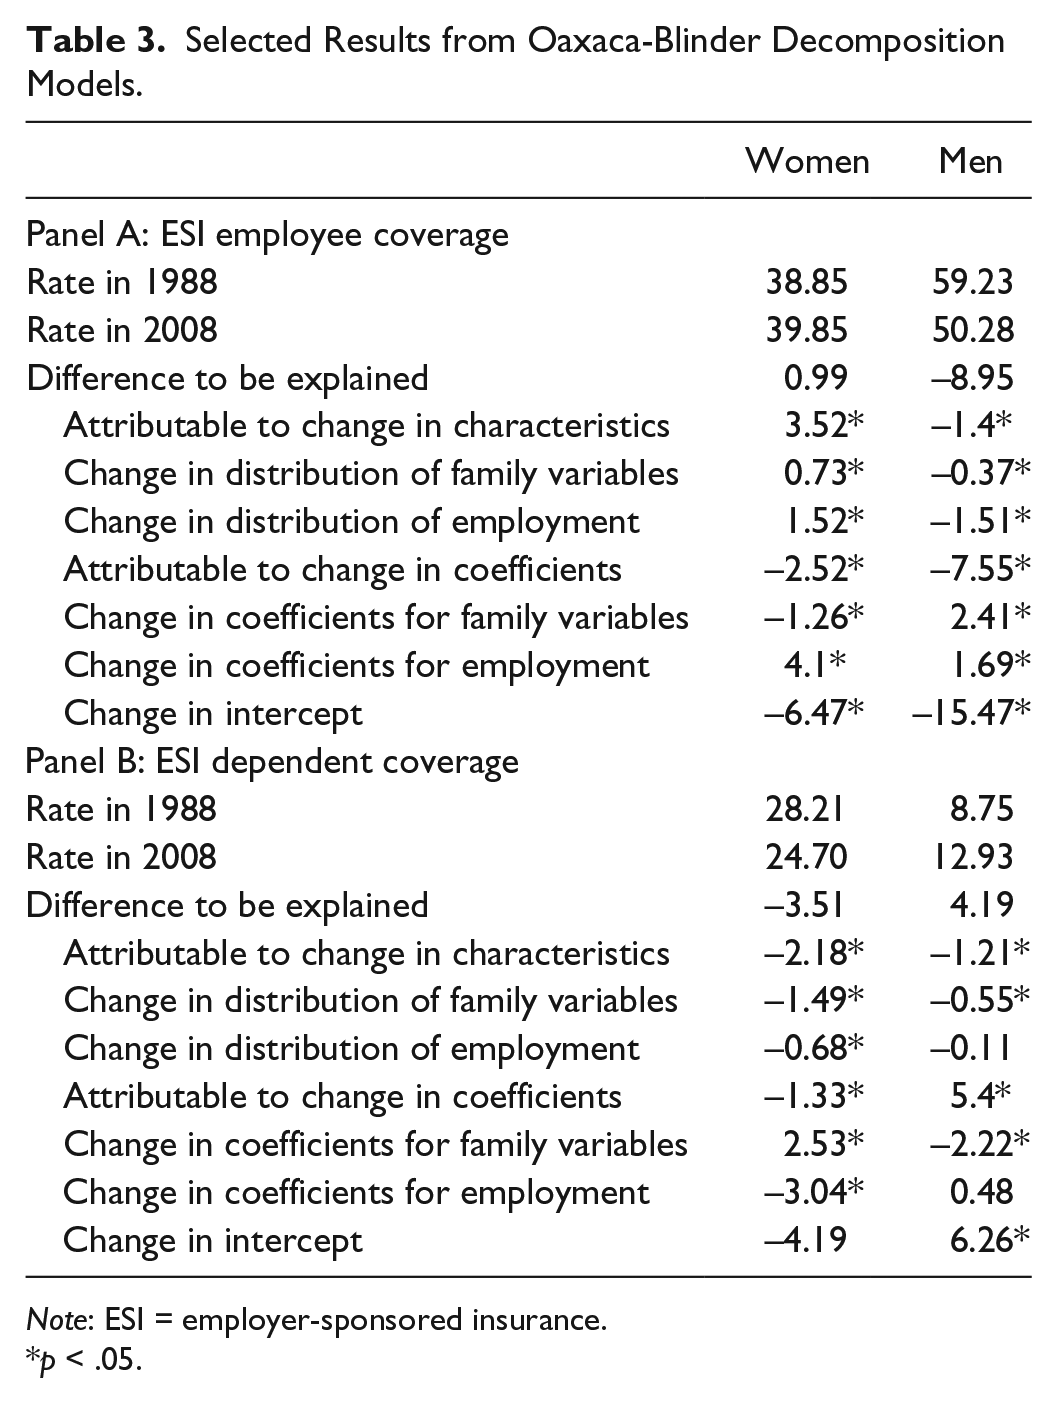
Note: ESI = employer-sponsored insurance.
p < .05.
In contrast to the relatively small overall change in the ESI employee coverage rate for women between 1988 and 2008, men experienced a large decrease in ESI employee coverage rates (9 percentage points). Changes in men’s characteristics account for only a small fraction of the change (1.4 of 9.0 percentage points); most of the decrease was due to unexplained changes, likely related to the secular trends of decreased employer offers of ESI and increased premium costs. Notably, the shift in men’s family characteristics accounted for a small share of the change in ESI employee coverage (.4 percentage points).
Turning to ESI dependent coverage, the regression models show that family characteristics are highly predictive for both women and men (see Panel B in Table 2). For women in both periods, the group most likely to have dependent coverage was married mothers. Panel B in Table 3 shows that ESI dependent coverage for women fell by 3.5 percentage points between 1988 and 2008, 1.5 percentage points of which is accounted for by changes in family characteristics (i.e., decreases in the share of married women). Additionally, the coefficients for family variables changed substantially, reflecting the decreased reliance of married women on their husbands’ ESI coverage.
For men, ESI dependent coverage increased by 4.2 percentage points between 1988 and 2008. Married men had higher rates of ESI dependent coverage than other men in both time periods, and there was no difference in ESI dependent coverage among married men by their parental status. Changes in men’s family characteristics account for a decline of 0.6 percentage points in ESI dependent coverage between 1988 and 2008. For men, the coefficients associated with family characteristics and the intercept changed in the opposite way that they did for women; whereas married women were less likely to have ESI dependent coverage in 2008 than they were in 1988, married men were more likely to have dependent coverage in 2008 than in 1988. Additionally, the difference in ESI dependent coverage between married men and divorced men increased between 1988 and 2008.
In the last part of the analysis, I examine how uninsurance rates changed. Regression models that predict being uninsured show that family characteristics are associated with being uninsured for both women and men and in both time periods (see Table 4). Controlling for other characteristics, compared with individuals who were married with children (the reference group), individuals in other family structures were more likely to be uninsured in both time periods. In 2008, all else equal, the difference in the percentage uninsured between married mothers and divorced mothers was 9.3 percentage points; for men, the difference between married and divorced fathers was 8.8 percentage points. Net of other characteristics, differences in uninsurance between married parents and never married childless individuals did not change much between 1988 and 2008 for either women or men, but the difference in uninsurance between never married parents and married parents increased substantially.
Coefficients from Ordinary Least Squares Models Predicting the Uninsurance Rate (Models Run Separately by Year and Gender).

Note: Additional variables included in the models are indicators of age, race/ethnicity, education, and state of residence. FTYR = full-time, year round; PT = part-time.
p < .05.
Supplementary analyses (available upon request) show that the increases in public health insurance rates for women and men were not responding to changes in family structure. On the contrary, increases in the share of single mothers in the population were coupled with declines in public insurance coverage for these types of families.
Table 5 shows that women’s uninsurance rate increased by 3.2 percentage points between 1988 and 2008. Absent other changes, the aging and increasing educational attainment of the population would be expected to decrease the percentage uninsured by .4 percentage points between 1988 and 2008. These changes, however, were slightly offset by changes in family characteristics; the percentage of women who were divorced or single mothers increased, and these characteristics are associated with slightly higher rates of uninsurance. Notably, the coefficients associated with family structure did not change much for women.
Results from Oaxaca-Blinder Decompositions of the Uninsurance Rate.

p < .05.
For men, a decrease in the share of the population that was married likely increased the uninsurance rate, but marital changes contributed only minimally to the overall increase in uninsurance. Most of the increase in uninsurance was likely attributable to the decline of employer offers of ESI coverage. Of note, the family structure coefficients changed for men across years whereas they did not change much for women.
In summary, I find that changes in marriage were associated with higher rates of uninsurance and lower rates of ESI dependent coverage for both women and men; however, the share of uninsurance that can be explained by changes in marital status is relatively small. Women’s increased employment was associated with lower uninsurance and higher ESI employee coverage rates. Finally, the share of married women with ESI dependent coverage decreased whereas the share of married men with such coverage increased.
Discussion
Married adults have higher insurance coverage rates than individuals with other marital statuses, partially because married adults have the potential for coverage through their spouses’ ESI plans. I find that population shifts between 1988 and 2008 away from marriage contributed to higher uninsurance rates, especially for men. This finding largely reflects changes in the dynamics of ESI coverage. For women, declines in marriage were accompanied by an increase in full-time employment, which is associated with greater access to ESI employee coverage. Women continue to have higher rates of ESI dependent coverage than men, but increases over time in women’s education and employment may have resulted in more employer offers of ESI employee coverage and more opportunities for their husbands to be covered as dependents. For men, there were no offsetting factors to counteract their lost opportunities for health insurance coverage as dependents under their spouses’ employer-sponsored plans. Thus, the combination of changes in employment and marriage against the backdrop of changing employer offers of health insurance resulted in opposite trends for women and men regarding ESI coverage: between 1988 and 2008, the share of women with ESI employee coverage increased and the share with ESI dependent coverage decreased, whereas the share of men with ESI employee coverage decreased and the share with ESI dependent coverage increased.
The analyses presented in this article are decompositions, one way of estimating counterfactual scenarios. The analyses are at the population level and do not purport to show how an individual’s access to insurance changes as they change marital status. Rather, my analyses present an estimate of what insurance coverage rates might have been in 2008 if population-level marriage and employment patterns had not changed from 1988 to 2008.
This analysis makes several contributions to the literature. First, I find that changes in marriage rates likely affected men’s access to a valued resource, not just women’s access. Previous analyses of health insurance coverage find bigger impacts of divorce on women’s coverage than men’s coverage (Peters et al. 2014; Zimmer 2007), but the impact of not marrying may be different from that of divorcing. For health insurance coverage, men may have been more disadvantaged than women by the shift away from marriage. This finding of a greater negative impact of population-level family structure changes on health insurance coverage for men than for women is in sharp contrast to findings in other domains, such as poverty (McLanahan and Kelly 1999).
Second, I find that a larger share of married men had ESI dependent coverage in 2008 than in 1988, whereas a decreased share of women had such coverage. The increase in men’s dependency on their wives for health insurance has been largely overlooked, partially because many scholars errantly assume that marriage matters only for women’s access to resources. My findings suggest that we may be greatly underestimating employed wives’ contributions to family resources by excluding health insurance from our calculations.
If the ACA of 2010 were fully implemented, the percentage of adults without health insurance would decrease substantially. The 2016 elections cast doubt about whether Medicaid expansions will be retained and about the functioning of the individual private insurance market. Regardless of the future of the ACA, ESI is expected to remain the primary source of health insurance for U.S. adults (Buchmueller and Monheit 2009). Among insured individuals, differences in the types and costs of insurance coverage are likely to remain large, with ESI coverage being the lowest cost for most individuals and families. How ESI coverage will differ by the intersection of family type and gender is partially dependent on future changes in women’s and men’s employment and family characteristics.
Footnotes
Appendix
Descriptive Statistics for Demographic Characteristics of Working-age Women and Men by Year.
| Women |
Men |
|||
|---|---|---|---|---|
| 1988 |
2008 |
1988 |
2008 |
|
| (n = 41,620) | (n = 61,213) | (n = 40,353) | (n = 57,432) | |
| Age (years) | ||||
| 19-24 | 16.9 | 13.7 | 17.3 | 14.4 |
| 25-29 | 11.5 | 8.6 | 11.3 | 8.4 |
| 30-39 | 28.1 | 23.5 | 28.4 | 22.7 |
| 40-49 | 20.6 | 26.0 | 20.8 | 25.6 |
| 50-59 | 13.7 | 19.1 | 13.5 | 19.6 |
| 60-64 | 9.3 | 9.1 | 8.7 | 9.2 |
| Education | ||||
| Less than high school | 17.4 | 10.7 | 18.0 | 12.4 |
| High school | 43.3 | 27.9 | 38.2 | 31.3 |
| Some college | 20.8 | 31.7 | 20.4 | 28.1 |
| College or more | 18.5 | 29.7 | 23.4 | 28.2 |
| Race/ethnicity | ||||
| White, non-Hispanic | 76.2 | 63.3 | 78.2 | 65.1 |
| Black, non-Hispanic | 9.8 | 11.9 | 7.9 | 9.9 |
| Hispanic | 6.4 | 16.2 | 6.5 | 16.8 |
| Other | 7.6 | 8.6 | 7.5 | 8.2 |
| Primary activity and employment sector | ||||
| Not in school or working | 25.9 | 24.9 | 8.5 | 12.2 |
| Working FTYR, private sector | 27.9 | 30.2 | 45.6 | 44.9 |
| Working FTYR, public sector | 7.8 | 8.5 | 10.5 | 9.0 |
| Working FTYR, self-employed | 1.7 | 1.5 | 5.6 | 3.5 |
| Working part-time, private sector | 23.6 | 22.9 | 18.8 | 21.1 |
| Working part-time, public sector | 5.0 | 5.1 | 2.5 | 2.2 |
| Working part-time, self-employed | 2.6 | 2.3 | 3.1 | 2.9 |
| In school | 5.6 | 4.5 | 5.4 | 4.1 |
Source: Current Population Survey.
Note: FTYR = full-time, year round.
Acknowledgements
I gratefully acknowledge advice from Margot Jackson, Rachel Kimbro, Gregory Acs, and scholars and faculty members affiliated with the Robert Wood Johnson Scholars in Health Policy Program.
Funding
The author(s) disclosed receipt of the following financial support for the research, authorship, and/or publication of this article: This research was supported by the Robert Wood Johnson Scholars in Health Policy Program and the Institute for Policy Research at Northwestern University.
1
Even when employers offer coverage for unmarried partners, it is not as valuable as coverage for spouses, because coverage for unmarried partners is taxable, whereas employees are not taxed on their employers’ contributions toward health insurance coverage for themselves and specified family members (including spouses). This tax exemption lowers the effective price of insurance by more than 30 percent (![]() ).
).
2
Through the Consolidated Omnibus Budget Reconciliation Act, newly divorced adults can maintain dependent coverage for a short time period at a high cost.