
Abstract
Status characteristics theory provides a theoretical explanation for why social status promotes social influence in collectively oriented task groups. It argues that status differences produce differences in expectation states, which are anticipations of task-related contributions. Those with an expectation advantage are more influential, contribute more often to group discussions, and so on. The authors conducted the first experimental test of status characteristics theory while participants were in a magnetic resonance imaging machine. This permitted the measurement of neural activity in brain regions found to be associated with processing social status. The results indicate that neural activity does not explain the effect of status on behavior.
Theories of interpersonal influence suggest that influence results from a variety of social factors. In particular, there are research programs examining the effects of the distribution of opinions in a group (Crano and Prislin 2006; Latane 1981), the flows of communication within a group (Friedkin and Johnsen 2011; Kalkhoff, Friedkin, and Johnsen 2010), and the effect of status differentiation and generalization (Berger et al. 1977; Berger, Wagner, and Webster 2014) on social influence. At present, we focus on status generalization and social influence and the underlying mechanism linking those factors.
Status characteristics theory (SCT; Berger et al. 1977) describes a process whereby status differences promote differences in expectation states or anticipations of task-relevant contributions. In turn, expectation states create a self-fulfilling prophecy (Meeker 1981) whereby those who are higher in status are more influential, participate more often, are given more opportunities to participate, and are given more positive feedback for their contributions. The key to the theory, therefore, is expectation states: the mechanism linking status differences to behavioral outcomes, such as social influence. This is an important sociological theory because it explains how macrolevel inequalities, such as those associated with race, class, and sex, are reproduced and perpetuated in small-group interactions.
Despite a vibrant theoretical research program (for reviews, see Berger, Rosenholtz, and Zelditch 1980; Berger et al. 2014), few studies (e.g., Correll, Benard, and Paik 2007; Driskell and Mullen 1990) have actually tested whether expectation states explain the relationship between status differences and behavioral outcomes, such as social influence. Here we test whether neural activity captures the mechanism of SCT in a modified version of the standard setting that is used to test SCT. For reasons explicated below, we modified the setting only as much as needed to conduct the experiment in a magnetic resonance imaging (MRI) machine. Thus, to measure expectation states, we use neural measures. We also report how the neural measures are related to the standard questionnaire items identified in the literature. Below we review SCT in more detail, including a review of the explicit tests of the mediating role of expectation states. On the basis of the logic of the theory, we identify specific hypotheses that we evaluate with the MRI experiment. Before presenting the experiment, we also review the social neuroscience literature on status processes. We then present the result of the experiment and discuss the implications of our findings.
Theoretical Background
SCT
SCT is a relational theory that explains “power and prestige behaviors” (e.g., social influence, participation rates, evaluations of participation) as a function of status (Berger et al. 1977, 2014). The theory argues that in collectively oriented task groups, any status characteristic that differentiates the group members will become salient and affect performance expectation states. As mentioned above, these expectations create a self-fulfilling prophecy whereby higher status members are more influential, contribute more, and so on.
One consequence of the self-fulfilling prophecies described above is status generalization. Status generalization occurs when important features of an interaction (e.g., the distribution of influence or participation) are in part determined by interactants’ relative status, regardless of the actual relevance of the status differences for the goals of the interaction (Webster and Driskell 1978). For example, status generalization may occur when men are picked as jury forepersons (Strodtbeck and Mann 1956) or when whites participate more than minorities in group exercises in school settings (Cohen and Lotan 1995). In these examples, sex and race, respectively, shape the interaction order. SCT distinguishes two types of status characteristics: specific and diffuse. Specific status characteristics are differentially evaluated and carry specific expectations for performance. For example, computer literacy is a specific status characteristic because it is better to be good with computers than bad with computers, and those who are good with computers are presumed competent at computer-related tasks. Diffuse status characteristics satisfy the same criteria as specific ones but also carry with them general expectations for performance. For example, research suggests that sex is a diffuse status characteristic because male is the culturally preferred state, there are specific performance expectations associated with being male or female (e.g., men have more mechanical ability and women are better at sewing), and there are also general expectations associated with sex such that men are presumed to be competent in general (Rashotte and Webster 2005; Ridgeway 2011; Wagner, Ford, and Ford 1986).
A set of five interconnected assumptions link status differences to behavioral outcomes in collectively oriented task groups: (1) Status characteristics that differentiate interactants become salient. (2) Whether relevant to the task or not, salient status characteristics are assumed to be relevant in the situation. That is, the burden of proof rests with someone to disassociate salient status characteristics from the group’s task. (3) The process outlined in (1) and (2) persists as long as those individuals remain in the situation. This is true for all possible dyadic pairs in the group (Fişek, Berger, and Norman 1991). (4) Positive and negative status information is aggregated into a relative, composite expectation state value (Berger et al. 1992). (5) Position in the group’s power and prestige hierarchy is direct function of the expectation advantage one person has over another. 1
The clear logic and interconnected assumptions of SCT make it straightforward to derive the prediction that status characteristics are positively related to social influence. The logic of the theory also makes clear that the mechanism linking status to influence is expectation states. The basic logic of the theory is visually depicted in Figure 1. The figure illustrates the logic between the theoretical concepts and how those concepts are operationalized.

Logic of status characteristics theory. Theoretical concepts are denoted by ellipses, and their empirical indicators are denoted by rectangles.
Testing the mechanisms underlying a theoretical argument is among the most challenging and useful aspects of social science research (Hedström and Swedberg 1998). Toward this end, surprisingly few empirical studies have explicitly examined whether expectation states mediate the effect of status on behavioral outcomes. Zeller and Warnecke (1973) explicitly constructed and validated a scale for measuring performance expectations. 2 Drawing on this development, Webster and Driskell (1978) found that the correlation between the Zeller-Warnecke measure and manipulated status was “quite high” (p. 232), including for diffuse as well as specific status characteristics. The measure also correlated highly with the outcome, influence behavior. However, Webster and Driskell stopped short of formally testing mediation.
The first to acknowledge this gap in the literature, Driskell and Mullen (1990) conducted a meta-analysis to directly examine the mechanism linking status to behavior in SCT. Specifically, Driskell and Mullen pooled the results from seven studies that reported pairwise correlations between status, a measure of expectations, and behaviors (social influence). As predicted by SCT, they found that controlling for expectations reduced the correlation between status and behaviors by a significant margin (i.e., status explained only 1 percent of the variance in behaviors when expectations were included in the model). Although this was not a formal analysis of mediation, the results are entirely consistent with anticipated mediation results.
Foddy and Smithson (1999) tested whether estimates of ability (expectations for performance) mediated the effects of sex and a specific ability on social influence. They found a significant reduction in the effects, but main effects of the status manipulations were still significant once the expectations measure was included. This constitutes partial support for the mediation prediction of SCT. Although not explicitly testing SCT, Correll et al. (2007) similarly found a significant reduction in the effect of motherhood status on workplace evaluations (e.g., recommendations for starting salaries) when controlling for competence (and commitment). Here too, though, there remained a significant main effect.
Taken together, the aforementioned studies are supportive of the basic logic of SCT. More to the point, they are all consistent with the idea that performance expectations mediate the effect of status on behavior, at least partially. The fact remains that expectation states are an unobservable cognitive mechanism. That is, they are not directly observable in the same way as some behavior. However, recent research in social neuroscience suggests that expectation states may be measurable as neural activity in the brain.
The Social Neuroscience of Status
Within sociological social psychology there is a clear distinction between consensual status beliefs and dominance. Both status generalization and dominance result in hierarchies, but status hierarchies are a consensual, collective product of the group, while dominance hierarchies reflect aggregate results of dyadic competitions (Ridgeway and Diekema 1989). Unfortunately, the social neuroscience literature treats status in a naive fashion, not distinguishing between consensual and conflictual hierarchies. As a result, it is unclear whether studies in this area are relevant to consensual status hierarchies. That is an open question that will be addressed with the present MRI experiment. We do review this literature here because it identifies particular brain regions that may be of relevance to the processing of status information.
The social neuroscience literature has identified regions of interest (ROIs) for processing status in the brain (for a review, see Melamed and Abromaviciute 2013). ROIs are identified on the basis of “blood oxygenation–level dependent” (BOLD) responses, or measures of blood flow in the brain. When neurons are active, there is an increased amount of cerebral blood flow to that brain region, and this is measured using functional MRI (fMRI). Because ROIs related to status have already been identified in the literature, we explore them as measuring expectation states.
In an fMRI study, Zink et al. (2008) manipulated a specific social status between participants and (simulated) others (i.e., on the basis of their ostensive ability at the task, participants were ranked as being one-, two-, or three-star players). Participants played a repeated-trials game in which they interacted either with high- or low-status others in each trial. However, because Zink et al. were concerned that hierarchical information, in and of itself, could drive results, they ended up conducting two separate studies, one in which participants were told that they were interacting with real partners (study 1) and another in which participants were told that the partners were simulated (study 2). This allowed Zink et al. to test whether increased neural activity is a function of social hierarchy, not simply a function of any kind of hierarchical setting. Several activations distinguished the social experiment from the nonsocial one. When participants viewed “real” high-status others, activity increased in the dorsolateral prefrontal cortex (DLPFC), amygdala, thalamus, posterior cingulate, and medial prefrontal cortex. These activations did not occur in the nonsocial experiment. Also, in both studies, there were no significant increases in activity when participants viewed the low status other. Zink et al. concluded, “Our results identify neural mechanisms that may mediate the enormous influence of social status on human behavior” (p. 273). Thus we consider the ROIs identified by Zink et al. as a priori neural correlates of expectation states, and we explicitly test this prediction.
In another relevant study, Chiao et al. (2009) scanned reserve officers from the Navy while they assessed the rank of members of the Navy and the rank of Toyota cars. The insignias of the Navy reserve officers training corps were used to signal status, and Toyota cars were used as “familiar cultural objects” (p. 355). Participants were asked to determine whether the pictures they were shown depicted someone or something that was higher or lower than the average (i.e., a naval captain or a Toyota Camry). They found significant differences in the fusiform gyrus, intraparietal sulcus (IPS; see also Mason, Magee, and Fiske 2014), the inferior frontal gyrus, and the middle frontal gyrus. Interestingly, comparisons of cars resulted in greater activity in the left IPS, while comparisons of military rank resulted in greater activity in the right IPS.
There are some obvious and important differences between these social neuroscience studies and prior tests of SCT. In the study by Zink et al. (2008), participants were not collectively oriented. In the study by Chiao et al. (2009), participants were neither task nor collectively oriented, and they were not even working with real or simulated others. However, both studies manipulated the status of others (or objects) and asked participants to process those stimuli while neural responses were measured. So, we take the ROIs identified above as a starting place, with the caveat that not all of them may be relevant given our initial conditions. We are interested in consensual status hierarchies in which people work together to solve a unitary task. As explained, these conditions were not fully met in either of the two most relevant social neuroscience studies.
Method
We examined SCT predictions in a variant of the standardized experimental setting for testing the theory (see Berger 2007). The setting requires that three conditions or requirements be met: (1) participants are prevented from meeting their partners (or partners are simulated) so that status can be experimentally manipulated, (2) standardized instructions are used to ensure that the initial conditions of the theory are met, and (3) a standardized measure of social influence is used. Our setting met these conditions while modifying one key aspect of the design to facilitate the use of fMRI. Specifically, we implemented a within-subjects rather than between-subjects design to increase the reliability of the neural measures (Sutton et al. 2008).
Participants in our study came to two sessions. In the first session, they filled out paperwork, were told what to wear and what to expect on the day of the scan, and went into a mock scanner to be sure that they were comfortable in the confined space. The second session consisted of three parts. First, in an isolated room, participants read the instructions and received the status manipulation. Second, participants went into the MRI machine. This entailed a structural brain scan followed by 60 trials of a standard social influence task (described in detail below). Participants were told that there were a total of four subjects at different scanners throughout campus and that they would work with each of them over the Internet for 20 of the 60 trials. 3 The scanner took a functional scan every two seconds while participants completed the social influence task. Finally, participants returned to the isolated subject room, completed a poststudy questionnaire, answered manipulation check items, and were debriefed.
A total of 31 college-age women were scanned. We scanned only women to reduce sources of variability (Calder, Phillips, and Tybout 1981). Two of the participants were excluded for not believing that the task was real. Another participant was excluded because of a scanner malfunction. Thus our results are based on the remaining 28 participants. Although this seems low compared with sociological standards, Chiao et al.’s (2009) MRI experiment had 12 participants, and Zink et al.’s (2008) MRI study had 24 participants per experiment. The vast amount of data that are collected over the course of the study (BOLD responses along x, y, and z coordinates every two seconds) coupled with a within-subject design yields ample power to test for neurological differences.
General Procedures
Upon arriving at the MRI laboratory, participants were escorted by a research assistant to an isolated room where they were informed that they would be working with three others over a computer network on a two-phase experiment. Participants were told that they would be working on an individual task in the first phase and that they would then enter an MRI machine and work over a computer network with partners on a collective task. In reality participants never worked with partners; the computer program simulated the behavior of fictitious partners to create a standardized set of opportunities for influence (see below).
After the initial introduction, the remainder of the session was computer mediated. Instructions appeared on the participants’ computer screens and addressed important aspects of the experiment. The instructions described the team portion of the experiment as a “critical choice” situation in which taking others’ opinions into consideration leads to an increased likelihood of making a correct decision. The goal of this description is to increase participants’ collective orientation.
The instructions also introduced the ability and task for the experiment. Although not a real ability, the instructions described “contrast sensitivity” as a relatively new perceptual ability that is independent of other abilities, such as mathematical acumen or verbal skills. The instructions then stated that the team task would involve examining two rectangular images, each composed of smaller black and white areas, where the objective is to select the image containing the greater amount of white area. Participants were told that “the difference in the amount of white area is sometimes quite small,” and that they will therefore “probably find that some of the pictures are very difficult to judge.” Although the amount of black and white area for each set of images is actually the same (and thus there are no correct answers), the contrast sensitivity test is well suited to experimental studies of social influence because states of the (supposed) task ability can be manipulated, and participants are easily led to believe that there is a correct answer to each problem (Moore 1968; Webster and Rashotte 2010). 4
After reading the instructions, participants moved on to phase 1 of the experiment, which consisted of a practice trial (with on-screen instructions) followed by 20 trials of contrast sensitivity problems. For this phase, each trial entailed selecting whether a single image contained more white or black area. Participants had 10 seconds to make a selection, and then they were prompted for their response. After phase 1, status was manipulated by telling participants the scores from the phase 1 test (see below). To later ensure that the status manipulation was perceived as intended, participants were asked to write down their scores and the partners’ scores on a “participant information sheet.” The participants and their partners were assigned letters so that they would be able to identify each other on the basis of their ability while in the MRI. Upon completion of this part of the study, the research assistant returned to the participant’s room, answered all questions that remained, and escorted the participant to the scanner.
Once participants were situated in the MRI scanner, visual stimuli were displayed on a rear projection screen. Participants viewed the stimulus at a distance of 70 cm through a mirror mounted at the top of the head coil. The first five minutes in the MRI scanner entailed a structural scan. Then participants completed 60 trials of the social influence task. These were broken into three 20-trial blocks to minimize scanner drift. Every trial was exactly 30 seconds. At the start of each trial, the program displayed the letter of the person with whom the participant would (supposedly) interact for exactly 4 seconds. Then the program displayed two contrast sensitivity images, and participants were asked whether the top or bottom image contained more white area. As it is important to minimize head movement in an MRI scanner, participants used joysticks to make their selections. The joystick in the left hand corresponded to “top,” and the one in the right hand corresponded to “bottom.” Participants had 10 seconds to make their initial decision. Then, for 6 seconds the program showed participants the partner’s initial choice. Finally, participants were given 10 more seconds to make a final decision about which image contained the most white area. These timing constraints were imposed because the MRI scanner took a functional scan exactly every two seconds. This enables us to link the MRI data with the behavioral responses.
After the participant completed the 60 contrast sensitivity problems, the research assistant escorted the participant back to the isolated participant room to complete a poststudy questionnaire. As described in more detail later, the questionnaire consisted of manipulation check items and items to measure expectation states. Finally, the research assistant interviewed each participant to assess her task and collective orientation. All participants were given copies of their scans and paid $50 for their time and effort.
Manipulations
The key manipulation was the relative status of the others with whom the participant interacted. The participant was told that she scored 14 out of 20. She was also told that the other three participants scored 7, 13, and 19 out of 20, corresponding to low, medium/equal, and high status, respectively. Participants were told that while they were in the MRI scanner, all four participants would be randomly paired up and asked to complete the team contrast sensitivity task. In reality, the order of alters was randomized within replications for 20 replications, meaning that the participant interacted with each of the three others in random order, and this was repeated 20 times. The order was randomized once at the programming stage, so every participant had the same experience. Out of the 20 times that the participant interacted with each of the others, the other agreed with the participant’s initial opinion on 5 randomly selected trials. Thus there are 15 disagreement trials for each of the others. The disagreement trials are the “critical trials” that permit social influence, which we operationalize as changing an initial opinion on the basis of conflicting feedback from the partner with whom the participant is interacting on a given trial.
Measures
The main outcome in this study is a behavioral indicator of social influence. On each disagreement trial in phase 2, the other group member disagreed with the participant’s initial opinion. If the participant stayed with her initial opinion, then she rejected this attempt at social influence. If the participant deferred to the other, then she was influenced. We model the logit of the proportion of stay responses, P(S), for each other, so there are three observations (i.e., three P[S] outcomes) nested in each participant (on using the logit transformation, see Balkwell 1991). 5 Analyzing the data at the participant level instead of the participant-trial level increases the precision of the MRI estimates.
The poststudy questionnaire included several items to measure the expectation states of the others. We used the seven most reliable items from Zeller and Warnecke’s (1973) expectations scale (see Table 1 for the items). We also asked participants to rate the three partners in terms of their reading ability, abstract abilities, and their grade point average (Rashotte and Webster 2005). Finally, we also asked participants to evaluate the three others in terms of their general business ability and work ability (Thye 2000).
Summary of a Factor Analysis of Questionnaire Items and Regions of Interest.
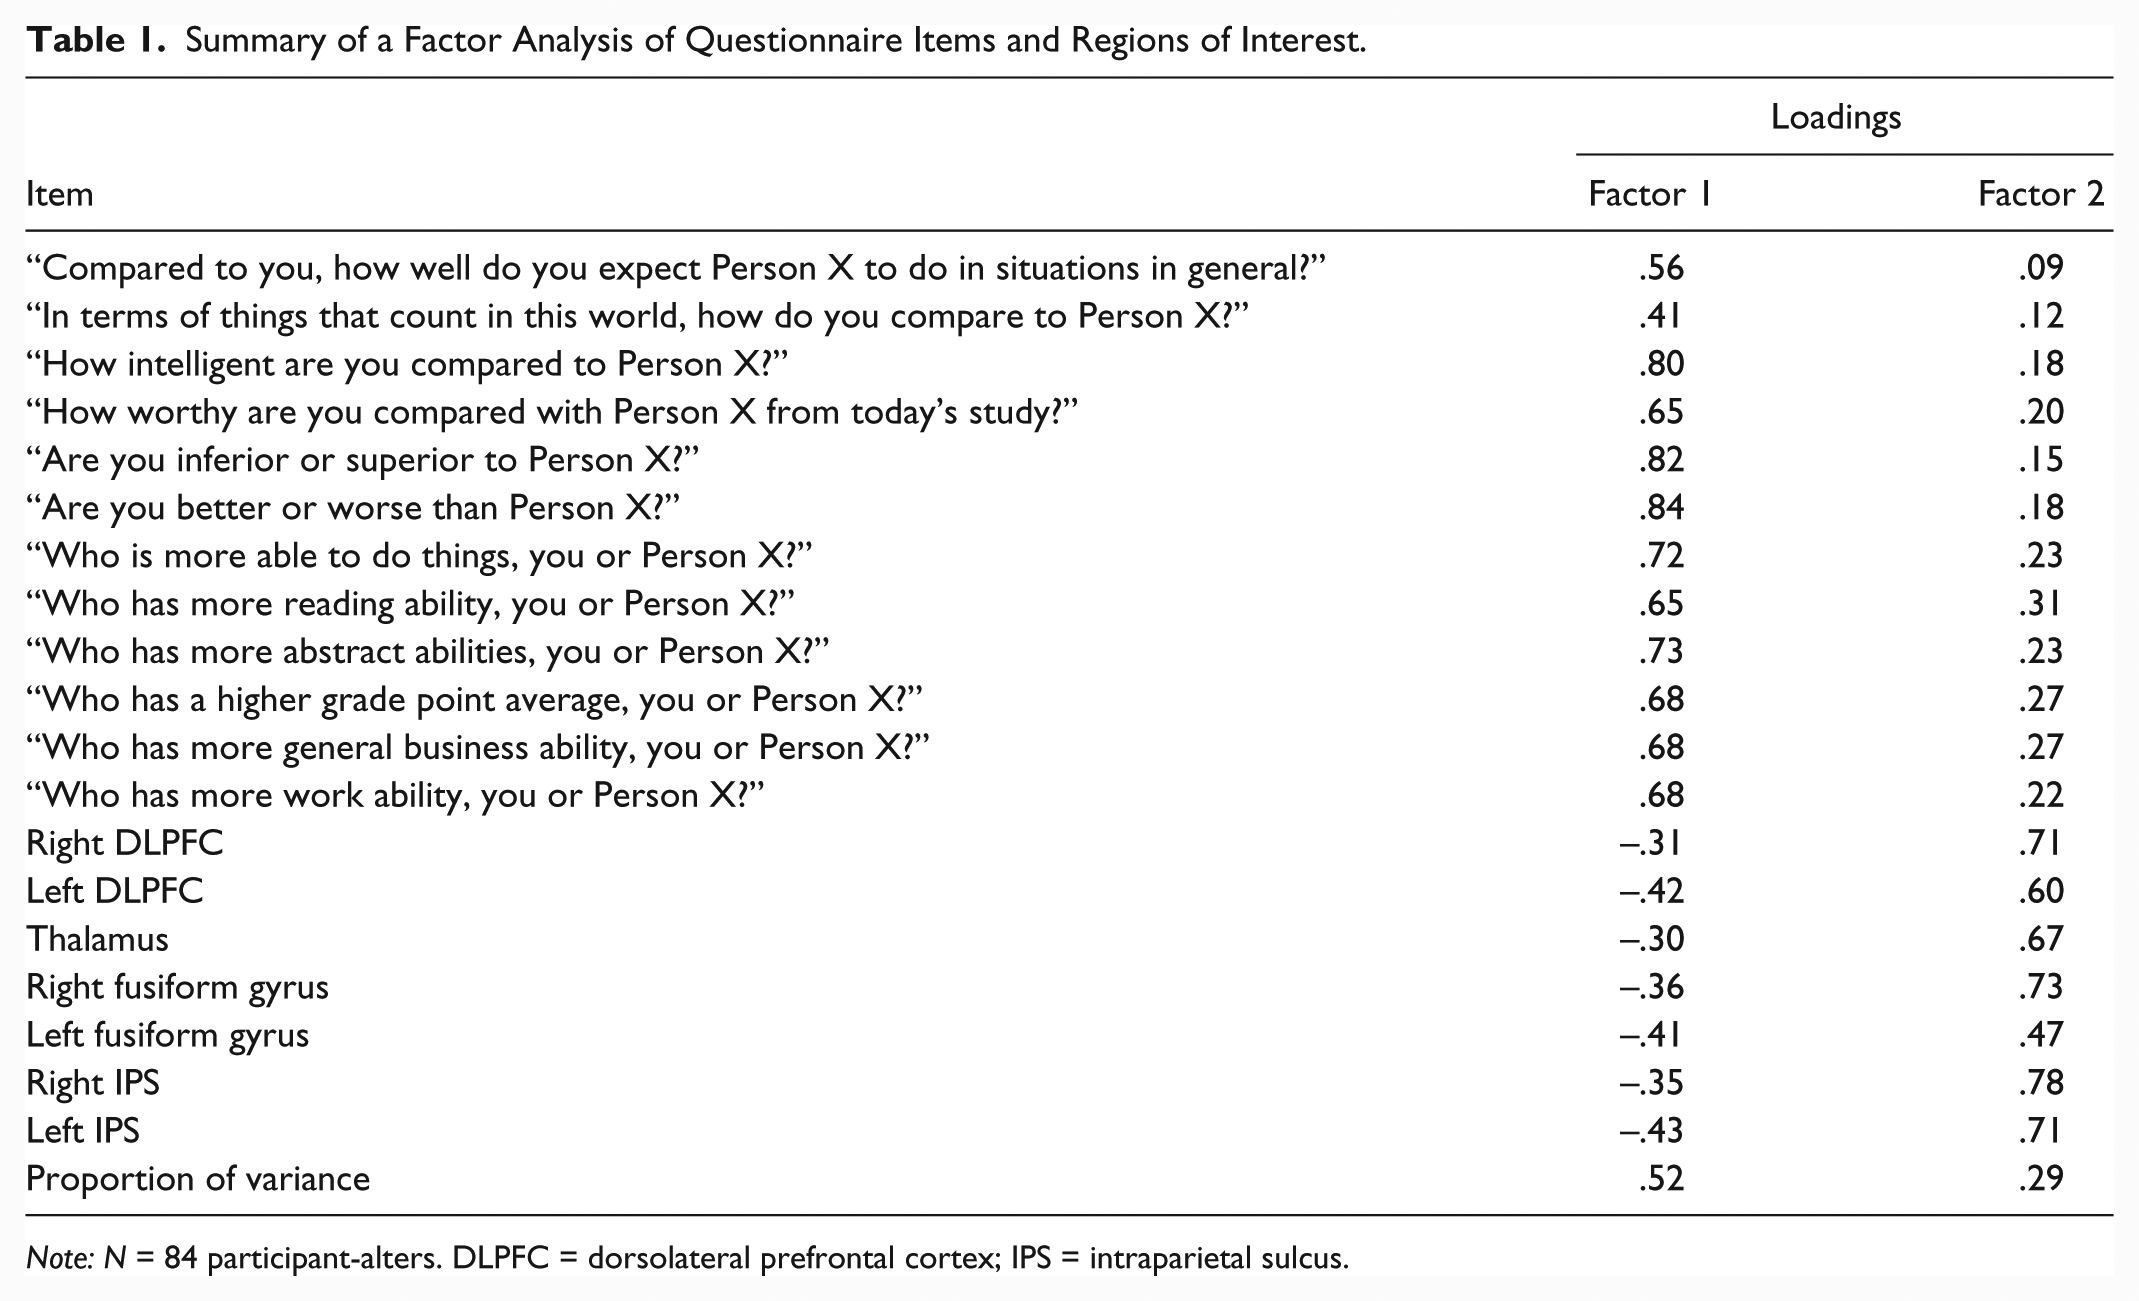
Note: N = 84 participant-alters. DLPFC = dorsolateral prefrontal cortex; IPS = intraparietal sulcus.
The BOLD measures were spheres of neural activity centered in the ROIs. See the Appendix for details on the MRI data acquisition and the coordinates of the ROIs. The BOLD measures were averaged over all scans within the first four seconds of each trial. This corresponds to the time period when participants were receiving information about the (fictitious) partner for the trial. We measured BOLD responses in the following ROIs (Chiao et al. 2009; Zink et al. 2008): the DLPFC, amygdala, thalamus, posterior cingulate, medial prefrontal cortex, fusiform gyrus, IPS, inferior frontal gyrus, and middle frontal gyrus.
Results
When participants interacted with medium- or equal-status others, they stayed with their initial opinions 58 percent of the time. Participants interacting with high-status others stayed with their initial opinions only 32 percent of the time. Participants interacting with low-status others stayed with their initial opinions 77 percent of the time. These differences are exactly as predicted by SCT. Relatively high-status people do not defer, while low-status people do. The status manipulation had a powerful effect on social influence behaviors.
Although SCT predicts that status will be related to social influence, it also argues that the intervening mechanism is expectation states. Before describing our mediation analyses, we discuss the properties of our ROI measures. Of the nine ROIs identified in the previous literature, only four were found to result in significant differences in BOLD responses on the basis of the status of the other with whom the participant interacted. These ROIs are the (right and left) DLPFC, the thalamus, the (right and left) fusiform gyrus, and the (right and left) IPS. Including measures from both the right and left hemispheres results in seven ROIs. It is worth reiterating that prior work did not meet the scope of SCT, nor was it intended to test SCT. As such, it is unsurprising that not all of the ROIs resulted in significant contrasts.
To assess overlap between the set of seven ROI measures and the more traditional 12 questionnaire items, we estimated a factor analysis. There are two underlying factors in these data corresponding to the questionnaire items (eigenvalue = 6.75, all factor loadings > .4) and the ROIs (eigenvalue = 3.72, all factor loadings > .4). Table 1 presents the factor loadings. These results are useful. First, they show that the ROIs are measuring the same thing. Second and similarly, they show that the 12 questionnaire items are also measuring the same thing. Unfortunately, they are not both measuring the same thing, which would have been optimal from our perspective. On the basis of the results from the factor analysis, we created a scale for the ROIs by summing its indicators.
Mediation Analysis
Table 2 presents four random0intercept linear mixed models, with the three simulated partners nested in each participant. These models correspond to the standard Baron and Kenny (1986) mediation analysis. Model 1 shows that the manipulation had the intended effect on social influence, P(S). Model 2 shows the relationship between the manipulation and the BOLD responses in the ROIs. Consistent with previous research (Zink et al. 2008), here we see that neural activity is greater when participants interacted with high-status others but not when they interacted with low-status others.
Summary of Linear Mixed Models Predicting the Proportion of Stay Responses.

Note: N = 84 participant-alters. ROI = region of interest.
Reference category is the medium-status partner.
p < .05. **p < .01. ***p < .001.
Model 3 shows that when the manipulation is not included in the model, the ROI scale indeed predicts social influence. Most important, however, the final model in Table 2 shows that when the ROI scale is included, it is not a significant predictor of social influence, and the manipulation remains significant. This indicates lack of mediation. The indirect or mediated effect of the manipulation through the ROI scale is .038 for the low-status other and –.086 for the high-status other (i.e., 190.91 × .0002 = .038 and −430.29 × .0002 = −.086, respectively). So the ROI scale explains 3.5 percent and 6.0 percent of the effect of low- and high-status others, respectively (i.e., .038/.1.097 = .035 and −.086/−1.443 = .060). According to the Baron and Kenny (1986) methods, mediation is not occurring: the manipulation remains significant and the mediators are not significant after including the manipulations in the models.
The Baron and Kenny (1986) method, however, has the least power among common methods for detecting indirect effects (Fritz and MacKinnon 2007). As such, we also used a more powerful bootstrap test of mediation. 6 To do so, we sampled cases with replacement, computed the indirect effect, and repeated the process 10,000 times. 7 This yields a bootstrap distribution of the indirect effect. For the neural ROI scale, the 95 percent confidence intervals for the indirect effect were –.068 to .151 for the low-status other and –.173 to .099 for the high-status other. Even using the more powerful test for detecting indirect effects, the ROI scale does not significantly mediate the effect of the status manipulation on social influence, as indicated by the fact that both confidence intervals include zero. The small effect sizes, the power of the bootstrap test for indirect effects, and the fact that all of our confidence intervals include zero suggests to us that mediation is not occurring in our data. 8
Discussion
According to Hedström and Swedberg (1998), “the identification and analysis of social mechanisms is of crucial importance for the progress of social science theory and research” (p. 7). That is, identifying and testing the mechanism underlying empirical associations is a sign of scientific progress. Although relatively little work has explicitly examined the mechanism between status and social influence, part of this is assuredly an assumption on the part of SCT scholars that expectation states cannot be measured. As Wagner (2007) noted, individuals are often not aware of their status-based expectations for others. He cited three reasons for this: (1) actors are often asked to recall their expectations after the fact, (2) actors’ accounts of their expectations are subject to social desirability bias, and (3) the development of expectations is assumed to be nonconscious, implying that the actors do not have direct access to them. Although it may not have been possible to measure expectation states when SCT was in its infancy, we now have access to a range of technological advances that may enable their measurement. Similarly, in particle physics, the Higgs boson was argued to exist in the 1960s but was not actually measured until the 2000s (Aad et al. 2012). It is not acceptable to assume that expectation states simply cannot be measured, because then we are relying on faith in the theory rather than actually testing it. The association between status and influence has been demonstrated hundreds of times (Berger et al. 2014); what explains that association, at this point, is the more pressing result. For scientific progress to occur, the onus is upon us to test our arguments and not just have faith in them.
In this spirit, ours is the first study to test SCT using MRI technology. Although this constitutes a significant protocol variation—a fact that should not be taken lightly (Kalkhoff and Thye 2006)—it seems unlikely that the apparatus was interruptive in the present context given that we replicated a strong effect of status on influence. As mentioned previously, we also found significant effects of status on both the paper-and-pencil and neural measures of performance expectations. We only failed to find statistical evidence of mediation. Perhaps other novel measures available to us today are better suited to measuring the underlying mechanism. We hope that others will take up this call.
With respect to our neurological findings, it is worth returning to the fact that we measured neural activity when the participant received information about the person with whom she would be interacting at the start of each trial. 9 We borrowed this approach from Zink et al. (2008), whose study is closest to a test of SCT in the social neuroscience literature. Indeed, consistent with this study, we found that neural activity was greater when participants interacted with high-status others, but not when they interacted with low-status others. Again, though, we failed to find evidence of mediation at the neural level. With respect to the SCT standardized experimental setting, perhaps it would be better to measure performance expectations with neural activity when participants are learning their relative rank for the first time, rather than at the beginning of each trial. In our study, though, participants were not in the scanner when they received the status manipulation. Therefore, whether and how the timing of neurological measurement may influence findings in the context of the standardized experimental setting is a question for future research.
Future researchers should also consider the advantages and disadvantages of fMRI as a method of measuring brain activity in comparison with other available techniques. Although fMRI is a powerful neuroimaging tool, particularly when it comes to localizing sources of activity in the brain (i.e., good spatial resolution), it has relatively poor temporal resolution. The BOLD response peaks about four to six seconds after neurons begin to fire in a region of the brain (Haas 2016), which makes it difficult to time lock the measured response to stimulus events (Lindquist 2008). Our study should be replicated using neuroimaging techniques that trade spatial resolution for greater, millisecond-level temporal resolution, such as electroencephalography (EEG). Given its relatively high temporal resolution, EEG is capable of directly measuring neural responses at the early, unconscious processing stage (Kalkhoff et al. 2016). Because performance expectation states are often nonconscious (Correll and Ridgeway 2006), EEG may be better able to detect the role of performance expectations in status processes than either hemodynamic (fMRI) or paper-and-pencil approaches.
Other mechanisms linking status to behaviors such as social influence should also be explored. Recent research has found that “uncertainty reduction” explains some of the effect of status on social influence (Melamed and Savage 2016), suggesting that at least one alternative mechanism is at play. It is unclear what other mechanisms might contribute to explaining the strong effect of status on behavior, though Driskell and Mullen (1990) considered a few of them.
Finally, Although we anticipated that the neural measures would explain the repeatedly reported association between status and influence, that may have been too lofty of a goal given the current state of interdisciplinary knowledge. Studies in social neuroscience typically establish relevant brain regions where activity is taking place, but they do not generally go further than that. The study by Zink et al. (2008), as well as the study by Chiao et al. (2009), identified active brain regions while participants interacted with those who differed in status. They did not seek to contribute to generalizable theoretical knowledge by explicitly identifying the neural or cognitive mechanism linking social status to behavior. Unraveling the complex neurosociological linkages among social status, performance expectations, and behavior will clearly be a challenging task. We have at least taken the first step in that direction, and the set of methodological and analytical procedures we have developed are ready for use in future studies.
Footnotes
Appendix
Acknowledgements
We thank Deborah Hardesty and the Center for Cognitive and Behavioral Brain Imaging at The Ohio State University and Scott Savage, Bob Shelly, Dave Wagner, and Murray Webster for helpful comments.
1
For a more formal presentation of the theory, see Berger et al. (1977:107–30), Melamed (2011:5–9), or Webster, Whitmeyer, and Rashotte (2004:742–43).
2
Since then the items have been elaborated (Rashotte and Webster 2005; ![]() ).
).
3
We told participants that there were a total of four participants to help with the deception. Participants were “paired up” while in the MRI scanner, and it seemed too far-fetched that participants would believe that people were sitting around waiting for them in an MRI machine.
4
Although contrast sensitivity has been used for approximately 50 years, there is no indication that participants are aware of this fictitious ability (on the basis of poststudy interviews and discussions with others who have used it).
5
For values of zero and one, we added and subtracted .01, respectively. This ensured that the logit transformation did not result in missing data.
6
The bootstrap test of mediation has a known bias. The central tendency of the distribution is not guaranteed to be the estimated effect, because of sampling variability. However, the bias-corrected bootstrap test has an elevated type I error rate (Fritz, Taylor, and MacKinnon 2012), so we rely on the standard bootstrap test. This is why the point estimates of the indirect effects are not at the center of the reported confidence intervals.
7
An R script to implement the bootstrap test of mediation is available from the corresponding author upon request.
8
Substantively identical results are obtained if we omit the equal status other and only focus on the contrast between high- and low-status others. These results are available upon request.
9
We also found average neural differences during the six seconds when the participant received the initial opinion of her partner, but these results are generally weaker than those we present here. These results are available upon request.
Funding
This work was supported by the Army Research Office (67034-LS).
Author Biographies
![]() ) and serves as a deputy editor of Social Psychology Quarterly and as a council member and chair-elect for the Evolution, Biology, and Society Section of the American Sociological Association. His research interests include neurosociology and social psychology. Current projects focus on the multiperson dynamics of relational cohesion (with Shane R. Thye, Edward J. Lawer, and others), the neurodynamics of social status (with David Melamed, Joshua Pollock, and others), and team perception and performance under threat (with Josh Pollock and Christopher Moore). He holds a BA in sociology from Marquette University and both an MA and a PhD in sociology from the University of Iowa.
) and serves as a deputy editor of Social Psychology Quarterly and as a council member and chair-elect for the Evolution, Biology, and Society Section of the American Sociological Association. His research interests include neurosociology and social psychology. Current projects focus on the multiperson dynamics of relational cohesion (with Shane R. Thye, Edward J. Lawer, and others), the neurodynamics of social status (with David Melamed, Joshua Pollock, and others), and team perception and performance under threat (with Josh Pollock and Christopher Moore). He holds a BA in sociology from Marquette University and both an MA and a PhD in sociology from the University of Iowa.