
Abstract
In this article, the authors assess the impact of a fish polyculture program introduced through women-only groups on the gender asset gap among households in the Jessore District of Bangladesh. The analysis is framed using gender structure theory to examine the ways individual, interactional, and macro forces shape the asset gap as a key gender equity outcome. The authors find that participation in the fishpond program, as a mechanism at the macro dimension of the gender structure, was associated with an increase in the gender asset gap over time.
A central question for development policy is how to be sure the rewards of interventions are shared by all members of households. In this research, we examine a gender-sensitive development program in the Jessore District of Bangladesh. The program, which provided training and the means to develop polyculture fishponds, exclusively targeted women, with the focused goal of improving gender equality. To analyze the impact of this initiative, we explore whether women’s participation in the fishpond program had an impact on patterns of asset ownership in the household. We examine patterns of asset ownership because previous research has highlighted how women’s ownership of assets can translate to a number of positive outcomes relating to gender equality and family well-being (Deere and Doss 2006; Doss et al. 2014; Food and Agriculture Organization of the United Nations 2011; Hallman 2003; Kumar and Quisumbing 2010, 2011; Meinzen-Dick et al. 2011). We have two goals for this study. First, we aim to illustrate the utility of gender structure theory as a framework for studying and designing development projects that have a gender equality component. As we will discuss in more detail, we use gender structure theory to examine how variables at the individual (women’s education), interactional (early levels of the gender asset gap and joint asset ownership), and the macro level (technology adoption) affect changes in the gender asset gap. In addition to illustrating the use of gender structure theory, our study also provides a case study evaluation of the impact of a women-only aquaculture program in the Jessore District of Bangladesh.
Gender and Development
When we talk about gender equality and international development, it is important to position this empirical domain within the multiple countervailing forces entailed in cross-national connections. Gender orders in all nations are shaped and influenced by international forces, whether they be in the legacy of colonization (Lowe 2015), migration (Kim 2008; Pedraza 1991), state activities (Moghadam 2004; Parreñas 2015), globalized economies (Guevarra 2014), or development initiatives (Cornwall and Edwards 2014; Fernández Kelly 1989). Some of these cross-national connections create new forms of gender inequality, others further entrench existing gender regimes, and others act as progressive forces promoting equality between men and women. Furthermore, some global processes encompass contradictory processes, reproducing gender inequality in certain ways while challenging it in others. Our study focuses on the realm of international development as a cross-national dynamic that influences local gender regimes. Like many cross-national forces implicated in processes of gender inequality, international development initiatives bridge the industrialized nations of the West, which act as major sources of funding and administration of these projects, to underdeveloped nations of the global South, where the development programs are implemented on the ground and the effects of these initiatives are most strongly felt.
Theories around gender and international development have evolved tremendously over the past several decades from the initial “gender-blind” household models (Becker 1981) to complex theories that integrate considerations of power, resources, and culture (Doss 2001; Geisler 1993; Haddad, Hoddinott, and Alderman 1997; Kolli and Bantilan 1997; Quisumbing 2003; Quisumbing, Meinzen-Dick, et al. 2014; Udry 1996). Blumberg’s (1984) theory of gender stratification has been particularly influential. In a review of her theory (Blumberg 2005; Cohn and Blumberg 2016), she suggested that women’s economic empowerment is nearly a “magic potion” for both increasing gender equality and “the wealth and well-being of nations” (Blumberg 2005:1). Her argument focuses not only on women’s economic productivity but also on their control over their own productivity and income. Improving women’s access and participation in economic activities not only provides a boost for gender equality (an immensely valuable goal in its own right), but it also is a boon for widespread economic development in households, communities, and nations at large. The increasing realization that gender matters for the whole development project, not only for women, has led a movement among policy specialists from “gender-blind” to “gender-aware” interventions and then further to gender-transformational interventions. Efforts are increasingly made to design interventions that reduce poverty by increasing women’s economic status.
Still, the most effective means to empower women is widely debated. Meinzen-Dick, Kovarik, and Quisumbing (2014) criticized the exclusive focus on women’s behavior and attitudes in gender and development literature, arguing that this sole emphasis does little to alter problematic social structures and patterns of interaction that play a large role in gender relations (also see Cornwall 2003; Ransom and Bain 2011). Providing women greater access to technology and resources, such as credit, does not guarantee that such opportunities will not be coopted by husbands or other men in women’s lives (Doss 2001; Karim and Law 2013; Ogawa 2004). In short, we know that women’s economic empowerment plays a key part in improving gender equality, but we continue to grapple with the incredibly complex problem of how to achieve such a goal.
In this article, we propose that gender structure theory (Risman 2004; Risman and Davis 2013) may provide a useful analytic framework for understanding gender inequality in the context of international development. We understand that the content of gender inequality differs across regions, conditions, and milieus. Yet by adopting the framework of gender structure theory, practitioners and researchers can begin to, at the very least, ask the right questions about gender relations. What are the role of institutions and culture in men’s and women’s lives? What are some of the patterns of interaction between men and women? How might individual’s interests and capabilities shape patterns of gender inequality?
Gender Structure Theory
Gender structure theory posits that gender is structured at three dimensions of social organization: the individual, the interactional, and the macro (Risman 2004; Risman and Davis 2013). At the individual level, the focus is on the processes by which gendered identities becomes internalized. Cultural forces are paramount through inscribing a worldview that reinforces gender difference and inequality. According to Bem (1993), when individuals grow up in a culture with a polarized notion of masculinity and femininity that privileges the position of men, people internalize cultural outlooks that tend to legitimize and thereby bolster gender inequality. Such cultural norms play a role in forming women’s traditional proclivities for subsistence farming in contrast to men’s interest in commercial farming, trends that become problematic when commercial activities are privileged in development initiatives (Rocheleau, Ross, and Morrobel 1996). Gender identities and norms also play a role in the development of individuals’ human capital, shaping the opportunities and interests men and women have in education, for example.
At the interactional level, gendered identities both shape and are reinforced through interpersonal social relations whereby people behave and interact with one another in ways that reinscribe the gender order. We act in certain ways toward a man or a woman depending on our own perceptions of who we are and who we think they are. This in turn creates and reinforces gender within ourselves and routinizes our interactions with others in ways that uphold traditional gender norms (West and Zimmerman 1987). Distribution of assets at the interactional level constitutes a material process that contributes to gendered patterns of behavior and opportunity in families. For example, research has found women’s ownership of assets is linked to more power over household decisions and greater autonomy (Deere and Doss 2006; Hamilton 2002; Johnson et al. 2016; Meinzen-Dick et al. 2011).
The macro dimension of the gender structure refers to the institutions that influence individuals’ lives. Macro-level forces exist “outside the individual” and shape action in a way that would not have occurred given individualized personalities and/or interactional relations, and they do so in gendered patterns (Lorber 1994). In this article, we conceptualize the fishpond intervention as a material influence at the macro dimension because its introduction into adopting households was the result of organizations acting independently from the individuals who would eventually adopt the technology. As we discuss in more detail below, the fishpond technology we explore in this study was developed by an international research center, and its introduction was facilitated by international and local nongovernmental organizations (NGOs). Without the intervention of these organizations, it is safe to say that households in Jessore District would not have adopted fish polyculture at the time observed in our analysis. Therefore, the introduction of this technology was the result of forces acting “above the individual,” shaping the opportunities and choices of people residing in Jessore. Because the fishpond technology introduced a tangible new resource, fish and income from fish, it constitutes a material intervention by altering the organization of resources.
In this research, we offer an example of how to evaluate development programs through the framework of gender structure theory. As the theory outlines, gender inequality is structured across individual, interactional, and macro levels. Therefore, we have included variables in our analysis that capture each aspect of the gender structure. Surely it is impossible to include the multitude of factors involved in gender. Nonetheless, conceptualizing gender across these three dimensions provides a useful and manageable framework for understanding the processes involved in gender inequality and how development programs are implicated in those dynamics. Below, we provide more detail on the variables we used at the different dimensions of the gender structure. For now, we will mention that we focus on women’s education as a human capital characteristic at the individual dimension of the gender structure, early levels of joint asset ownership and early levels of the gender asset gap as variables at the interactional dimension, and participation in the fishpond program as a variable at the macro dimension. Processes involved at each level of the gender structure co-occur and interact to affect patterns of gender inequality. Among the most influential measures of gender inequality, one that has garnered significant attention in recent research on gender and development, is the gender asset gap.
The Gender Asset Gap
If economic empowerment is the “magic potion” for development (Blumberg 2005), then women’s access to assets and resources is a key ingredient (Deere and Doss 2006). Gender asset gaps are not uniquely a problem of developing societies, but they most assuredly do exist in many of the societies in which development policies are targeted. Gender asset gaps are present when men (and it is almost always men) own a larger share of household assets than their wives and/or other women in the household (Deere and Doss 2006). Meinzen-Dick et al. (2011) show convincingly that patterns in ownership of household assets plays a considerable role in women’s equality and children’s well-being. When women increase their share of assets within and beyond their households, benefits accrue to their children, especially girls. Their research suggests that women seem to have less bias toward expending assets disproportionately on sons, as is often the case among men in instances in which large gender asset gaps exist. In addition, Meinzen-Dick et al. argued that when women’s assets increase, so does their bargaining power and their ability to control what they produce. Indeed, the benefits of women’s increased ownership of assets has been found in number of studies taking place in a variety of international settings (Hallman 2003; Kumar and Quisumbing 2010, 2011).
Although we know that women’s empowerment, as measured by asset ownership, improves their own and their children’s well-being, Meinzen-Dick et al. (2011) suggested that we do not yet really know “what works” to reduce gender asset gaps. They did suggest several possibilities: improving women’s participation in economic activity, increasing women’s chances to benefit from their economic activity, and changing men’s attitudes and behaviors. Implementing development projects that economically empower women, change men’s attitudes, and reduce the gender asset gap has proved to be incredibly difficult, however. In a review of eight development projects aimed at empowering women, Johnson et al. (2016) found that only one project was successful in reducing the gender asset gap, and only half of the projects increased women’s gross ownership of assets. According to Johnson et al., development programs that succeeded in improving women’s ownership of assets were able to have an impact on community and household attitudes toward women’s productive activities and decision making. These findings confirm Meinzen-Dick et al.’s proposition that reducing the gender asset gap requires changing the hearts and minds of family and local community members in tandem with providing women with economic opportunities. In many ways, previous research on the asset gap is pointing us toward a multidimensional approach to studying gender.
The importance of asset ownership has been accepted by a wide array of scholars and development practitioners (Doss et al. 2014; Food and Agriculture Organization of the United Nations 2011). Yet, as the study by Johnson et al. (2016) shows, we still do not know the best way to reduce gender asset gaps. In this study, one of our goals is to examine a single development program that aimed to promote gender equality through using women-only groups to train and provide the resources for women to manage polyculture fishponds. By analyzing this project, we aim to contribute to ongoing debates comparing the benefits and limitations of women-only development projects as opposed to programs that are gender integrated. Additionally, because the focus of our study is on an aquaculture program, we also provide an account of this technology and its effects on the gender asset gap. Unfortunately, because we focus on a single project in which the aquaculture was introduced through women-only groups, we are unable to disentangle the effects of the aquaculture from those of the women-only modality of introduction. Nonetheless, one strength of our study lies in a thorough analysis of this single development program.
Women’s Group–Based Fish Polyculture Program in Bangladesh
From 1994 to 1995, Banchte Shekha, an NGO, started a program that provided training in fish polyculture to women in the Jessore District of Bangladesh. Fish polyculture is a type of agricultural technology designed to increase fish farming yields by including species of fish whose feeding practices are complementary. The polyculture introduced by Banchte Shekha was developed by the International Center for Living Aquatic Resource Management (ICLARM) and was designed so that fishponds would contain both bottom and surface feeders. Extension workers with Banchte Shekha were trained by ICLARM and the Fisheries Research Institute of Bangladesh in the practices and management involved in this form of polyculture.
Banchte Shekha targeted poor households, those owning less than 0.5 acres of land, for adoption of the fishpond technology. With the two goals of improving fish farming yields for poor households and empowering women in those households, the introduction of the fish polyculture technology was performed through a women-only, group-based program in which Banchte Shekha trained women on the practices of fish polyculture and then provided long-term pond leases for groups of women. When needed, Banchte Shekha also provided credit. The aquaculture project did not include a savings program pertaining directly to fish production and sale, although such initiatives had been offered separately from the aquaculture program in the past by Banchte Shekha.
The adoption of fish polyculture through women’s groups was intended to supplement the income and nutritional status of poor households in addition to empowering women through facilitating their participation in a productive group-based activity. However, various outcomes are possible in such a project. By introducing a technology designed to increase fish farming yields, households that adopt polyculture may experience greater income (if fish are sold) and/or improved nutrition in cases in which fish are used to supplement diets. An increase in material goods resulting from women’s productive labor can also have cultural implications for family life. As a result of generating income, women’s status in the family may improve, they may have greater decision-making power, and they may be treated better by their husbands. Yet women’s ability to generate income may also produce a negative reaction by husbands who feel challenged by their wives’ increased bargaining power and their participation in new market-based economic activities. In these circumstances, it is possible that husbands can become abusive and even steal or assume control over the resources brought into the household by women (as was seen by Koenig et al. 2003 in the case of women’s participation in credit groups). Even if fish polyculture is relatively unsuccessful in generating income, women’s participation in group fishponds may be beneficial because their interaction with other women in productive capacities increases their social capital (Kumar and Quisumbing 2010).
Before moving on to the analysis of the study, it is important to review what we know about the two primary components of the development program we analyze here: the aquaculture technology and the women-only modality of introduction. Aquaculture projects such as the one that was implemented in Jessore have been regarded by some researchers as ideal technologies for the empowerment of women (Kelkar 2001). In many countries, particularly those in Southeast Asia, women are heavily involved in aquaculture activities (Weeratunge and Snyder 2010). Therefore, providing women with resources to increase their aquaculture yields may be a logical strategy to improve their economic productivity without severely disrupting cultural norms and patterns (which could create a backlash against development initiatives). There are certainly a number of case studies that have shown the benefits of this approach (Ashaletha et al. 2002; Kripa and Surendranathan 2008). At the same time, however, this logic does not pose a serious challenge to ongoing relations of gender inequality. By not altering gendered patterns of labor and/or attitudes, women may end up with a greater overall burden as their domestic responsibilities remain at the level they always were while their aquaculture activities have increased. Without altered gender relations, women may not even control or benefit from the increased proceeds from aquaculture activities (Kusakabe, Korsieporn, and Suntornratana 2003). In short, gendered assumptions around women’s role in aquaculture threaten to further entrench problematic gender norms at the same time that they provide the means for women to increase aquaculture productivity.
Just as aquaculture itself is not a “gender-neutral” technology, neither is the method through which such agricultural innovations are introduced. As mentioned above, there is a continued debate within the development community on the most effective means of producing equitable benefits through technology dissemination. Although early development projects aiming to benefit women targeted individual women, some later projects instead targeted groups of women to tap into their social capital (Shaleesha and Stanley 2000) followed by a more recent approach of including both men and women, as exemplified in the gender-transformational approach used by the World Fish Center (Farnworth et al. 2015; Morgan et al. 2015). Studies of projects targeting women-only groups, such as the one we observe in Jessore, argue that the group-based design provides women with greater social capital, improving their bargaining power with men (Kumar and Quisumbing 2010; Naved 2000).
In an examination of the same project we focus on here, Kumar and Quisumbing (2010; Quisumbing and Kumar 2011) found that the program’s group-based dissemination technique caused women’s ownership of assets to increase at a faster rate than men’s. The social capital fostered by women’s groups helped participants increase their bargaining power and accumulate more assets. However, even though Kumar and Quisumbing argued for the efficacy of women-only groups, they also warned that when development agencies or NGOs introduce new technologies in an area where women’s groups are not established, they should begin by building community support for women’s empowerment or risk the possibility that the project may backfire. Without explicitly arguing in the gender-transformational language promoted by the World Fish Center, this cautionary note highlights the importance of addressing gender norms and relations of power through using a complex understanding of gender.
As Kumar and Quisumbing (2010; Quisumbing and Kumar 2011) noted, the dissemination of gender-sensitive agricultural technologies is complex and contingent on existing economic arrangements and cultural contexts. As a result, women-based modalities may be successful in some venues (see, e.g., Ashaletha et al. 2002; Kripa and Surendranathan 2008) while having severe limitations and/or unexpected consequences in others. In many instances, studies have documented the way women’s resources have been coopted by husbands and men in women’s lives after their participation in a development project (Doss 2001; Ogawa 2004). Some studies have even shown that women face increased risk for violence from men as a result of their participation in women-based projects (Rahman 1999).
Our analysis of the aquaculture program in Jessore is positioned within existing literatures on agricultural technology, gender-based modalities of dissemination, and theories on gender equality. We realize that a case study of a single project can produce little generalizable information about aquaculture and women-based dissemination techniques. Readers must therefore interpret these findings within the particular context as they compare with other case studies. Our major contribution, however, is to put forth gender structure theory as a framework for thinking about gender equality in international development. No study can provide all the answers for gender and development, but we believe that our study can, at the very least, provide an example for how to ask the right questions. Turning to our examination of the aquaculture project in Jessore, we will now review our hypotheses and variables which are organized through the framework of gender structure theory.
Hypotheses
Gender structure theory allows us to conceptualize how gender relations are shaped by multiple factors taking place at the macro, individual, and interactional dimensions of the gender structure. We have developed three hypotheses to correspond with our theoretical framework’s multilevel conceptualization. First, at the macro level, we expect that the adoption of agricultural technology will affect household gender asset gaps. Because the technology was introduced through a gender-sensitive modality, women-only group fishponds, and included a goal of women’s empowerment, we expect that agricultural technology will be associated with a decrease in the gender asset gap:
Hypothesis 1: Households that were involved in the fishpond program will report decreases in the gender asset gap compared with households that did not participate.
Our second hypothesis relates to the interactional level of the gender structure. Here, we focus on two measures of gendered interactions: levels of jointly owned assets and early levels of the gender asset gap. Because joint ownership of assets may signal a collaborative relationship between household members, we expect it to be associated with more egalitarian patterns of asset ownership and therefore predict a decrease in the gender asset gap over time. Conversely, we expect that larger gender asset gaps will indicate a male-dominated household environment in which asset gaps will grow over time:
Hypothesis 2a: Initial levels of jointly owned assets will be associated with a decrease in the gender asset gap.
Hypothesis 2b: Households with larger initial gender asset gaps will experience more rapid growth in the asset gap over time than households with smaller initial gaps.
Finally, our third hypothesis relates to the individual level of the gender structure. We focus our analysis here on the education of female heads. By female heads, we are referring to the woman in each household who was identified in the survey as either the household head or the wife or corresponding female partner of the male household head. 1 We expect that the education of female heads will be related to lower gender asset gaps.
Hypothesis 3: The gender asset gap will decrease in households in which female heads have higher levels of education.
Data and Sample
To test these hypotheses, we draw data from the Chronic Poverty and Long Term Impact Study in Bangladesh (Quisumbing and Baulch 2010), which explored the long-term impact of several development programs throughout Bangladesh. For the purposes of this study, we use data that pertain to the group-based fish polyculture program in the Jessore District. Two rounds of surveys were conducted on this program, one in 1996 and then follow-ups in 2006 and 2007. Follow-up surveys were conducted with the same households surveyed in 1996 as well as split-off households in cases in which adults had moved out of the original households and established their own. The initial surveys in 1996 took place only three years after the fish polyculture program began. Because it takes some time for program participants to receive the training in fish polyculture and establish their ponds, the 1996 round of surveys describes household characteristics prior to the time when we would expect the agricultural technology to have a major influence. Data collected in this initial round included a wide array of variables measuring agricultural output, ownership of assets, and health-related characteristics. Surveys conducted in 2006 and 2007 focused on evaluating the effects of agricultural technology adoption, collecting information on assets, income, health, and household ability to meet basic needs.
Data in the two rounds of surveys were collected at both the household and individual levels (for individual household members) depending on the nature of the questions. For this analysis, we focus on the household as the unit of analysis because it portrays the aggregate of interactional dynamics that occurs among household members. Our research questions are centered on the relationship between agricultural technology and household gender dynamics, underscoring the importance of using the household as a unit of analysis.
All households in which women participated in the fish polyculture program were included in the initial sample and are referred to as “technology-adopting” households. Additionally, a preliminary census of villages in Jessore allowed two comparison groups to be identified: technology nonadopters and likely adopters. Nonadopting households were from villages where the technology had been introduced as well as villages where it had not been disseminated. Nonadopting households consisted of homes that did not have members involved with Banchte Shekha or had household members involved in the organization that were uninterested in the fishpond program. The third category of households, likely adopters, had members of the home who were involved with Banchte Shekha and likely to participate in the fishpond program but were located in villages where the organization had not introduced the aquaculture technology. These households are called likely adopters because it is highly possible that they would have adopted the fishpond polyculture if Banchte Shekha had disseminated it in their community. In our review of descriptive trends below, we focus on differences between technology-adopting households and the pooled group of nonadopters and likely adopters. In our regression analysis, however, we maintain the distinction among the three groups of households.
As we explain in more detail below, our analysis examines four separate categories of assets: productive, consumption, jewelry, and total durable assets. Households that did not own any items of a particular type of asset in 2007 were omitted from our models pertaining to that specific category. As a result, our sample size is slightly smaller in our examinations of productive assets and jewelry because of the fact that some households did not own any of these types of assets. In total, our sample sizes are 435 households in our analysis of productive assets, 407 in our examination of jewelry, and 448 in our analysis of consumption and total durable assets.
Variables
In the analysis that follows, our focus is on patterns of asset ownership. During the survey, respondents listed their household assets, reporting the value of each asset and also identifying which household member owned the asset or whether it was owned jointly by all household members. Our analysis focuses exclusively on durable assets, which we have grouped into the four categories of productive assets, consumption assets, jewelry, and total durable assets. Table 1 provides a summary of the types of assets that fall into each category. Productive assets are those items that can be used to produce some type of good, either directly or indirectly. A sewing machine, for example, is categorized as a productive asset because it can be used to make clothing, which has market value. Consumption assets, on the other hand, are items that are owned but not used in generative capacities. These include the vast array of household items, such as furniture and kitchen utensils. Jewelry is often lumped within the category of consumption assets, but as we will see later on, ownership patterns of jewelry differ markedly from that of other consumption assets. Therefore, we decided to separate jewelry and include it as stand-alone category of assets. To differentiate between productive and consumption assets, we adhered to the way items were recorded in the survey, which demarcated between items that were used for “personal use” (consumption assets) and those that were used for “business” (productive assets). When an asset was found in both categories of consumption and productive assets, we labeled it as a productive asset because it had the potential to be used for market activities.
Categories of Assets.

Note: Analyses of total durable assets include all items listed above.
To analyze patterns of asset ownership, we organize variables into their respective dimensions of the gender structure. Specifically, we examine the gender asset gap and levels of joint asset ownership as measures at the interactional dimension, technology adoption as a macro-dimension variable, and female heads’ education as a key characteristic at the individual dimension of the gender structure.
Interactional Dimension: The Gender Asset Gap
To measure the gender asset gap, we added the total value of assets (within the categories of productive, consumption, jewelry, and total assets) owned by women in the household and subtracted it from the value of assets owned by men in the household within each wave of the survey. The resulting measures provide the gender asset gap at 1996 and at 2006–2007. Earlier asset gaps in 1996 are analyzed as a key independent variable at the interactional dimension of the gender structure. In these measures, a score of zero indicates that men and women own the same value in assets, a negative score indicates that women own more assets than men, and a positive score indicates that men own more assets than women.
Changes in the gender asset gap between 1996 and 2006–2007 are analyzed as our dependent variable. This variable was calculated by subtracting the asset gap in 1996 from the asset gap in 2006–2007. A score of zero in this variable indicates no change in the asset gap, negative scores indicate that the asset gap decreased (and, therefore, women accumulated more ownership of assets than men), and positive scores indicate that the asset gap increased and men accumulated more assets than women between the two waves of the survey.
Interactional Dimension: 1996 Joint Asset Ownership
Although our measure of the gender asset gap takes into account the value of assets owned individually by men or women in the household, a number of assets were also reported as being owned jointly by all household members. Joint ownership of assets reflects an interactional dimension of household gender relations by indicating a degree of collaboration and shared responsibility between men and women household members. On one hand, joint ownership can imply egalitarian relations whereby household members enjoy equal privilege and responsibility for household assets. Conversely, it may also signal male dominance in cases in which women are bringing in assets to the home, which are then claimed as joint but in reality are controlled by men. In this study, we explore how levels of joint asset ownership at the first wave of the survey in 1996 affect the gender asset gap over time. Our measure of joint ownership is calculated for each category of assets analyzed in this study: productive, consumption, jewelry, and total durable assets.
We also include a control variable in our analysis that accounts for changes in the value of assets owned jointly between 1996 and 2006–2007. Because the gender asset gap is partly a function of the total value of assets owned individually in the household, including changes in joint asset ownership as a control variable prevents our asset gap estimates from being affected by changes in joint ownership.
Macro Dimension: Agricultural Technology
In general, agricultural technology is developed in organizations: researchers invent and test various tools in high-tech labs, governments plan the rollout of the technology, and NGOs introduce it to local communities. In Jessore, the development of fish polyculture was done by ICLARM and then introduced to participating women by Banchte Shekha, a local NGO. Because households would not have had access to the fishpond technology at this point in time without the intervention of ICLARM and Banchte Shekha, we identify the adoption of this agricultural technology as a macro-level force, whereby an input developed “above the individual” initiates changes within household relations (Blau 1977; Smelser and Baltes 1988). For this study, participation in the fish polyculture program is coded as a dummy variable indicating whether a member of the household participated in the program.
Additionally, we include another dummy variable in our analysis indicating whether the households were identified as likely adopters of the technology. Likely adopters were not involved in the fishpond program but were members of the NGO in villages where the aquaculture had not yet been introduced. Including this variable in the model allows us to disentangle the effects of the aquaculture technology from those of NGO participation and/or characteristics of households that would be likely to adopt the technology.
Individual Dimension: 1996 Female Heads’ Education
At the individual level of the gender structure, personal attributes of women may change their interactions with men and/or alter the gendered patterns of asset ownership within households. Because our analysis is done at the household level, we chose to focus on the education level of a key household member, the female head of the household. As touched on earlier, the household member we label as the female head is the person in the household who was identified as either the head, the wife of the head, or the female counterpart to the male head. Therefore, for all intents and purposes, this household member signifies the female head of the household: the woman holding the highest leadership position. To measure education, we use a three-point ordinal variable indicating whether the female head had zero years of formal schooling, between one and five years of schooling, or more than five years of education. Each ordinal category represents an important educational benchmark, differentiating between those who have no education, those who have some, and those who furthered their education beyond primary school (the five-year mark). Because of limited cell counts, we were unable to provide successive categories that would have indicated the completion of secondary and postsecondary education.
Control Variables
A key control variable included in the models below is the change in the total value of household assets between the two waves of the survey. Because we focus on durable assets, it is likely that households will accumulate more assets over time, and therefore the total value of their assets will increase between the two waves of the survey. Separate variables measuring change in the value of assets owned were created for each category of productive, consumption, jewelry, and total assets. Furthermore, we interact this variable with household technology adoption status (technology adopters, likely adopters, and non–likely adopters) to control for the possibility that asset accumulation has different effects by technology adoption status. We also account for shifts in joint asset ownership (as discussed above), which is critical because the gender asset gap is partly a function of the value of assets owned individually. Our models also control for whether women reported having control over any source of income in the 1996 survey. Women who controlled sources of income may be better positioned to garner a larger share of household resources. Additionally, our variables control for whether a member of the household was involved in an organization that provided microcredit loans.
Analytic Strategy
To illustrate the changing patterns in ownership of household assets, we begin our analysis with a thorough review of descriptive statistics to illustrate changes in men’s, women’s, and joint ownership of durable assets across the two waves of data and among technology-adopting and nonadopting households. In our discussion of the descriptive trends, we also compare changes in patterns of ownership across productive, consumption, jewelry, and total durable assets.
After reviewing descriptive trends in asset ownership, we analyze the determinants of changes in the gender asset gap by using a series of first-difference regression models. First-difference models are commonly used in impact studies because they effectively control for the stable effects of stable unobserved unit characteristics between at least two periods of time (Allison 2005). Our analysis consists of four first-difference regression models. Each model includes the same basic variables but focuses on either productive, consumption, jewelry, or total household durable assets. Equation 1 outlines the primary model used in our analysis:

The dependent variable (yh2 – yh1) is the gender asset gap measured in 2006–2007 subtracted by the same measure taken in 1996, µ is the intercept for the first-difference model, th2 indicates the technology adoption status of households, and the paired β2 is the coefficient representing the effect of technology adoption. To estimate the effect of changing household characteristics, (xh2 – xh1) represents the shifts in the total value of assets owned in a household and (zh2 – zh1) is the difference in the value of jointly owned assets between 2006–2007 and 1996. Consistent with our hypotheses, we also examine whether the value of jointly owned assets in 1996 (zh1) and 1996 gender asset gaps (yh1) affects changes in the gender asset gap. Because the first-difference models account for stable effects of household characteristics, the coefficients for these variables indicate the difference in effects between 2006–2007 and 1996, represented in equation 1 as (β2 – β1). We also examine the effect of time-invariant household characteristics such as female head’s education (sh), whether women have control over any source of income (ch), and participation in a credit group (gh). 2 Similar to our estimation for the effects of 1996 variables, the coefficients for these three time invariant variables indicates the difference in their effect on the gender asset gap between 2006–2007 and 1996, (β2 – β1). The last estimator in our model, β[th2 × (xh2 – xh1)], allows us to determine whether changing values in household assets between 1996 and 2006–2007 has a different effect on the gender asset gap between households of different technology adoption statuses. Finally, equation 1 also accounts for the remaining variance in the gender asset gap that is left unexplained, (eh2 – eh1). By focusing on the differences within households between 1996 and 2006–2007, equation 1 controls for unobserved stable effects of stable household characteristics, leaving only unobserved variant effects and changing household characteristics in the remaining error term.
Results
Descriptive Statistics
Figures 1 through 8 illustrate the shifting patterns of asset ownership between 1996 and 2006–2007. In these figures, we compare households that participated in the fishpond program with those that did not participate (both nonadopters and likely adopters). In Figures 1 and 2, we present the distribution of total durable assets. In 1996, we find a sizable gender gap, with men owning an average of more than double the assets of women. Additionally, during this period of time, the largest portion of household assets were owned jointly. At this initial wave of data collection, there were no signficant differences between technology-adopting and nonadopting households. By 2006–2007, however, significant differences emerged between these two types of households. Although the gender gap increased dramatically in all households, it grew much more in households that were involved in the fishpond program (p < .01). By 2006–2007, women residing in technology-adopting households owned a slightly higher value of assets than women in nonadopting households (3,862 Bangladeshi taka [BDT] vs. 3,339 BDT). Men in technology-adopting households, however, increased in their sole ownership of assets to a far greater extent than men in nonadopting homes (p < .001). At the same time that men’s owership of assets grew, the relative proportion of jointly owned assets in technology-adopting homes decreased. In 2006–2007, the largest share of assets in nonadopting homes were owned jointly. In technology-adopting households, on the other hand, men owned the largest share of assets. These initial findings suggest that men may be taking ownership of assets previously owned jointly or that initial levels of joint asset ownership may justify the future accumulation of men’s assets among households in which the fishpond technology was adopted.
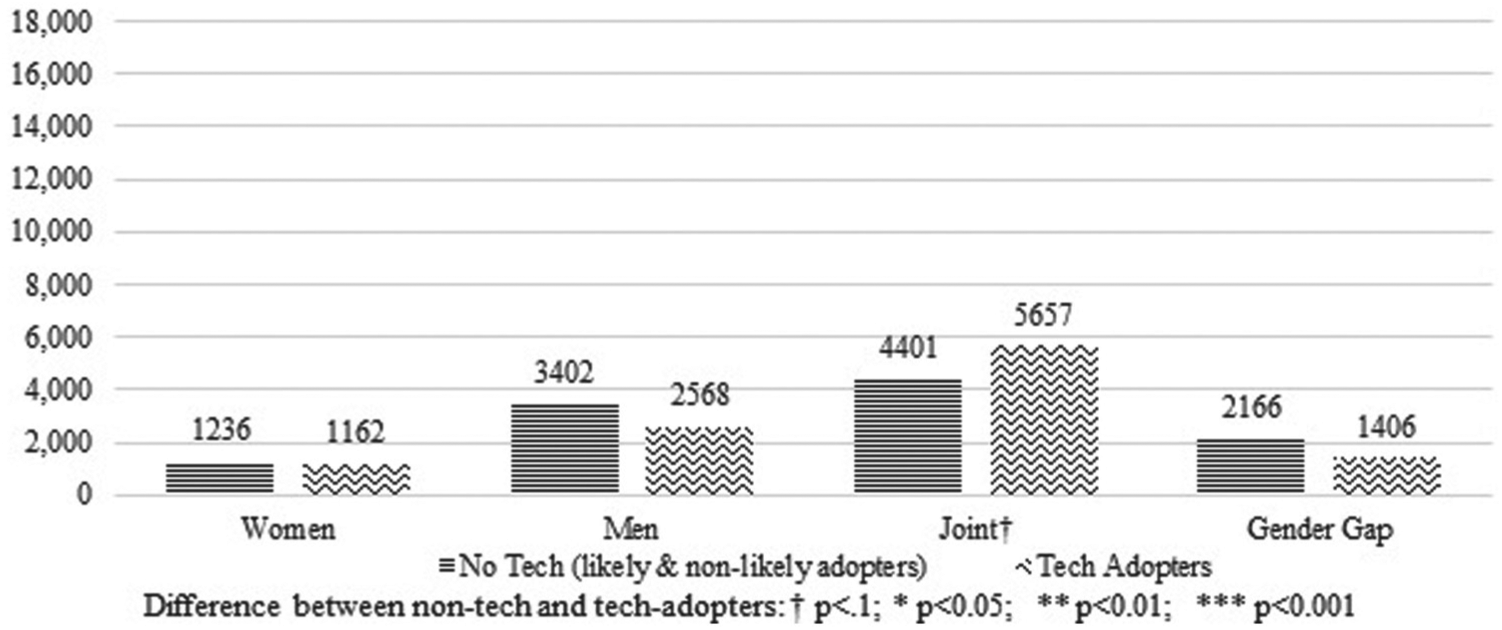
Value of assets owned at wave 1 of survey, 1996 (measured in Bangladeshi taka).

Value of assets owned at wave 2 of survey, 2006 (measured in Bangladeshi taka).

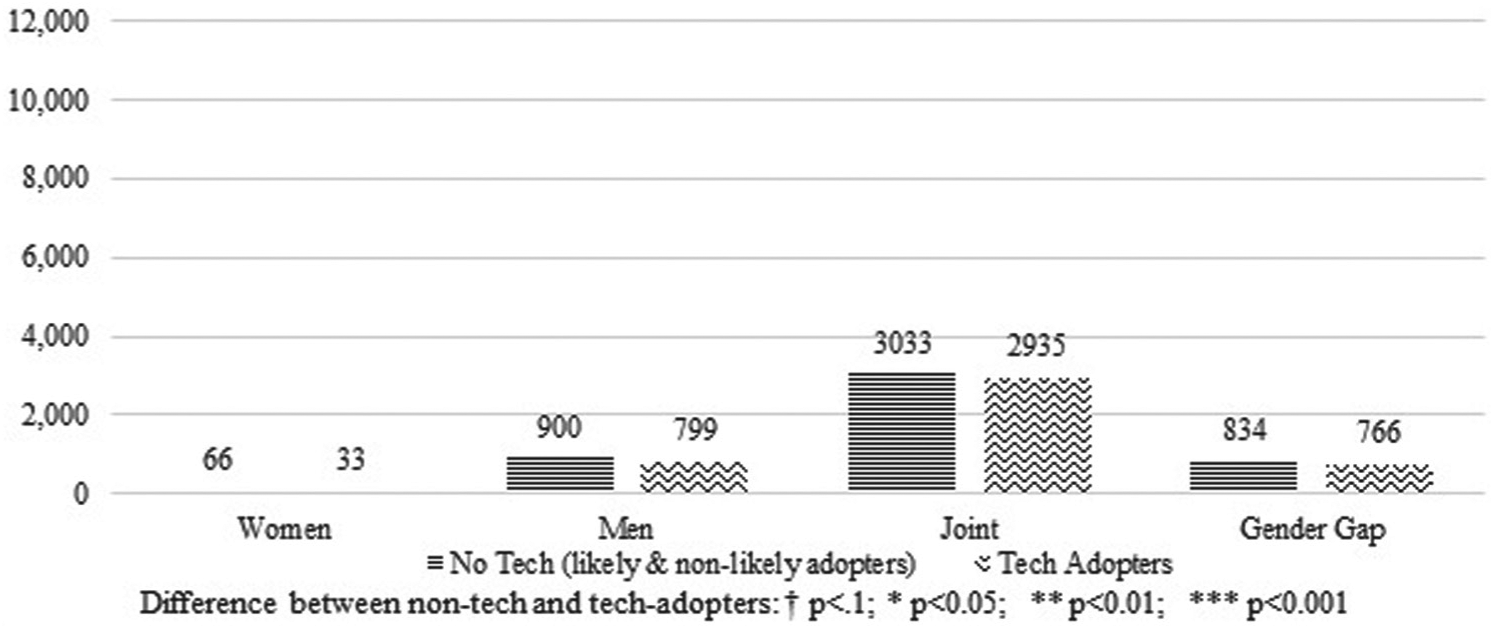
Value of productive assets owned at wave 1 of survey, 1996 (measured in Bangladeshi taka).

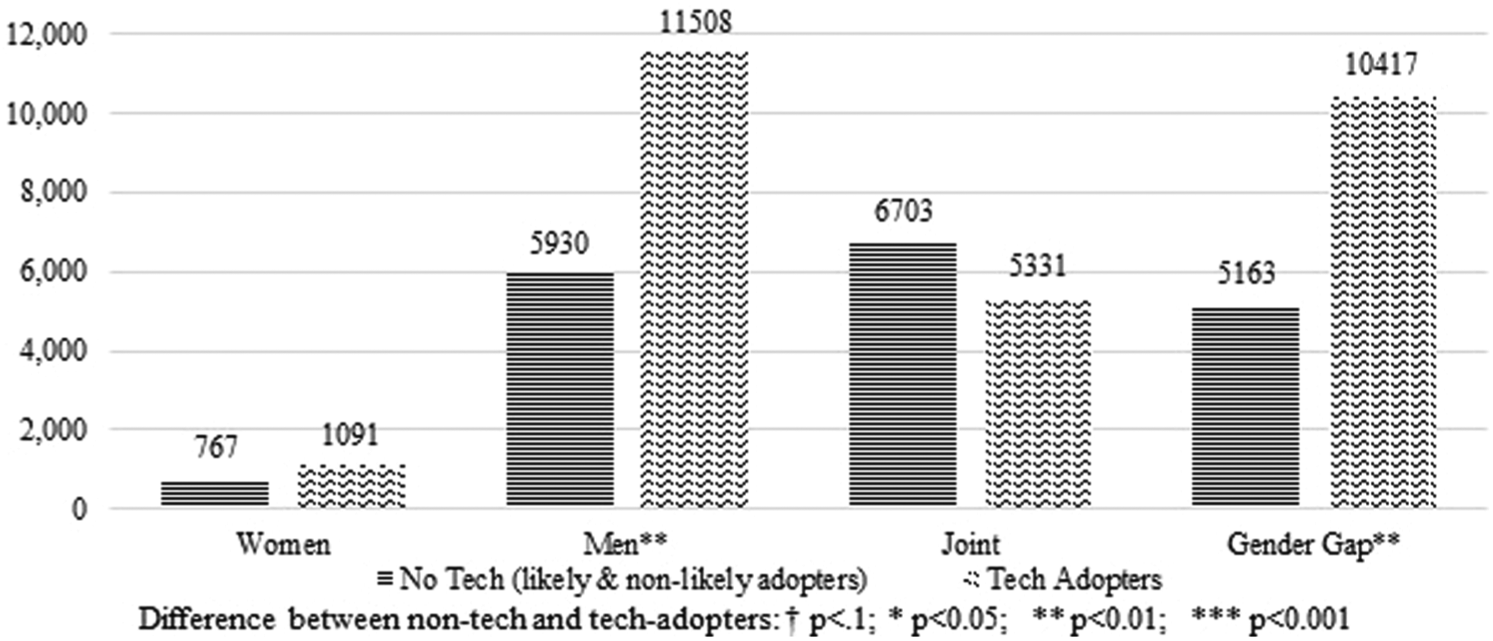
Value of productive assets owned at wave 2 of survey, 2006 (measured in Bangladeshi taka).
Value of nonjewelry consumption assets owned at wave 1 of survey, 1996 (measured in Bangladeshi taka).
Value of nonjewelry consumption assets owned at wave 2 of survey, 2006 (measured in Bangladeshi taka).

Value of jewelry assets owned at wave 1 of survey, 1996 (measured in Bangladeshi taka).

Value of jewelry assets owned at wave 2 of survey, 2006 (measured in Bangladeshi taka).
Figures 3 through 8 add detail to our broad measure of assets by presentng trends in asset ownership across three distinct categories. Figures 3 and 4 highlight ownership of productive assets, Figures 5 and 6 show patterns in the ownership of consumption assets, and Figures 7 and 8 illustrate ownership of jewelry. A clear trend emerges in patterns of productive and consumption assets: between 1996 and 2006–2007, the gender asset gap increased dramtically for all households included in the study, but it grew much more in technology-adopting households than it did in nonadopting households. This trend is driven by a decreasing share of assets owned jointly and a tremendous growth in the value of assets owned solely by men. Although women’s ownerhip of productive and consumption assets increased between 1996 and 2006–2007, men’s ownership increased much more. This is particularly true in technology-adopting households, in which men claimed the largest share of ownership in productive and consumption assets by 2006–2007. Additionally, the relative dearth of women’s ownership of productive assets suggests that this category of items may be particularly male typed. That is, there may be strong normative trends that maintain men’s primary ownership of these types of assets.
Patterns in the ownership of jewelry differ markedly from consumption and productive assets. As Figures 7 and 8 show, jewelry appears to be a female-typed asset. In 1996, women owned nearly all the jewelry in households included in the study. By 2006–2007, women continued to own a much larger share of jewelry than men, but the majority of jewelry was owned jointly. Not only is jewelry an exceptional category of assets because it is owned mostly by women, but it is also the only category of assets for which the relative share of joint ownership increased between the two waves of the survey. Despite the increase in joint ownership of jewelry, however, the gender gap in ownership of jewelry remained relatively unchanged between 1996 and 2006–2007.
Table 2 reports the asset ownership statistics reviewed in the figures above, as well as a summary of the descriptive statistics for other variables in this study. Again, we find that the gender gap for productive and consumption assets increased at a faster rate in technology-adopting than nonadopting households. We also find that the overall value of household assets increased much more in technology-adopting than nonadopting homes, suggesting that the aquaculture program stimulated asset accumulation. In addition, Table 2 shows that female heads in the study had an average of 1.3 years of formal schooling, and about 80 percent of the households in the study reported that women controlled at least one source of income. Finally, we also find that about 50 percent of the non-technology-adopting households were participating in a credit group in 1996, compared with nearly 80 percent of the households in which the fishpond technology was adopted.
Descriptive Statistics.

Note: BDT = Bangladeshi taka.
Likely adopters and non–likely adopters.
p < .10, *p < .05, **p < .01, and ***p < .001 (technology adopters vs. nonadopters).
In summary, the figures highlight some important trends in household asset ownership. First, we see that the value of assets owned by men and women increased between the two waves of the survey. The value of assets increased far more for men, however, than it did for women. Comparing technology adopters and nonadopters, we find that men in technology-adopting households increased in their ownership of assets more than those in nonadopting households. Concomitantly, the gender gap for consumption, productive, and total household durable assets increased to a greater extent in technology-adopting households than in those that did not adopt the fishpond technology. In 1996, there was not a significant difference between adopters and nonadopters in levels of the gender asset gap. Yet, by 2006–2007, technology-adopting households had a significantly larger gender gap than nonadopters. This is particularly surprising given that the women-based approach used by Banchte Shekha in the introduction of the agricultural technology was designed to alleviate gender inequality in adopting homes and communities. These initial findings suggest a possible backlash effect of the fishpond program whereby men garnered greater control of assets in households participating in the women-based aquaculture initiative. This could have occurred in at least two ways. Men may have felt justified in claiming sole ownership of assets if women in the household were involved in the fishpond program. Alternatively, men may have claimed ownership of new assets brought into the household as a result of women’s participation in the fishpond initiative.
Gender Asset Gap
To further examine the gender asset gap, we performed first-difference regression models to explore how macro, individual, and interactional aspects of the gender structure combine to shape this measure of intrahousehold gender inequality. Our analysis is presented in four models, each of which analyzes changes in the gender asset gap for a separate category of assets. Model 1 explores productive assets, model 2 analyzes ownership of consumption assets, model 3 focuses on jewelry, and model 4 presents our findings on the gender gap in overall ownership of household durable assets. The equation for each model is the same, only the variables measuring assets changes to reflect the focal category. The results of our analysis are located in Table 3.
First-difference Models Predicting Change in Gender Asset Gap Between 1996 and 2006–2007.

Note: Standard errors in parentheses. BDT = Bangladeshi taka.
Variable is standardized.
p < .10. *p < .05. **p < .01. ***p < .001.
The first model presents our analysis of the gender gap in productive assets. This category of assets was revealed in the descriptive statistics to be mostly owned by men, suggesting that productive assets are primarily male typed. Model 1 indicates that the gender asset gap is predicted to decrease in households identified as likely adopters of the fishpond technology (p < .05) when change in the value of asset ownership is held at its mean. For all households, an increase in the value of productive assets between 1996 and 2006–2007 coincided with an increase in the gender asset gap, but the size of this effect varied by technology adoption status. Changes in the value of productive assets had the largest effect in technology-adopting households, where a 1 standard deviation (equivalent to 19,002 BDT) increase in the value of productive assets predicted an increase in the gender asset gap of more than 18,000 BDT (p < .001). This effect was more than 1,000 BDT larger than the predicted effect for nonadopters and more than 4,000 BDT larger than what was observed for households identified as likely adopters, in which shifts in asset ownership had the smallest (although still large and positive) effect. At the interactional level, we find that an increase in the value of jointly owned assets between 1996 and 2006–2007 is associated with a decrease in the gender asset gap during that same time (p < .001), although this is expected because an increase in jointly owned assets decreases the number of assets available to be owned by either men or women. A better estimate of the effect of jointly owned assets may be obtained by examining the coefficient for the value of joint asset ownership at the time of technology introduction in 1996. Here, we find that levels of jointly owned productive assets in 1996 were not significantly associated with an increase in the gender gap in productive assets. Furthermore, model 1 shows a negative association between levels of the gender asset gap in 1996 and changes in the asset gap between 1996 and 2006–2007 (p < .001). Because nearly all households in the study experienced an increase in the gender asset gap in productive assets, this negative coefficient is most appropriately interpreted as indicating that households with a larger asset gap in 1996 experienced a less dramatic increase in the asset gap by 2006–2007 than households with smaller initial gaps. At the individual level of the gender structure, our analysis also reveals that the education of female heads is negatively related to the gender asset gap. The 2006–2007 gender gap in productive assets is predicted to be about 3,000 BDT smaller in households in which women heads had more than a primary education (five years of formal schooling) in 1996 (p < .001). Women’s control over some household income and participation in a credit group were not significantly related to the gender asset gap.
The second model explores the gender gap in consumption assets. Unlike productive assets, we find that likely adopters experienced an increase in the gender gap in consumption assets (p < .05) when change in the value of assets is held at its mean. In addition, model 2 shows that overall growth in the value of consumption assets between 1996 and 2006–2007 led to an increase in the 2006–2007 gender asset gap (p < .001) and that this growth was even larger in households adopting the fishpond technology (p < .001) and households identified as likely adopters (p < .10). A 1 standard deviation (equivalent to 26,173 BDT) increase in the value of household consumption assets is predicted to increase the gender asset gap by 21,000 BDT in nonadopting households not likely to adopt, by 24,500 BDT in nonadopting households likely to adopt, and by 25,500 BDT in technology-adopting households. Additionally, the second model also reveals that increases in the value of jointly owned assets predict a decrease in the gender asset gap between 1996 and 2006–2007 (p < .01). Unlike productive assets, we find that 1996 levels of jointly owned assets and asset gaps are not significantly related to shifts in the gender asset gap over time. Furthermore, we also find that women’s education was unrelated to changes in the consumption asset gap.
The third model in Table 3 presents the results of the first-difference equation predicting changes in the gender gap in jewelry assets. Jewelry, as highlighted in the descriptive statistics presented earlier, is different from other assets in that it is owned primarily by women. Second, unlike consumption and productive assets, we observed very little change between 1996 and 2006–2007 in the gender gap in jewelry ownership. This may explain why the first-difference equations, which were relatively strong predictors of the asset gap for productive and consumption assets, do not provide a similar amount of explanatory power when it comes to the gender gap in ownership of jewelry. Examining the effect of technology adoption status, we find that men’s ownership of jewelry in technology-adopting households is predicted to increase relative to women’s (indicated by a positive coefficient) when change in the value of jewelry between 1996 and 2006–2007 is held at its mean (p < .05). Additionally, we find that the gender gap in jewelry assets decreases as households increased in the value of jewelry owned between 1996 and 2006–2007 (p < .01). In other words, as households accumulated jewelry, it is more likely to be owned by women than men. This effect is consistent for technology-adopting, likely adopting, and nonadopting households. At the interactional level, we find that an increase in jointly owned jewelry is predicted to increase the gender gap in jewelry assets (p < .001), suggesting that men are claiming greater ownership of jewelry in households in which there is also an increase in jewelry that is owned jointly. Levels of jointly owned assets in 1996 were unrelated to shifts in the asset gap, while 1996 gender asset gaps had a negative relationship with changes in the gender gap over time (p < .001), suggesting that men did not accumulate a larger share of jewelry in households in which they already owned a relatively substantial amount in 1996. Women’s education, their control of income, and their participation in credit groups were unrelated to changes in the jewelry asset gap.
Finally, the fourth model in Table 3 analyzes the gender gap in total household durable assets (the cumulative sum of productive, consumption, and jewelry assets). Focusing on this broad measure of durable assets, we find that as households accumulate assets between 1996 and 2006, the overall gender asset gap is expected to increase for all households in the study, but especially those that were involved in the fishpond program (p < .001), while households identified as likely adopters experienced the smallest effect (p < .01). A 1 standard deviation increase in the total value of household assets (equivalent to 50,726 BDT) predicts about a 28,700 BDT increase in the 2006 gender asset gap for households that did not adopt the fishpond technology (p < .001), a 19,000 BDT increase among likely adopters (p < .001), and a 46,400 BDT increase for technology-adopting households (p < .001). Model 4 also shows that 1996 levels of joint ownership are related to an increasing gender asset gap over time (p < .01), suggesting that jointly owned assets may be appropriated by men or, at least, justify the further sole acquisition of assets by men. Additionally, as in previous models, we found that gender asset gaps were predicted to grow less rapidly in households that already had large gender gaps in 1996 (p < .001). Furthermore, we find that increases in the value of assets owned jointly between 1996 and 2006–2007 predicts a decrease in the gender asset gap (p < .001), which is expected given that growth in the value of joint assets decreases the assets available to be owned by men that would increase the asset gap. Finally, at the individual level, female heads’ education in 1996 was significantly related to changes in the gender asset gap between 1996 and 2006–2007. The gender asset gap is predicted shrink by nearly 7,000 BDT in households in which the woman head had more than a primary education in 1996 (p < .05). As with the previous models, women’s control over income and participation in a credit group were not significant predictors.
There are a number of key findings from the models reviewed above. First, it is clear that the adoption of agricultural technology did not achieve the intended effect of promoting gender equality, as measured by the gender asset gap. In fact, our findings suggest that the technology exacerbated the gender asset gap. As households accumulated assets between 1996 and 2006, those homes that participated in the fishpond program experienced a much more dramatic increase in the gender asset gap than homes that did not adopt the technology. Second, we found that early levels of joint asset ownership were associated with an increase in the gender asset gap between 1996 and 2006–2007, and this was particularly true for productive assets. This suggests that jointly owned assets may have been appropriated by men or that high levels of joint asset ownership in 1996 justified the subsequent accumulation of individually owned assets by men. Third, households in which the woman head had more than a primary education reported smaller asset gaps. Fourth, there are important differences in patterns of asset ownership across the categories of assets. Jewelry, in particular, stands apart from consumption and productive assets as being particularly female typed, with women being the primary owners of this asset. Ownership of productive assets was dominated by men. This remained true in both 1996 and 2006, despite some nominal gains in women’s ownership of productive assets. Consumption assets were also mostly owned by men, although women garnered a larger share of these assets by 2006–2007 than they did in productive assets. Levels of the gender asset gap tended to coincide with the gendering of the assets themselves, with the gap being most extreme in productive assets, somewhat large in consumption assets, and reversed in the case of jewelry. These patterns of asset ownership are particularly problematic when we consider that the assets which are most capable of generative activity for profit (productive assets) are also the ones that women rarely own. Such patterns suggest that asset ownership may be both a product of and contributor to persistent gender inequality.
Discussion
The results of this study highlight a number of important implications for gender scholars and development practitioners. First, we suggest that it is beneficial to frame analyses of development projects with gender structure theory. Our hypotheses were organized around each of the three dimensions of the gender structure, allowing us to conceptualize the multiple factors influencing the gender asset gap as they relate to ongoing gender processes and patterns.
At the macro level, our results were the opposite of what we expected in hypothesis 1. Women’s participation in the aquaculture program accelerated the accumulation of assets (particularly consumption and productive assets); this, in turn, exacerbated the gender asset gap to a greater extent in homes that participated in the fishpond program. Such unintentional results of gender-sensitive agricultural development initiatives are, unfortunately, not uncommon (Johnson et al. 2016; Quisumbing, Meinzen-Dick, et al. 2014; Quisumbing, Rubin, et al. 2014). In this study, we are unable to determine whether it was the type of technology (fish polyculture), or the particular modality of women-only groups through which it was introduced that may have caused these negative effects. Nonetheless, these findings suggest that development practitioners working with projects that have similar characteristics as the one examined here should be cautious and mitigate for such negative outcomes.
At the interactional level of the gender structure, we found that the relationship between 1996 levels of jointly owned assets and changes in the gender asset gap was in the opposite of what we expected in hypothesis 2a. Our analysis revealed that early levels of joint asset ownership were related to an increase in the gender asset gap over time, suggesting that men in homes with higher joint ownership tended to appropriate jointly owned assets or, alternatively, that initial levels of joint ownership provided a justification for men’s accumulation of solely owned assets in the future. Also at the interactional level, we found that 1996 levels of gender inequality, as measured by the baseline gender asset gap, were associated with less dramatic increases in the gender asset gap over time, rejecting hypothesis 2b. This finding was surprising, because we expected that households with initially high levels of gender inequality would only get worse over time. Unfortunately, however, this result suggests that households with small gaps in 1996 were likely to catch up to households with larger gender gaps during the 10 years covered in the study.
At the individual level of the gender structure, we found strong support for hypothesis 3. Households tended to have a smaller gender asset gap when the female head had completed more than five years of formal education. Although expanding public education opportunities is beyond the scope of agricultural development programs, encouraging school enrollment, especially for women, can support the primary goals of these organizations that include women’s economic and market opportunities as a central tenet.
At the same time that gender structure theory provides a framework for focusing on each of the three primary dimensions of gender, it also highlights the fact that these dimensions are interconnected and mutually constitutive. Take, for example, the finding that the adoption of aquaculture stimulated asset accumulation which, in turn, was related to larger gender asset gaps in technology-adopting than nonadopting households. Previous research has found that inequalities in asset ownership and access to resources at the time of technology adoption can set a problematic trajectory whereby benefits from the innovation will accrue primarily to men but not women (Quisumbing, Rubin, et al. 2014). Examining agricultural development programs in Mozambique, Bangladesh, Burkina Faso, and Uganda, Quisumbing and colleagues found that agricultural innovations are often more advantageous to those who have the resources to better mobilize training and new techniques. Gendered patterns such as these in ownership of assets and access to resources are played out at the interactional level of the gender structure, but they are also shaped by widespread cultural assumptions about men’s control over land, capital, and resources as well as state bureaucracies that make it easier for men to access critical services (Moghadam 2004). At the same time, women’s levels of education and the human and cultural capital implicated therein may play a crucial part in intrahousehold interactions between men and women. Of course, however, women’s access to education is shaped to a large degree by the opportunities made available by the state.
In short, the gender structure becomes immensely complex once we investigate the interrelated processes among the three primary dimensions. This complexity may provide a more accurate portrayal of gender, but it is also difficult both to study and to change. By provisionally separating the analytic components of the individual, interactional, and macro dimensions of the gender structure, as we have done in our assessment of the aquaculture initiative in the Jessore District, we propose that development practitioners and researchers can begin to map out the complex forces involved in gender. As development programs grapple with how to mainstream gender or create gender-transformational projects, our findings suggest that using gender structure theory may be an effective framework for understanding the way organizational interventions influence and are shaped by multiple dimensions of the gender structure in adopting communities. Most of the time, agricultural development programs will take the form of a macro-level influence because they are introduced by organizations that exist outside the everyday lives of people. When crafting such initiatives, development programs risk doing more harm than good if they do not consider the complex relations among the macro, interactional, and individual dimensions of the gender structure.
Conclusion
By analyzing the impact of agricultural technology through the lens of gender structure theory, we were able to uncover valuable information about how the effects of fish polyculture, as a macro-level input, are shaped by preexisting gender dynamics to alter patterns of asset ownership. Despite the women-focused approach used in Banchte Shekha’s fish polyculture program, the adoption of this technology unintentionally exacerbated the gender gap in asset ownership. Yet higher levels of women’s education helped stymie growth in the asset gap. Changing individual human capital may increase the likelihood of success in programs aiming to improve women’s status. But we suggest that other levels of the gender structure, particularly interactional expectations and cultural values, must also be considered. These findings illustrate the utility of thinking about development initiatives in terms of their relation within a complex multidimensional gender structure and always being mindful that men are important, powerful players in the gender structure and need to be included in work that hopes to be gender transformational.
Footnotes
Acknowledgements
We would like to thank Emily Whitmer and Rachel Gordon for their valuable feedback and comments. We are also grateful for the feedback provided by conference attendees at the International Sociological Association’s Forum of Sociology in Vienna, Austria, at which a version of this article was presented in July 2016.
1
In the language of the survey, the label household head was given to male household members who were identified as the leaders of the homes. In the absence of a male leader, a woman was sometimes given the label of household head in the survey, although this was extremely rare (only 28 cases in total). The household members we are calling female heads were almost always labeled wives in household surveys. This label, however, was unrelated to marital status, as some women who were labeled wives were not necessarily married. The wife label was instead used to identify the female counterpart to the male head in the household. To avoid any confusion, we use the term female head to refer to the women who were categorized under the label wife in the household status surveys as well as those few women who were identified as the household heads.
2
Although these variables could possibly vary by time, we treat them as time invariant in our analysis because they were measured only in the first wave of the survey.