
Abstract
Income and wage inequality between gender and other social groups is commonly evaluated by the difference in average income or the decomposition of the total amount of inequality into between-group and within-group components using an inequality measure such as the Theil index. Either approach ignores the dispersional difference between social groups, often manifested in glass-ceiling and glass-floor effects. The author introduces a refined Theil decomposition that offers two ways of capturing such between-group distributional differences. An analysis of income data from 10 European countries illustrates the usefulness of the proposed evaluation and decomposition methods.
This article concerns the measurement of inequality in general and the evaluation of gender wage inequality in particular. Research has shown that macro-level gender inequality can have effects on micro-level behavior and attitudes (Fuwa 2004). Macro-level gender inequality can manifest itself in several ways, one of which is a gender wage gap. Two of the inequality measures commonly used for evaluating income inequality are the Gini coefficient and the Theil index (see, e.g., Charles-Coll 2011), though the Theil index is preferred (Allison 1978). The Theil index of inequality has been widely applied in the social sciences; one reason for its popularity is its decomposability (Akita 2003).
Gender wage inequality can be simply viewed as a gap between the average men’s and women’s wages. Whereas gender pay gaps have gradually narrowed in many developed societies, such as the United Kingdom, it is at the top end where the gap is much wider, as recently observed in the news media: wages for those British women who are presumed to be at the peaks of their professional careers are much lower than those of their male counterparts (De Piero 2015). The phenomenon of a wider pay gap between the sexes at the top is better known as the “glass ceiling” effect and has been the focus of much recent empirical research (Albrecht, Björklund, and Vroman 2003; Arulampalam, Booth, and Bryan 2007; Christofides, Polycarpou, and Vrachimis 2013; Cotter et al 2003). A similar pattern can be found at the bottom end of the pay distribution, known as the “sticky floor” or “glass floor” effect, indicating one social group is less likely than another to be low-income earners (Christofides et al. 2013; McKnight 2015; Reeves and Howard 2013).
It follows that a conventional inequality measure, despite its decomposability, fails to capture such glass-ceiling and glass-floor effects. In other words, gender inequality in income cannot be understood as a simple difference in mean income between the sexes. Rather, to properly evaluate gender inequality when glass-ceiling and glass-floor effects are present, one must focus not just on differences in the mean but also differences in dispersion and distribution. Note that there are other approaches to studying different segments of distribution, especially the method of quantile regression pioneered by Koenker and Bassett (1978). Quantile regression can be readily applied to analyzing glass-ceiling and glass-floor effects in income distributions (see, e.g., Christofides et al. 2013; Melly 2005). Such an approach can provide a detailed analysis of the mechanisms generating the inequalities reflected by glass-ceiling and glass-floor effects. However, an inequality index such as the Gini coefficient or the Theil index remains a powerful and useful method for measuring inequality. The Theil index, despite its popularity (due largely to its decomposability), is as yet incapable of recording dispersional differences in income distributions. The objective of this research, then, is to fill the gap and refine the Theil index so that it can reflect both the average and the distributional differences and variations.
To illustrate the problem at hand in a plain manner, consider a simple hypothetical income data set consisting of two groups with 15 cases each in G1 and G2:
G1: [1, 2, 2, 2, 3, 3, 3, 3, 3, 4, 4, 5, 6, 8, 10]
G2: [1, 2, 2, 3, 3, 3, 3, 4, 4, 4, 4, 5, 6, 7, 8]
The means of the two groups in the data set are equal, with the mean of G1 = the mean of G2 = 3.933. Theil’s (first) measure of inequality gives a value of .134. Performing the standard decomposition of the Theil index, we obtain a between-group component of .000 and a within-group component of .134, indicating that there is no inequality between the two groups, with the inequality found entirely attributed to within-group variations. Figure 1 gives a visual comparison of the kernel density distributions of the two groups, showing that the first group has a heavier upper tail than the second. (Kernel density is a nonparametric method for estimating smooth probability density distributions of empirical data.)
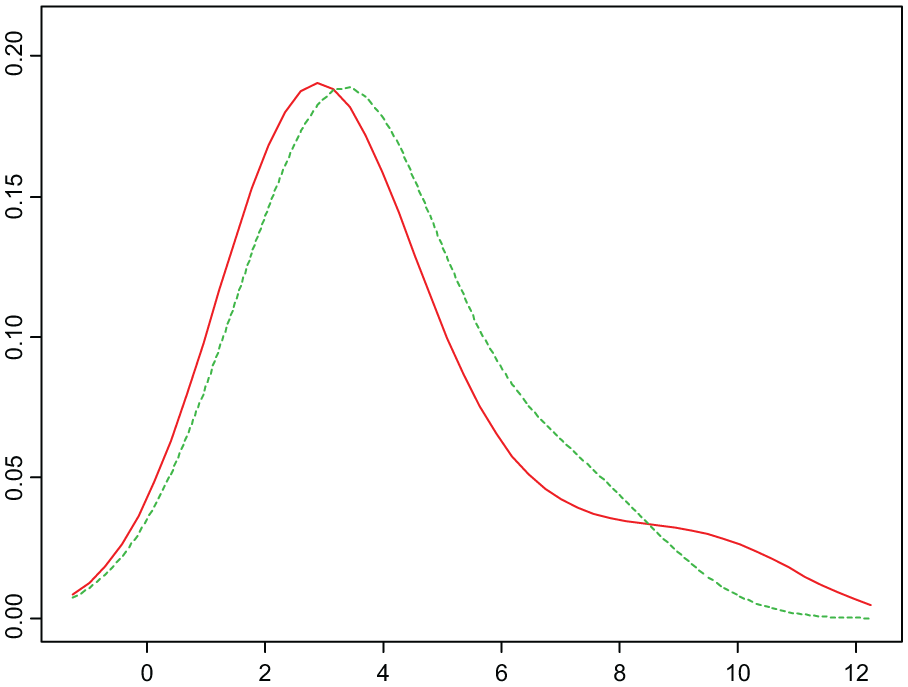
Kernel Density Distributions of the Two Groups in the Hypothetical Data Set.
In this simple example, the conventional Theil decomposition provides no information about the shapes of inequality beyond a simple comparison of the means. Examining the distributions in the groups, we see that G1 has a case with a value 10, above the maximum or the ceiling of the value 8 in G2. It becomes apparent that differences in dispersion, manifested here in a ceiling effect, should be taken into account when evaluating inequality.
To anticipate the conclusion, we apply one of the two approaches introduced later to the data. This method further decomposes the within-group component into the two subcomponents of inequality contributed by shared dispersion and by floor and ceiling effects, or differences in dispersion. Applying this method, the within-group component from G1 and G2 is further decomposed into a shared-dispersion component of .055 and a different-dispersion component of .079. This particular approach focuses on shared versus different dispersions. We will introduce another, quantile-based approach that decomposes inequality in each of the quantiles separately. Income distributions are typically non-normal, and a quantile analysis of income inequality has been the choice of many researchers. Naturally, evaluating income inequality can benefit from a quantile-based approach.
Broadly speaking, the research reported here follows up on studies of the evaluation of between-group and between-class inequality (Jasso and Kotz 2008; Liao 2006). It also follows up on a research tradition that deals with group heterogeneity within the world and within a country by applying methods of decomposition that break down individual inequality into between-group and within-group components to study inequality across nations or blocks of nations (Bourguignon and Morrison 2002; Firebaugh 1999, 2000; Goesling 2001; Schultz 1998) or across social groupings within nations such as gender, race/ethnicity, or social class (Jenkins 1995; Schultz 1998; Yitzhaki 2002). The research in this paper is perhaps more related to a report on the status of inequality in the United Kingdom, where differences are found not only between the mean levels of outcomes such as education, income, and wealth of social groups such as gender, ethnicity, and age but also between the ranges or variations in such outcomes of these groups (Hills et al. 2010). A lesson learned from their analysis is that studying only averages can be misleading without also analyzing these variational or dispersional differences, which are the focus of this article.
In the section below, we provide a brief review of the Theil index and its decomposition, followed by a section introducing the two refined approaches, one distinguishing between shared and different dispersions and the other using a quantile-based method for evaluating different dispersions in inequality. We then apply the two methods to income data on 10 European countries from the Luxembourg Income Study (LIS). The proposed methods and their application allow us to draw some conclusions in a final section.
Theil’s Decomposition
The Theil index of inequality, originally proposed by Theil (1967), is one of the two most widely applied inequality measures (the other being the Gini coefficient). Unlike the Gini coefficient, however, the total amount of inequality measured by the Theil index can be cleanly decomposed into the two additive parts of between-group and within-group inequality.
The total amount of inequality measured by Theil’s T or first measure is

where xi is the income of individual i,

where yk is the kth group’s income share expressed as a proportion of the sample or population total income, and

where yik is the income share of the ith individual within the kth group, and xik is the ith individual’s income within group k. The decomposition is additive because equations 2 and 3 sum to equation 1. Theil’s decomposition has been popular in the economic and social sciences and has long been incorporated in popular statistical software packages such as Stata (Jenkins 1995, 1999; Jenkins and Van Kerm 2009). Theil’s decomposition finds many applications, including nested decomposition for multilevel data such as a three-level structure of region, province, and district (Akita 2003). A similar formulation for the second Theil measure is performed by switching the role of the income share and population share variables, but it is not given here to save space.
Capturing Glass-ceiling and Glass-floor Effects in Inequality
To refine our evaluation of inequality by taking into account glass-ceiling and glass-floor effects, we consider two different approaches. The first focuses on a further decomposition of the within-group component of inequality (equation 3) into two subcomponents, one measuring shared dispersion by the groups and the other recording different dispersion between the groups. The second method takes a quantile-based approach.
Method 1
To measure the shared portion in the distributional spreads of the groups and the portion outside of the shared spread of the distributions, we must establish the criterion for the shared spread or shared dispersion. One straightforward and practical definition is to use the observed shared range of the distributions of the G groups [l, u], where l represents the largest (or the maximum) of the G number of minimum values of the G distributions and u represents the smallest (or the minimum) of the G number of maximum values of the same distributions. This way, equation 3 can be separated into the two components:

where the y terms with subscript a are income shares based on the cases satisfying the shared-spread criterion of [l, u], the x terms with subscript a are corresponding individual income values, and the y and x terms with subscript b are income shares and income values, respectively, that do not satisfy the shared-dispersion criterion.
Method 2
Because income distributions are typically skewed, social scientists often study them with quantile analysis of various kinds, from quantile-quantile plots to quantile regression. Thus, it should be informative to analyze G income distributions by quantile. For example, to understand the glass-ceiling and glass-floor effects, we may wish to study how men and women differ in the top decile or in the bottom decile of the income distribution. To accomplish this objective, we rely on the recursive nature of the Theil index by first decomposing the overall inequality into the two components of between-quantile and within-quantile inequality. Using the same notation, the Theil index in equation 1 is now decomposed into a between-quantile component and a within-quantile component as the first and the second items on the right-hand side of equation 5:

where yq is the income share of the qth quantile group out of the total income of the Q number of groups,
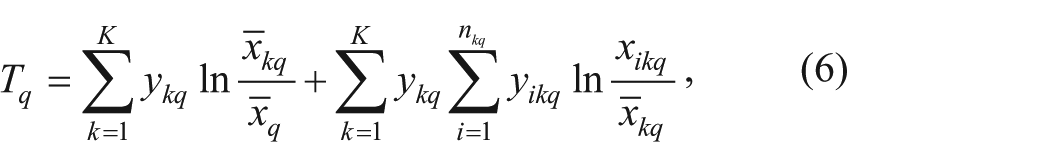
where ykq is the income share of the kth group within the qth quantile,
On the following pages, we focus on method 2a because we can meaningfully compare the between-group component of a top or bottom quantile with the same component of a middle quantile by using this method. For example, two common inequality measures are the 90:50 and 50:10 (or 10:50) ratios (Leigh 2007). Similarly, we may form ratios of the between-group component of a top quantile or a bottom quantile to the between-group component of a middle quantile. Ratios of pairs of quantities form odds, which can be interpret as the likelihood of event occurrence. To appropriately understand such odds, we follow the framework of model comparison via the Bayesian information criterion (BIC). Taking twice the natural logarithm of the Bayes factor (which is formed by the ratio of the two likelihoods from two models) gives rise to a difference in BICs, and Kass and Raftery (1995) provided a set of useful guidelines for interpreting BIC differences: 0 to 2, not worth a bare mention; 2 to 6, positive evidence; 6 to 10, strong evidence; and greater than 10, very strong evidence. Similarly, we take twice the natural logarithm of two wbq terms and use the suggested guidelines for interpreting the results in our application section.
Summary
To summarize the proposed methods of decomposition, we present a schematic comparison of the two new methods of Theil decomposition with the conventional Theil decomposition in Figure 2. The conventional Theil decomposition divides the amount of inequality into two additive parts of a between-group component (in red) and a within-group component (in green).

A Schematic Comparison of the Three Methods of Theil Decomposition.
In this figure, we use the same color (or hue) to indicate the same type of components. Method 1 of the refined Theil decomposition further divides the within-group component into two subcomponents: a different-dispersion component that captures the contribution of differences in dispersion (in blue) and a true within-group, shared-dispersion component (in green).
Method 2 is quantile based and involves a two-step decomposition. It decomposes the total inequality into a between-quantile component (in gold) and a within-quantile component (in various shades of turquoise and olive colors) and then further into a set of within-quantile between-group components (in various turquoise shades) and a set of within-quantile within-group components (in various olive shades). The schematic example in Figure 2 shows four quantiles (or quartiles here), with each shade representing a specific quantile (or quartile).
To calculate twice the natural logarithms of the ratio between two wbq terms for an analysis in which quintiles are used, for example, we compute 2log(wb5/wb3) and 2log(wb1/wb3), respectively, for capturing glass-ceiling and glass-floor effects. When the analysis uses decile as the quantile of choice, we compute 2log(wb10/mean[wb5, wb6]) and 2log(wb1/mean[wb5, wb6]), respectively, to evaluate glass-ceiling and glass-floor effects. Both methods 1 and 2 (including the alternative method 2b) are programmed as an R function for both Theil’s first measure and Theil’s second measure (Appendix A). The plan is to make this function also available as a Stata ado module in the future.
Analyzing Gender Wage Inequality in 10 European Countries
Descriptive Analysis
For an empirical analysis, we examine 10 European countries—Austria, Belgium, France, Greece, Hungary, Ireland, Italy, Luxembourg, Russia, and Spain—by using data from the LIS. The LIS harmonizes national survey data on income and wealth from many European countries and some non-European countries. For this example, we selected all LIS countries in Europe with surveys conducted close to one another in time (in or within one year of 2000) that provided net wage data in actual local currency values (instead of in grouped categories). Net or post-tax income or wage data in local currency for sampled individuals were gathered on surveys from these countries, and natural income values from the past 12 months for men and women who declared working as their main activity at the time of the survey were used in the analysis. There is no need to convert the local currencies to a common currency, because the Theil index, as a member of the generalized entropy family, is scale independent.
To get a sense of men’s and women’s net income differences, we summarize the median, top 1 percentile, and maximum income values of these countries by sex in Table 1. Even though the income data are in local currencies, the chief purpose of this table is to compare incomes between the sexes in the same countries. A few quick observations are in order. First, men’s net wages were universally higher than women’s at any point of the income distribution, be it the median, the top 1 percentile, or the maximum. Second, this gender wage gap widens when moving up a distribution; the higher up in the income distribution, the wider the gap. Third, the distance between the maximum and the top 1 percentile is much greater for men than for women. Both the second and the third observations suggest a glass-ceiling effect. To assess the difference in spread or dispersion of the income distributions, we can also examine coefficients of variation, which are reported in Appendix B, though for the sake of brevity, we do not focus on them in the main text.
Medians, Top 1 Percentiles, and Maximums of Net Wages in Thousands by Sex in 10 European Countries, circa 2000.

Note. All wages are reported in local currency.
To visually examine the actual gender-specific income distributions from these 10 countries, we present kernel density plots of these income distributions by gender in Figure 3. The kernel density plots by gender allow us to compare income distributions in each country in terms of the shape and the spread of the distributions.
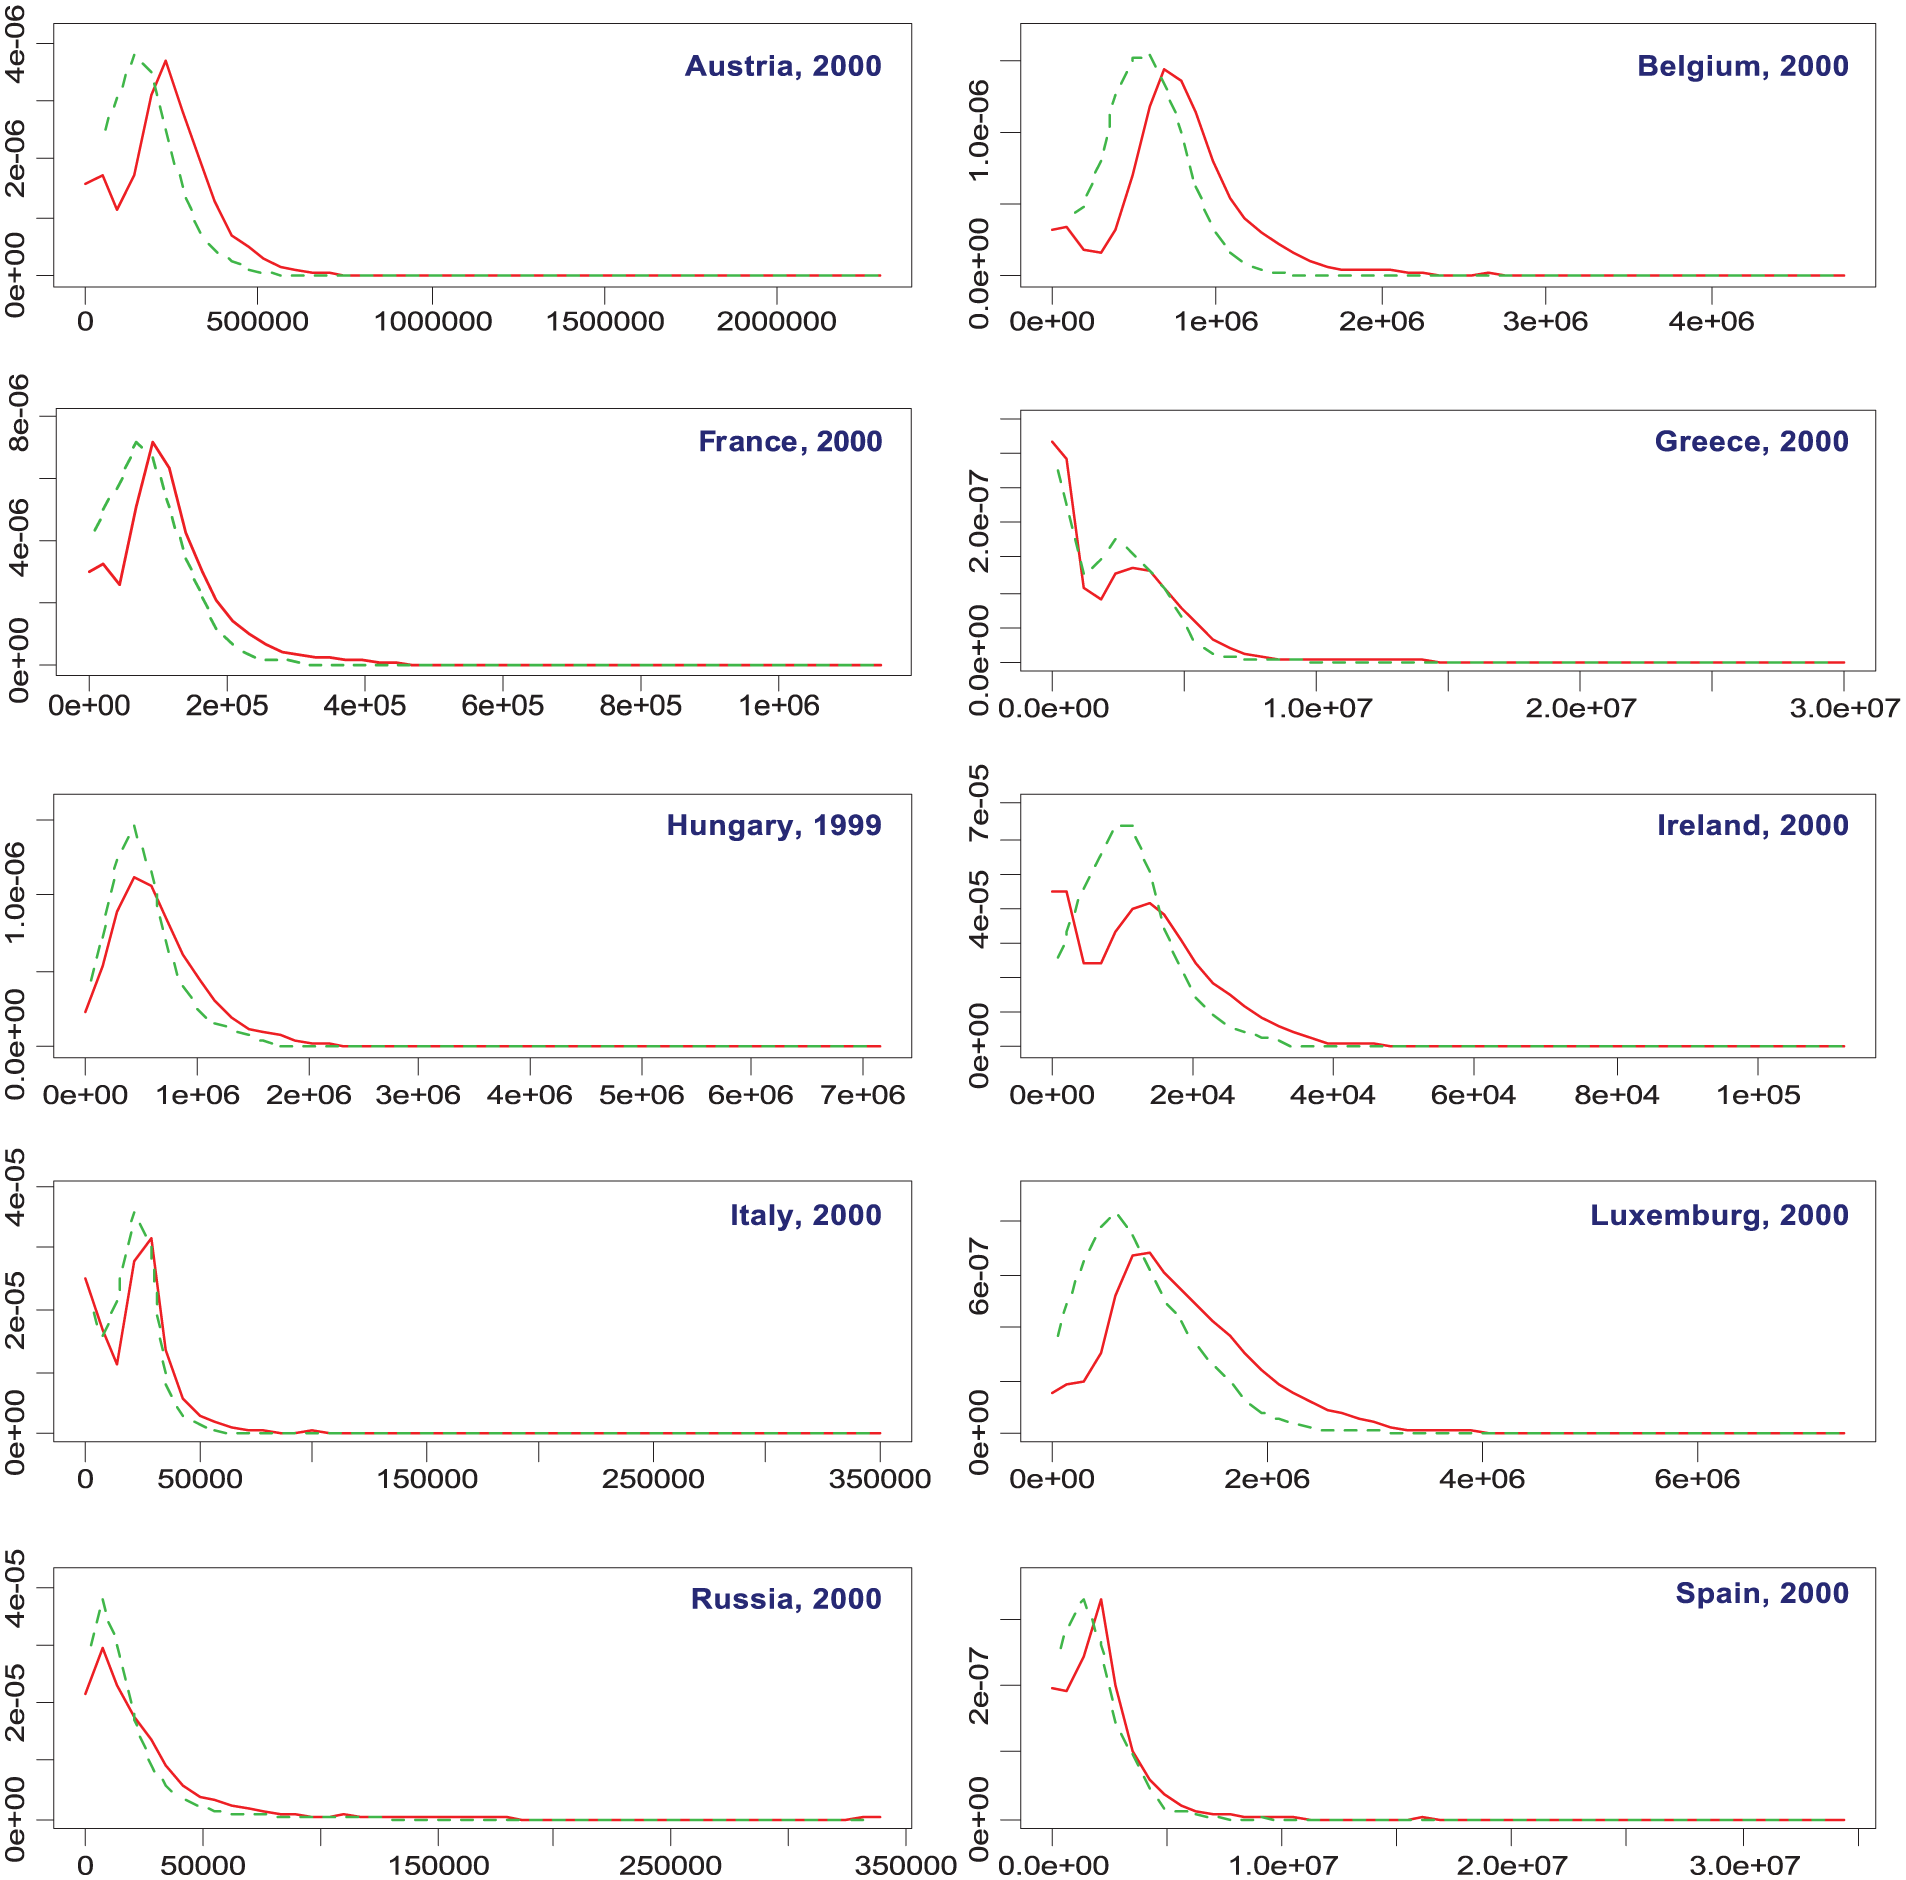
Kernel Density Distributions of Net Wages in 10 European Countries, circa 2000.
With the exception of Russia, the peaks of men’s wage distributions are all noticeably higher than the peaks of women’s distributions. With the exception of Italy, the left tails of women’s distributions are all heavier than men’s. In all countries, men’s distributions tend to spread out more to the right (i.e., earning higher wages). All these observations suggest a male advantage in earning power in all 10 countries.
Analysis of Gender Wage Inequality via Method 1
Table 2 presents the Theil index decomposition, using both the conventional method and method 1 introduced earlier. The first three columns contain the standard Theil decomposition, and the last two columns contain a further decomposition of the conventional within-group component into the shared-dispersion subcomponent (the “Withinw” column) and the different-dispersion subcomponent (the “Withinb” column).
Theil Index Decomposition of Income Inequalities in 10 European Countries, circa 2000.

Note. The within-component decomposition reported in the first row for each country is performed using the shared-spread criterion and in the second row, the percentages of the within-within and the within-between components of the overall within-group component.
Judged by the total amount of inequality evaluated by the Theil index, Belgium has the lower amount of income inequality among the 10 countries around 2000, while Greece and Russia have the highest. Russia’s average gender wage gap appears to be the widest among the 10 countries (.027 of the between-group component), and Italy’s average gender wage gap is the lowest of the group (.002 of the between-group component). It is important to note that none of the between-group component values are above 10 percent of their respective total inequality.
An analysis of inequality such as this hides the glass-ceiling and glass-floor effects. To further investigate such effects, we applied method 1 by decomposing the within-group component into a shared-dispersion subcomponent and a different-dispersion subcomponent and report the results in the last columns of Table 2. The values in these two columns add up to the values in the within-group component of the middle column. This method enables us to see clearly the total effects of the glass ceiling and glass floor. Greece, for example, shows the second to lowest level of between-group inequality, even though it exhibits the highest level of total inequality. Relying on the conventional Theil decomposition, we would stop there. The new results show that about 17 percent of the within-group inequality or 16 percent of the total inequality is actually explained by differences in dispersion or distribution. The highest percentage explained out of the within-group inequality belongs to Luxembourg. However, we should not deduce that the glass-ceiling and glass-floor effects in that country were very high in 2000, because its total amount of inequality came out rather low (at .226). Because the Theil index is scale free, its decompositions are scale free too. The country with the lowest level of glass-ceiling and glass-floor effects is Belgium (a value of .005). After Greece (a value of .114), the country with the next highest level of glass-ceiling and glass-floor effects was Russia in 2000 (a value of .091).
Analysis of Gender Wage Inequality via Method 2
The results presented above reveal the combined effects of the glass ceiling and glass floor. To fine-tune our analysis, we present in Table 3 results from an application of method 2 (specifically method 2a), which enables the researcher to separately assess glass-ceiling and glass-floor effects. For the analysis presented in the table, we restricted the data by analyzing only those cases with wage values above zero. Zero income values would render the computation of the subcomponents of the lowest quantiles (in this case decile) of several countries undefined. Furthermore, glass-floor effects are typically defined for those with actual income (i.e., members of one social group earn a higher level of income and do not slip below members of another group for social structural reasons). In addition, the purposes of the two analyses are different, and we are not interested in a direct comparison of the two sets of results from the analyses.
Between-gender 90:50 and 10:50 Inequality 2 × Log-ratios on the Basis of Theil Index Decomposition of Net Wage in 10 European Countries, circa 2000.
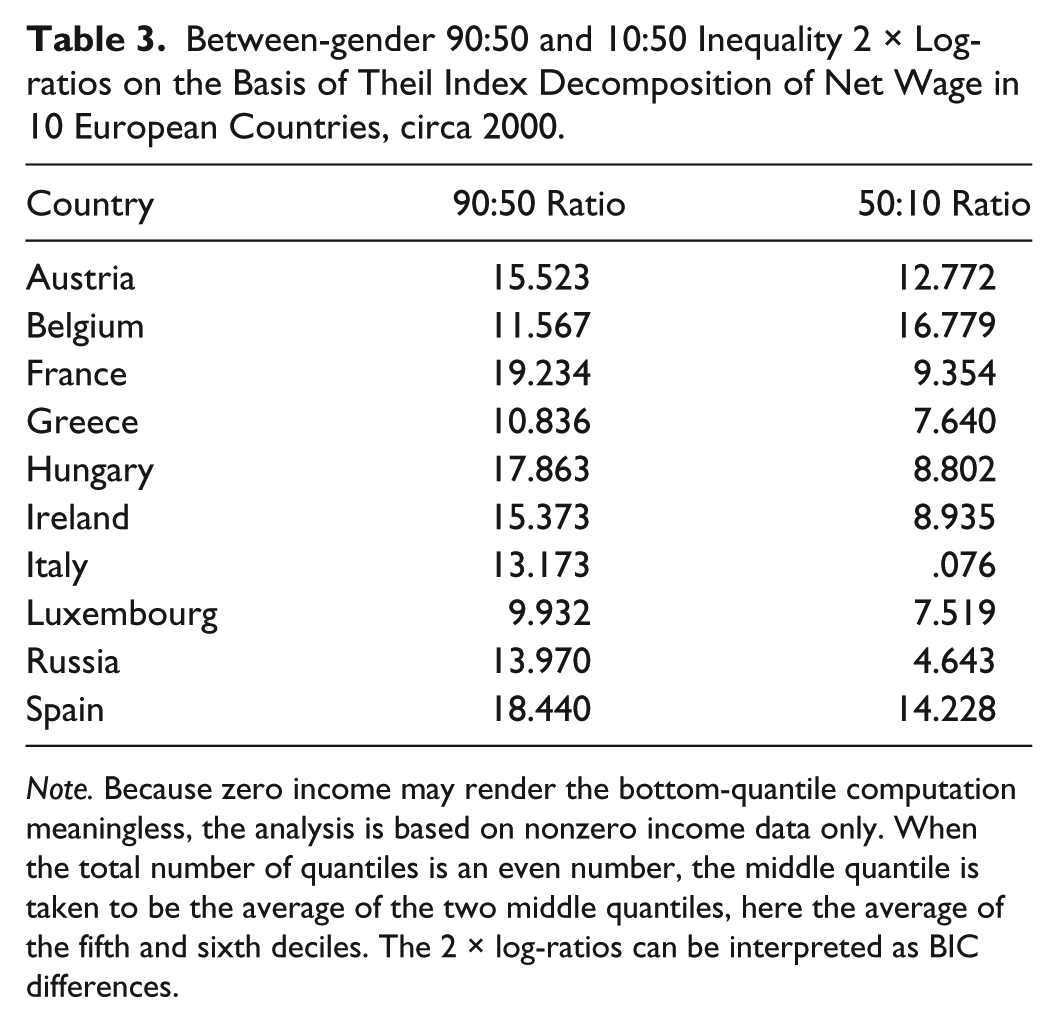
Note. Because zero income may render the bottom-quantile computation meaningless, the analysis is based on nonzero income data only. When the total number of quantiles is an even number, the middle quantile is taken to be the average of the two middle quantiles, here the average of the fifth and sixth deciles. The 2 × log-ratios can be interpreted as BIC differences.
In this table, we present the 90:50 and the 10:50 inequality ratios in their 2 × natural logarithm forms. Using the middle segment of the income distribution as a referent, the evidence of a glass-ceiling effect is very strong for 9 of the 10 countries (2 × log[90:50 ratio] > 10), and the evidence is still strong for Luxembourg (2 × log[90:50 ratio] between 6 and 10). The evidence for a glass-floor effect, however, is somewhat weaker for 9 of the 10 countries, except for Belgium, where the evidence for a glass-floor effect is even more substantial than that for a glass-ceiling effect. Of the 10 countries, the evidence for a glass-floor effect is very strong for Austria, Belgium, and Spain (2 × log[10:50 ratio] > 10), strong for France, Greece, Hungary, Ireland, and Luxembourg (2 × log[10:50 ratio] between 6 and 10), and positive for Russia (2 × log[10:50 ratio] between 2 and 4). There is no evidence for a glass-floor effect for Italy (2 × log[10:50 ratio] < 2). Even though the size of a log-transformed ratio is comparable across countries, we caution here that the computation is relative to the amount of within-middle-quantile between-group inequality. For example, relative to the rather small amount of within-middle-quantile between-group inequality in Belgium, the amounts of glass-ceiling and of glass-floor inequality are comparatively rather high. Therefore, one may only interpret these findings within the context of each country. In comparison, the results produced by method 1 reported in Table 2 can be compared across countries in absolute terms.
Summary Discussions
What do the results suggest? A full explanation of the gender gap found is beyond the scope of this research, because there can be many social factors at work, including differences in the qualifications of men and women, differences in the treatment of equally qualified women, and the differential prices the labor market places on work skills in each country (Blau and Kahn 1992). In this article, we focus only on the institutional differences across countries. On a theoretical level, the amount of inequality embodied in gender-based differential distributions of income can be indicative of the type of the welfare state in a society, because the welfare state generates differentiation in decommodification and social stratification in a society, as discussed by the literature on welfare policy research initiated by Esping-Andersen (1990) and modified, refined, and reviewed by many other scholars (Arts and Gelissen 2002; Bonoli 1997; Ferrera 1996; Ferragina and Seeleib-Kaiser 2011; Leibfried 1992; Shalev 1996; Siaroff 1994). In the present example, we do not have any social democratic countries. Six of the 10 countries belong to the conservative democratic type: Austria, Belgium, France, Ireland, Italy, and Luxembourg (Italy can be grouped primarily with the conservative democratic type and secondarily with the Mediterranean type; see Ferragina and Seeleib-Kaiser 2011). Three countries stand out in the analyses reported in Tables 2 and 3: Greece, Russia, and Spain. Greece and Russia have the highest values of the component (Withinb) contributed by different dispersion (Table 2), and Spain is found to have the highest combined 90:50 and 10:50 ratios (being the only country with the combined log-ratios greater than 30).
Greece and Spain belong to a type of welfare systems termed the Latin rim (Leibfried 1992), late female mobilization (Siaroff 1994), or southern (Bonoli 1997; Ferrera 1996), which is also known as the Mediterranean type (Ferragina and Seeleib-Kaiser 2011). The criticism of the original Esping-Andersen (1990) typology of insufficient sensitivity to gender inequality and the proposal by Siaroff (1994) of a late female mobilization type of welfare state regime are particularly relevant here. Citizens from this Mediterranean or late female mobilization type were found to desire equality more than their counterparts in the conservative democratic countries, while citizens from social democratic regimes were found to desire equality less than the reference category (Arts and Gelissen 2001). The findings there suggest that people in more stratified societies tend to desire more what is wanted, and vice versa.
Russia is a more complicated case. Fenger (2007) expanded the research on welfare state typology to include Eastern European countries by establishing a former Soviet Union type that includes Belarus, Estonia, Latvia, Lithuania, Russia, and Ukraine and found in this type a level of inequality higher than that for the conservative democratic and the social democratic regimes (though not quite as high as that for the liberal regime). In addition, inequality, especially gender inequality, increased in transitional former socialist societies such as China and Russia following the onset of their respective market reform or transition. Therefore, it is not surprising that the total between-gender distributional difference is found to be higher in Russia, a postsocialist society in transition, than most other countries.
Conclusion
In this article, we identified a characteristic problem of conventional inequality measures, especially the Theil index and its decomposition, when applied to analyzing group-based inequality. Such measures and their decomposition hide differences in dispersion and distribution, in particular the well-known glass-ceiling and glass-floor effects in gender wage inequality. To deal with the problem, we introduced two new approaches. Method 1 further decomposes the conventional within-group Theil inequality component into the two subcomponents representing shared dispersion and different dispersion. This method does not distinguish between glass-ceiling and glass-floor effects.
To separate the two effects, we then introduced a quantile-based Theil decomposition that assesses glass-ceiling and glass-floor effects separately via two times the log-transformed 90:50 and 10:50 ratios. Applying the two methods in an analysis of the income data from 10 European countries, we were able to gain some new knowledge about gender-based income inequality that was not possible using the conventional measures. We were able to compute the relative amount of inequality (in terms of the Theil measure) out of the total amount of inequality via method 1, and the subcomponent of between-group dispersional difference inequality is comparable across countries. Method 2 provides additional insight into the relative size of glass-ceiling and glass-floor effects within the context of a specific country. This relative understanding is useful in its own right: if a country’s gender-based inequality is small in the middle range of the distribution but relatively large at the bottom and at the top, then the government of the country should continue to work toward removing the barriers of such glass ceilings and glass floors.
Similar to the application of conventional inequality measures, sample sizes including those based on national surveys must be sufficiently large so that the results will not be greatly affected by a few influential cases (as shown in the simple illustrative example in the introduction). Also, it is desirable to use the two methods together for studying the shape of inequality, gender based or otherwise. Similar analysis can be applied to studying race-based inequality, country-of-origin-based inequality, and inequality based on another social-structural factor. Similar to a multidimensional decomposition of a conventional Theil index, we may perform the refined analysis here by taking into account of both gender-based and race-based inequality and by applying the methods introduced using a cross-classified grouping variable. An analysis of both gender-based and race-based inequality may provide a positive answer to the twin questions raised by Browne and Misra (2003) of whether the two systems of gender and racial wage inequality intersect and, if so, whether the processes creating racial wage inequality exacerbate gender inequality.
From a social policy point of view, to achieve equality, a significant level of between-group inequality (in group means) calls for Hills et al.’s (2004) between-group redistribution, and a significant level of between-group inequality in dispersion requires Hills et al.’s (within-group) vertical redistribution differentially for the groups. To solve the problem at its root, fundamental reforms are necessary to implement a fair and equitable policy of equal participation and equal pay for all jobs and occupations.
Footnotes
Appendix A: R Program for the Proposed Methods
Appendix B: Coefficients of Variation in Net Wages for 10 European Countries,circa 2000

| Men |
Women |
|||
|---|---|---|---|---|
| CoV | n | CoV | n | |
| Austria | .732 | 1,629 | .724 | 1,135 |
| .574 | 1,410 | .516 | 943 | |
| Belgium | .568 | 1,406 | .538 | 1,126 |
| .468 | 1,296 | .442 | 1,044 | |
| France | .793 | 5,719 | .704 | 4,698 |
| . 685 | 5,162 | .624 | 4,366 | |
| Greece | 1.230 | 2,598 | 1.001 | 1,392 |
| .654 | 1,477 | .486 | 859 | |
| Hungary | .773 | 719 | .973 | 692 |
| .754 | 706 | .966 | 687 | |
| Ireland | .842 | 2,058 | .631 | 1,318 |
| .549 | 1,567 | .549 | 1,227 | |
| Italy | .863 | 5,018 | .684 | 3,004 |
| .537 | 3,706 | .475 | 2,508 | |
| Luxembourg | .634 | 1,621 | .661 | 969 |
| .578 | 1,543 | .617 | 931 | |
| Russia | 1.371 | 1,629 | 1.222 | 1,657 |
| 1.159 | 1,326 | 1.056 | 1,406 | |
| Spain | .890 | 3,233 | .793 | 1,813 |
| .652 | 2,571 | .613 | 1,530 | |
Note. Coefficients of variation are obtained for each country for those without income (first row) and for those with nonzero income (second row).
Acknowledgements
I wish to thank Thierry Kruten and Teresa Munzi at the LIS for their assistance with data processing; the anonymous reviewers and the editors of Socius for their comments; and Glenn Firebaugh, Leo Goodman, Shin-Kap Han, Stephen Jenkins, and Shlomo Yizhaki for their feedback on earlier versions of a related paper. The current version is entirely rewritten, with the core measures redeveloped. Therefore, any errors remain my own.
Funding
This research was supported in part by a University of Illinois sabbatical leave and a visiting scholarship at the LIS.
Author Biography
References
Supplementary Material
Please find the following supplemental material available below.
For Open Access articles published under a Creative Commons License, all supplemental material carries the same license as the article it is associated with.
For non-Open Access articles published, all supplemental material carries a non-exclusive license, and permission requests for re-use of supplemental material or any part of supplemental material shall be sent directly to the copyright owner as specified in the copyright notice associated with the article.