
Abstract
Patient satisfaction, an essential care quality measure, is heavily impacted by wait times. This study examined how different factors affect patient satisfaction with ED wait times in Newfoundland and Labrador, Canada. This mixed-method study, conducted in 4 EDs, used data collected using telephone surveys and semistructured interviews. Patient satisfaction with (1) physician initial assessment and (2) length of stay were analyzed using ordinal regression and thematic analysis. Among the 766 participants, 12% were extremely dissatisfied with physician initial assessment, and 13% were extremely dissatisfied with length of stay. Patients well-informed about the delays were more likely to report higher satisfaction than those who were not informed (aOR = 2.43, 95% CI [1.48-3.99], P-value <.001). Qualitative analysis revealed 4 key themes: poor communication about wait times, lengthy wait times, resource shortages causing long ED wait times, and patients avoiding ED because of it. Our study shows that patients are better satisfied when they are well-informed about the delays. This helped patients feel “less forgotten.” Addressing wait time issues is critical to providing patient-centered care and optimizing the care experience.
Keywords
Introduction
Emergency departments (EDs) are a critical point of acute care, providing urgent and emergent care and being a source of primary care for marginalized communities. 1 However, ED visits are often challenging as patients are particularly stressed and experience much uncertainty. 2 In Canada, increasing wait times in EDs have become a growing concern for healthcare providers and patients. 3 According to the Canadian Medical Association, in November 2023, ED patients waited up to 22 h for a hospital bed. 4
Patient satisfaction is an essential indicator of the quality of care healthcare systems provide.5-8 Prior studies have shown that wait times are among the strongest determinants of patient satisfaction.9,10 The longer patients wait in the ED before being assessed by a physician, the less satisfied they are with healthcare.2,11-13 A shorter stay in the ED (<4 h) is also associated with a better satisfaction rate than a longer stay (>8 h). 14 Reducing wait times would allow healthcare providers to enhance patient satisfaction, thereby improving the likelihood of better adherence to treatment plans, leading to improved health outcomes. 15
Several studies have shown that the patients’ waiting experience can be improved by providing consistent and timely communication about delays impacting their care.16-20 Anecdotal evidence from the Newfoundland and Labrador (NL) community suggests that patients are often discouraged from requesting updates on wait times in EDs due to the unpredictable nature of ED cases. This highlights the need for further investigation into how communication about wait times impacts patient satisfaction, as improving communication is a more feasible and immediate improvement area than reducing actual wait times. 17
Research on the influence of patients’ sociodemographic characteristics on their satisfaction with healthcare has had conflicting results.6,15 However, age, gender, and hospital settings are considered strong determinants of patient satisfaction.6,15 Most of the literature on ED quality focuses on urban tertiary hospitals 21 and lacks adequate information on patient satisfaction differences between hospitals in rural and urban locations. 8 As there is no consensus on the impact of age or gender on patient satisfaction with wait times,8,15 previous research is often not generalizable.
NL is a geographically remote Canadian province, 21 presenting unique challenges with access to care and chronic physician shortages. NL Health System services dispersed rural communities across the province, with reduced access to immediate care. NL has a population of 502,100, of which 23.6% are 65 or older—the highest proportion of older adults in all provinces. 22 The 2021 Commonwealth Fund Health Policy Survey of Older Adults reported that Canada has the highest percentage (31%) of older adults waiting 6 days or more for a medical appointment, with 10% seeking nonurgent care in EDs, compared to other industrialized nations. 23 Consequently, ED issues in NL reflect the broader national challenges related to ED overcrowding and wait times in Canada. 21
We know that analyzing patient satisfaction is one of the most effective ways to understand areas of healthcare that need improvement and evaluate how to provide better patient-centered care. 24 Therefore, our study aims to examine the effect of wait times on patient satisfaction and determine how this differs by gender, age, hospital setting (rural vs urban), and information about wait times in EDs of NL, Canada.
Methodology
Study Design and Data Collection
This is a mixed-method study. Data was collected using a survey administered via telephone from 1 March 2021 to 27 July 2023. Patients were randomly selected and contacted within 48 h of discharge by research assistants (RAs) trained to conduct interviews. 25 We randomly selected 25 date and time pairs spanning morning, afternoon, evening, and nighttime, for each study month. If no patients visited the ED at the specified time (eg, 9:00 a.m.), we applied a ± 2-h window to identify the nearest patient encounter (eg, 10:45 a.m.). Informed verbal consent was obtained before administering the survey and recorded in a secure patient log form. We also offered to send patients their consent documentation via email or post mail. The survey had 63 quantitative and 10 open-ended questions. Eleven questions relevant to the research objectives were selected for this study, focusing on patient demographics and details of ED visits, including questions where patients rated their satisfaction with several aspects of ED care on a scale of 0 to 10. Further details of the survey are available in other publications. 25
Patients were also invited to participate in a follow-up semistructured interview that delved further into their ED visit. The semistructured interview guide was cocreated with 6 patient research partners (PRPs). PRPs are patients and caretakers who have been partners in this research since its planning and initiation to knowledge dissemination. The follow-up interviews were conducted from 1 May 2024 to 29 July 2024. Upon completing these hour-long interviews, patients received a $25 Amazon gift card. A prize draw was also performed where 2% of participants who completed the 30-min telephone survey received gifts equivalent to $200 to $500.
Data Analysis
Quantitative
We included 2 patient-reported satisfaction measures26,27 as outcomes in the study: (I) Patient satisfaction with physician initial assessment (PIA) and (ii) Patient satisfaction with length of stay (LOS). We defined PIA as the length of time patients had to wait before being examined by a provider (doctor or nurse practitioner) and LOS as the total length of a patient's visit to the ED. Both variables were collected on a scale of 0 to 10 (0 worst, 10 best) and transformed into 5 categories: extremely dissatisfied (0-2), dissatisfied (3-4), neither satisfied nor dissatisfied (5), somewhat satisfied (6-7), extremely satisfied (8-10).
Independent variables included patient-reported wait times (PIA and LOS), patient characteristics (gender, age), ED location (rural, urban), and communication about wait times. Communication about wait times was collected using 2 questions: (1) “Were you told how long you have to wait before being examined by a provider?” (PIA knowledge) and (2) “How well were you kept informed about the delays impacting your care?” (information on delays).
Frequencies were derived to summarize patient characteristics, ED, and details of visits. Bivariate analysis between each independent variable and outcome variable was performed using the Chi-square test. Fisher's exact test was used instead of Chi-square when one or more cells had a frequency of less than 5. 28 Ordinal logistic regression was used to identify factors influencing patient satisfaction with wait times. Two models were developed for each outcome variable (patient satisfaction with PIA and patient satisfaction with LOS), with all relevant independent variables. A sensitivity analysis was performed using the multiple imputation approach to assess the impact of missing data on study results. A P-value of <.05 was considered statistically significant. All statistical analyses were performed using RStudio (version 4.3.2, Posit Software, PBC, formerly RStudio, PBC).
Qualitative
We used thematic analysis to identify the themes and subthemes related to wait times and patient satisfaction. We used a convergent design 29 in which results from the survey and semistructured interviews were integrated to enhance the validity and robustness of the findings. The simultaneous analysis of data from both sources facilitated triangulation, ensuring that the results were cross-validated and enriched by multiple perspectives.
Firstly, a team of 5 researchers with expertise in qualitative research, mixed-method studies, emergency medicine, and patient-centered care conducted open coding on responses from the open-ended survey questions. Each researcher independently reviewed and analyzed the data, identifying key themes, patterns, and codes on patient satisfaction. Weekly team meetings allowed us to discuss and reach a consensus on the codes, subthemes, and themes, followed by further evaluation and revision. Meanwhile, an RA transcribed the semistructured interviews and shared them with the team for analysis. Analysis of these in-depth interviews followed the same steps: independent open coding, followed by weekly discussions to reach consensus and refine the themes and subthemes. Finally, PRP feedback was incorporated to ensure the results were relevant to their ED experiences. This methodology allowed for comprehensive data exploration, promoting consistency and enriching the overall findings.
Results
Quantitative
Characteristics of Study Participants
A total of 832 participants completed the survey during the study period. Patients who left without being seen (N = 56) and those who did not provide a satisfaction score (N = 10) were excluded from the analysis. Our final sample size was 766 (Figure 1).
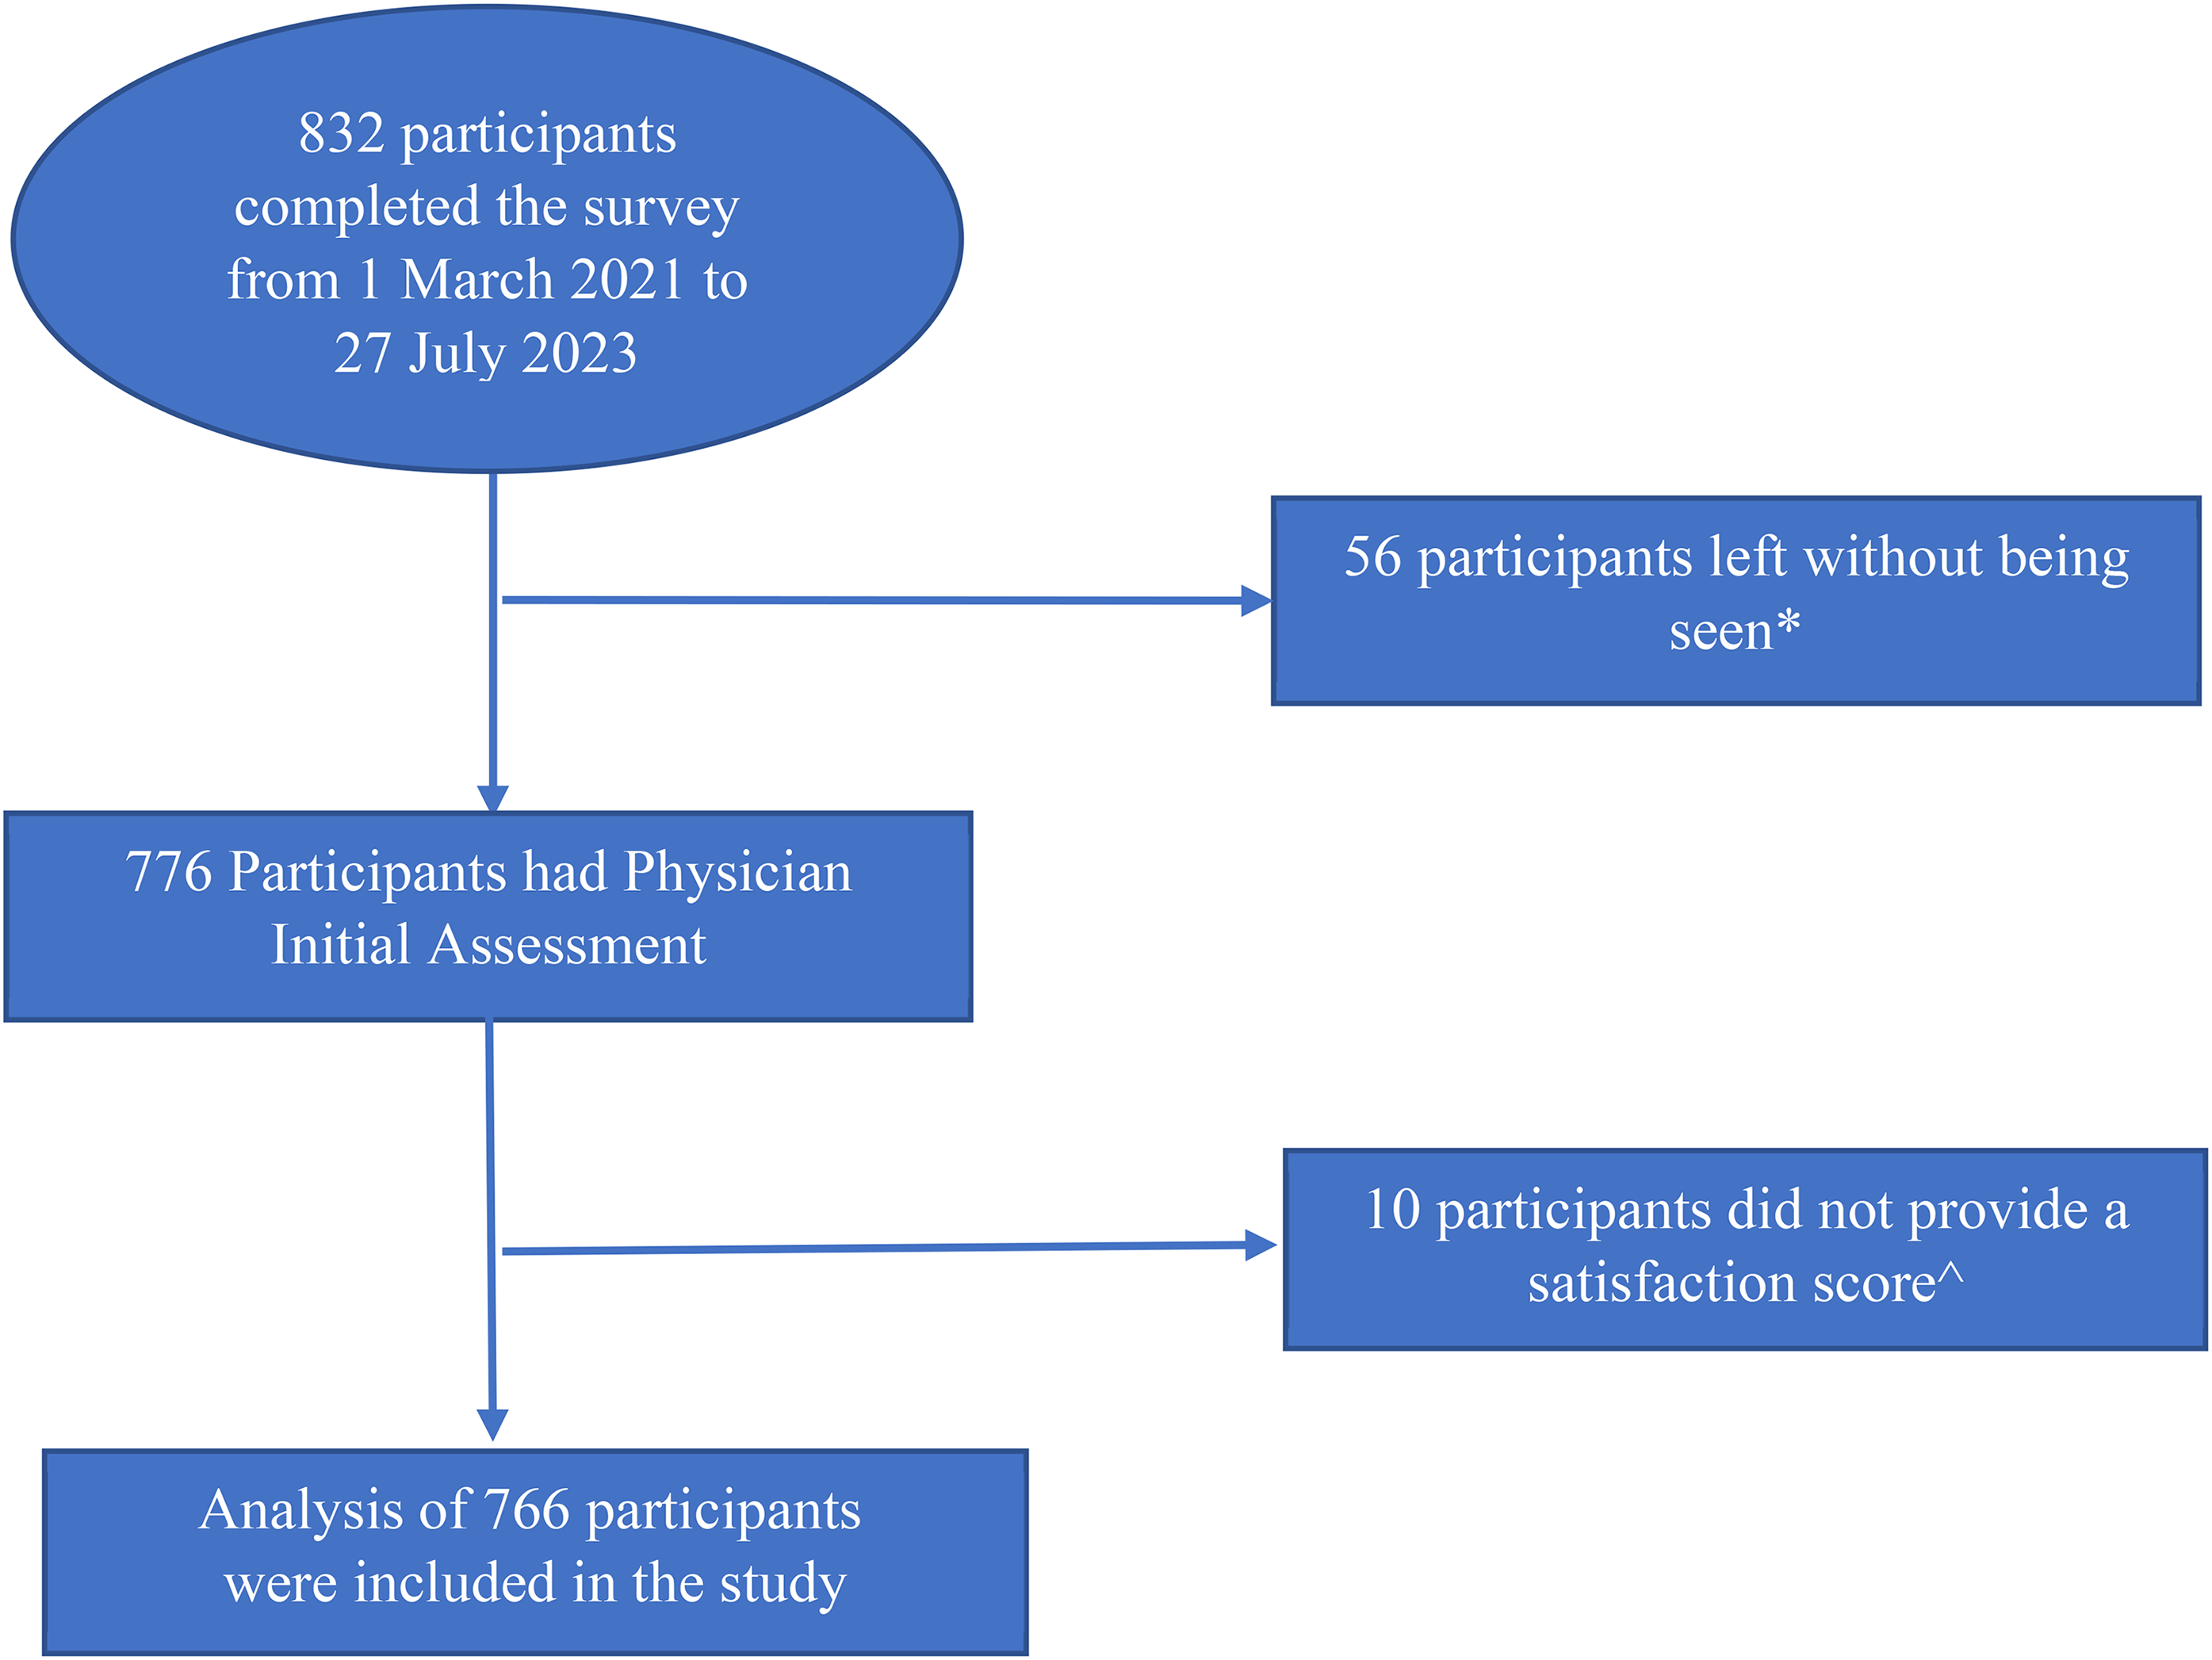
Flow chart of participant selection process.
*Responded “Yes” to the question: “Did you leave the ED before being seen by a doctor or nurse practitioner?”
^Did not respond to the question(s): “Using any number from 0 to 10, where 0 is extremely dissatisfied, and 10 is extremely satisfied, how satisfied were you with the amount of time before being seen by a doctor or nurse practitioner?” and/or “Using any number from 0 to 10, where 0 is extremely dissatisfied, and 10 is extremely satisfied, how satisfied were you with the total time spent in the ED?.”
Among the 766 participants, 12% were extremely dissatisfied with PIA, and 13% were extremely dissatisfied with LOS. Missing responses were the highest in LOS and PIA knowledge, with 16%. Table 1 shows the characteristics of the patients and their ED visits.
Characteristics of Patients Included in the Study (n = 766).

PIA, physician initial assessment; LOS, length of stay.
Main Results
The chi-squared test showed that patient satisfaction with PIA (χ2 = 12.6, degrees of freedom (do) = 4, P-value = .01) and patient satisfaction with LOS (χ2 = 12.7, ds = 4, P-value = .01) were both associated with ED location. Fisher's exact test showed that patient satisfaction with PIA was associated with age, PIA, PIA knowledge, and information on delays (P-value <.05). Finally, Fisher's exact test also showed that patient satisfaction with LOS was associated with age, wait times (LOS), and information on delays (P-value <.05). Neither outcome variable was significantly associated with gender. Further details on the bivariate analysis can be found in Supplemental File S1.
Patient Satisfaction With PIA
Ordinal logistic regression of patient satisfaction with PIA was performed first with the independent variables: age, gender, ED location, PIA, PIA knowledge, and information on delays (Table 2; Model 1).
Effect of Wait Times on Patient Satisfaction in Four EDs of NL (n = 766).

Note. ED, emergency department; PIA, physician initial assessment; LOS, length of stay; NL, Newfoundland and Labrador.
*Significance at P-value <.05; **significance at P-value <.001.
Compared to patients who waited <1 h to be examined by a provider, those who waited 1 to 2 h and 2 to 4 h were less likely to report higher satisfaction levels (adjusted Odds Ratio [aOR] = 0.30, 95% CI [0.18-0.52] and aOR = 0.07, 95% CI [0.04-0.12], respectively with P-value <.001). Patients who reported PIA of 4+ hours were 50 times less likely to report higher satisfaction levels than those who only waited <1 h (aOR = 0.02, 95% CI [0.01-0.03, P-value <.001).
When patients were very well and extremely well informed about the delays impacting their care, they were more likely to report higher satisfaction levels than those who were not informed at all (aOR = 2.43, 95% CI [1.48-3.99] and aOR = 3.82, 95% CI [2.26-6.45], respectively with P-value <.001].
Patient Satisfaction With LOS
The second model, which examined patient satisfaction with LOS, included the independent variables age, gender, ED location, LOS, and information on delays (Table 2; Model 2).
Patients whose overall LOS was 2 to 4 h (aOR = 0.33, 95% CI [0.20-0.57], P-value <.001) were 3 times less likely to report higher satisfaction with LOS than those who stayed for less than 2 h. Similarly, patients who stayed for 4 to 6 h and 6+ hours were also less likely to report higher satisfaction compared to those who stayed 0-2 h (aOR = 0.10, 95% CI [0.06-0.18] and aOR = 0.05, 95% CI [0.03-0.09], respectively with P-value <.001).
Similar to Model 1, patients who were very well and extremely well informed about the delays impacting their care were more likely to report higher satisfaction levels than those who were not informed at all (aOR = 3.63, 95% CI [2.28-5.77] and aOR = 12.28, 95% CI [7.45, 20.24], respectively with P-value <.001).
Qualitative
A total of 771 responses, including 5 semistructured interviews, were analyzed, at which point data saturation was achieved. Thematic analysis revealed 4 key themes that affected patient satisfaction with wait times: (1) Poor communication about wait times, (2) Lengthy wait times leading to dissatisfaction, and (3) Resource shortages causing long ED wait times and (4) Patients avoiding ED because of long wait times. See Table 3 for representative quotations (Qs) from all the themes.
Themes and Illustrative Quotations From the Thematic Analysis of Patient Satisfaction With Wait Times in Four EDs of NL.

ED, emergency department; NL, Newfoundland and Labrador.
Several patients expressed dissatisfaction due to poor communication about wait times. They felt uncomfortable due to ED signs discouraging inquiries about wait times (Table 3; Q1). Basic needs, such as hunger and thirst, became another source of frustration as patients were uncertain whether leaving their seats to get a glass of water might result in missing their turn (Table 3; Q2). Finally, patients also reported feeling forgotten due to the lack of communication or acknowledgment from staff during their wait (Table 3; Q3 and Q4).
Most patients reported lengthy wait times leading to dissatisfaction. One of the patients called the ED a “zoo” due to the wait times and crowds of patients (Table 3; Q5). Some patients’ health conditions worsened during the wait, increasing dissatisfaction with the ED services (Table 3; Q6).
Several patients mentioned resource shortages causing long ED wait times. This includes the closure of other EDs, a lack of staff and resources in the ED, and inadequate coverage from family physicians and urgent care centers (UCCs) (Table 3; Q7 and Q8). Some patients noted that difficulties securing timely appointments with family physicians often force them to rely on the ED for urgent care (Table 3; Q9).
Patients reported avoiding ED because of long wait times. Prolonged wait times caused several patients to leave the ED before being seen (Table 3; Q10). Patients also mentioned they tend to avoid visiting the ED unless it's life-threatening to avoid excessive wait times (Table 3; Q11).
Comparison With Patients Who Left Without Being Seen
As mentioned earlier, we excluded patients who left without being seen (n = 56) from the main analysis. However, we conducted a post hoc analysis for this group, and Table 4 shows their characteristics.
Patients Who Left Without Being Seen and Were Excluded From the Study (n = 56).
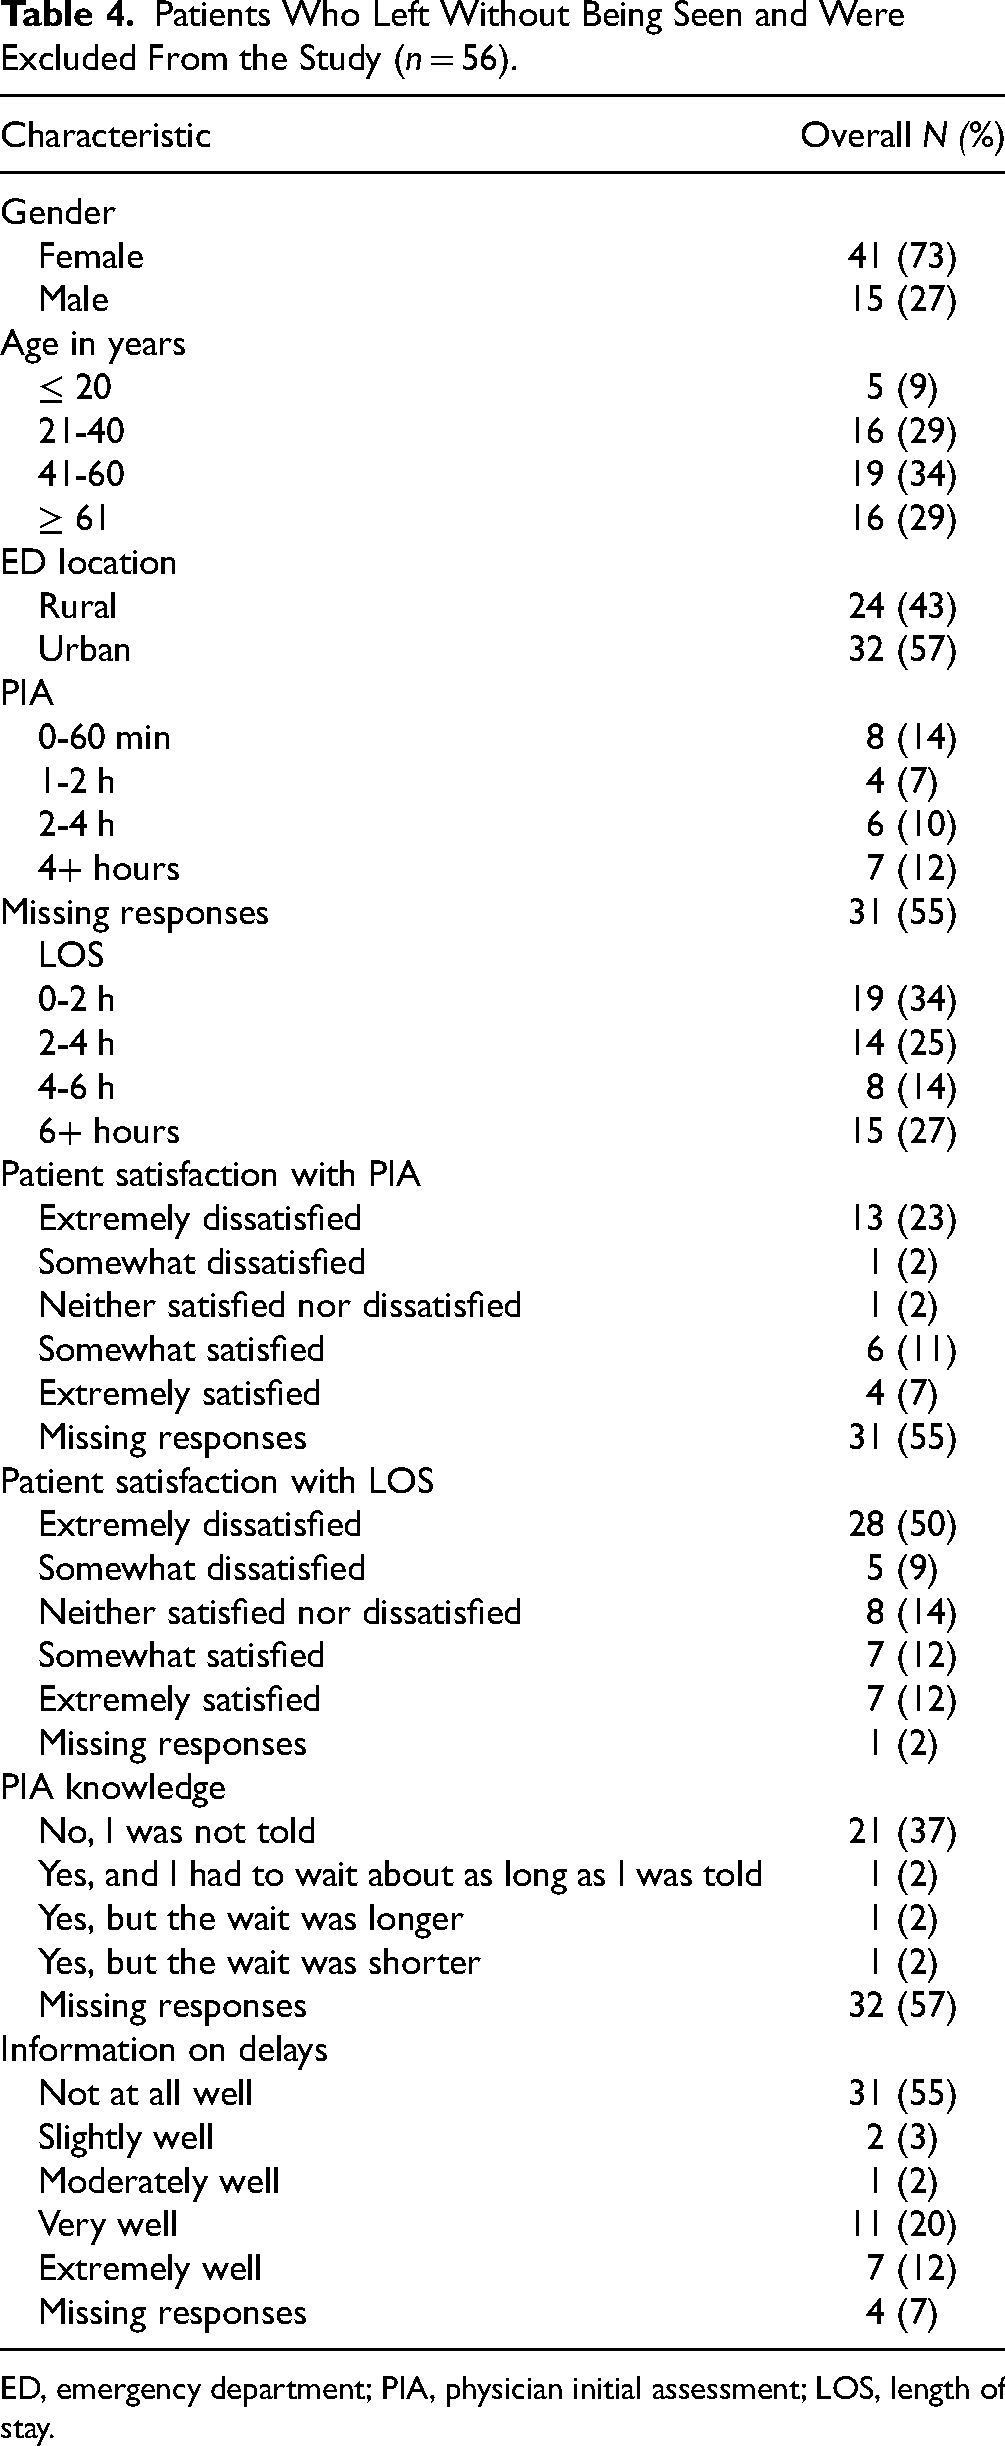
ED, emergency department; PIA, physician initial assessment; LOS, length of stay.
Patients who left without being seen were extremely dissatisfied with PIA (23%) and LOS (50%). Interestingly, most of these patients reported that their PIA was less than an hour (14%) and LOS was less than 2 h (34%). Qualitative analysis of their survey responses showed that patients left the ED for 3 primary reasons: (1) prolonged waits without any updates from staff, (2) overcrowding, leading to the assumption that their wait time would be excessive, and (3) symptom improvement over time, prompting the decision to leave. As illustrated in the quote below, patients voiced significant concerns about prolonged wait times and the overall management of the ED. (Patient) said the healthcare system needs a ‘COMPLETE overhaul’ in order for it to function properly … he was in the ED for hours at this particular visit with severe pain that was not taken seriously …. He waited overnight in the ED without being seen or checked on by anyone and he described the nurses working as being negligent and having no regard for his wellbeing … he has lost all respect for the NL health system and said he will ‘never, ever, ever’ use the NL health system again for serious health concerns…. (Survey response from a male patient, aged ≥ 61 years, who visited an urban ED)
Discussion
To our knowledge, this is the first study in NL to examine the effect of wait times on patient satisfaction and determine how this effect differs by gender, age, ED location, and communication about wait times. Overall, 12% of patients were extremely dissatisfied with PIA, and 13% were extremely dissatisfied with LOS. Ordinal logistic regression analysis revealed that wait times and information on delays significantly impacted patient satisfaction while controlling for all other covariates. We found that patients who waited over 60 min to see a provider and those who stayed more than 2 h in the ED were over 67% less likely to report higher satisfaction than those who waited less than an hour or stayed in the ED for more than 2 h. These results are supported by previous studies correlating shorter wait times with higher patient satisfaction.2,11-14
Interestingly, we also found that patients who were well informed about the delays impacting their care were more satisfied with wait times than those who were not at all informed about the delays. This finding is particularly important as several patients mentioned signs in the ED waiting rooms asking them not to ask the staff about wait times. Discussions with PRPs also revealed this is a well-established rule in NL EDs. However, similar to our results, a 2019 qualitative study by Chu et al. 17 showed that proactively informing patients about delays can modify patients’ wait time experience. Alhabadan et al. 19 found that patients preferred to be updated at least every 30 min about wait times. This highlights the need to provide consistent updates on wait times to improve patients’ overall satisfaction.17,20
In our study, age and gender only impacted patient satisfaction with LOS. Older patients (>40 years old) and male patients were more likely to report higher satisfaction levels with LOS than younger patients and female patients, respectively. Our results are similar to studies that have found that older patients (>50 years) seem more satisfied with healthcare than younger populations,6,15 and female patients experience more delays in care and are less satisfied than male patients.6,30-32 Discussions with PRPs indicated that older patients may report higher satisfaction levels because they are more familiar with the EDs and accept the inherent delays in ED processes. ED location did not impact patient satisfaction with wait times in this study. Our PRPs agreed that dissatisfaction with wait times is similar across both rural and urban EDs in NL. These findings further show how important it is to investigate factors affecting patient satisfaction with wait times in local settings, as findings are often unique to the EDs and might not be generalizable.
The qualitative analysis highlighted 4 themes affecting patient satisfaction with wait times: poor communication about wait times, lengthy wait times leading to dissatisfaction, resource shortages causing long ED wait times, and patients avoiding ED because of long wait times. Many patients expressed frustration with lengthy wait times and feeling forgotten even with serious medical issues, a theme that is consistent with previous literature.2,11-13,17,19,20 Patients preferred to have consistent updates on wait times as it allowed them to get food or water while waiting without the fear of missing their turn. PRPs noted that ED signage discouraging inquiries about wait times hinders communication with providers and creates an unwelcoming environment. As Cohen et al. 33 shared, one of the strategies to improve patients’ perceptions of wait times is informing patients about the reasons for delays and clarifying the fairness of wait times.
Finally, patients who did not have access to healthcare outside the ED, such as to a family physician, mentioned a need for improvement in access to healthcare services so that they can avoid relying on the ED for nonemergent issues. Previous studies on this theme have had conflicting results. While some studies suggest that expanding care options, including in-person and virtual visits with family physicians, 34 as well as same-day primary care access, can reduce ED overcrowding by low-acuity patients, 35 others indicate that even with 24/7 primary care or increased UCCs, patients continue to seek ED care due to perceived urgency 36 or limited awareness of UCC services. 37
Limitations
One of the key limitations of our study was that it heavily relied on self-reported data, which could introduce bias from incomplete or inaccurate responses from participants. 38 Dissatisfied patients might have also exaggerated their waiting times, causing further bias. However, trained RAs trained who ensured patients understood the questions and responded as accurately as possible. Furthermore, collecting self-reported data enabled us to gather rich, in-depth insights into patient perspectives. Patients were contacted within 48 h of discharge, and if they were unavailable, a maximum of 3 attempts were made within the next 2 weeks to reduce nonresponse bias. 25 The time gap between the telephone survey and the semistructured interviews could have caused recall bias, as patients might have forgotten the specifics of the ED visit for which they were recruited, possibly confusing it with other similar visits. Nevertheless, as we used a mixed-methods design, our comprehensive analysis helped reduce this risk.
Due to an error in our web survey platform, we lost 16% of responses from the initial months of data collection to the variables “LOS” and “PIA knowledge.” However, we performed a sensitivity analysis (results not shown) that showed that the missing data did not impact our results. While our PRP committee is relatively small and includes a diverse group of individuals, membership turnover over time may have limited continuity and consistency in perspectives. Our study did not consider variations in race and cultural backgrounds among participants as this information was not collected. Previous studies have shown that patient–provider race/ethnicity and gender concordance are predictors of patient satisfaction. 39 Although we collected data on physician gender through semistructured interviews, this was not collected via telephone surveys and couldn’t be used in our quantitative analysis. Our qualitative results did not show any patterns in patient and physician gender affecting satisfaction. There is also some evidence that the level of emergency influences wait times and, subsequently, patient satisfaction. 40 However, we couldn’t collect this information. Future research should incorporate these factors to better understand patient satisfaction with wait times.
Clinical and Research Implications
Expanding ED resources, including staffing and access to family physicians and UCCs, is essential for improving patient satisfaction but requires significant time and investment. Given the impact of low satisfaction, prioritizing feasible interventions is crucial. Our PRPs emphasized the importance of providing regular wait time updates, removing signage that discourages patient inquiries, and offering estimated wait times alongside Canadian Triage and Acuity Scale scores to improve the waiting experience. Ensuring easy access to basic necessities such as water, food, and clean washrooms can further enhance the waiting experience. Effective communication, including calm and empathetic interactions, is also vital, and regular refresher communication training for ED staff is recommended. Additionally, periodically relocating patients within the ED can foster a sense of progress. 33 Further research is needed to understand why younger and female patients report higher dissatisfaction with wait times, as well as to examine the reasons patients leave without being seen, enabling targeted strategies to reduce LWBS rates.
Conclusion
In conclusion, our study revealed that one in 9 patients were extremely dissatisfied with ED wait times, indicating an area of ED care that requires immediate attention. Longer wait times often worsened patients’ conditions, leading to frustration and a sense of neglect, resulting in some patients leaving the ED without receiving care or avoiding seeking ED care altogether. However, patients were more likely to be satisfied with waiting when they received updates about the delays. As such, our study showed that “they (patients) just don’t want to feel forgotten” and that providing patients with timely and clear information about delays can significantly improve their satisfaction. Addressing wait time issues is crucial in improving patients’ willingness to seek ED care, enabling healthcare systems to provide patient-centered care and a satisfactory overall ED experience.
Supplemental Material
sj-docx-1-jpx-10.1177_23743735251333213 - Supplemental material for “They Just Don’t Want to Feel Forgotten”: A Mixed-Methods Research on Patient Satisfaction With Wait Times in Emergency Departments
Supplemental material, sj-docx-1-jpx-10.1177_23743735251333213 for “They Just Don’t Want to Feel Forgotten”: A Mixed-Methods Research on Patient Satisfaction With Wait Times in Emergency Departments by Aswathy Geetha Manukumar and Hensley H Mariathas, Christopher Patey, Nahid Rahimipour Anaraki, Anna Walsh, Oliver Hurley, Dorothy Senior, Holly Etchegary, Paul Norman, Shabnam Asghari in Journal of Patient Experience
Supplemental Material
sj-docx-2-jpx-10.1177_23743735251333213 - Supplemental material for “They Just Don’t Want to Feel Forgotten”: A Mixed-Methods Research on Patient Satisfaction With Wait Times in Emergency Departments
Supplemental material, sj-docx-2-jpx-10.1177_23743735251333213 for “They Just Don’t Want to Feel Forgotten”: A Mixed-Methods Research on Patient Satisfaction With Wait Times in Emergency Departments by Aswathy Geetha Manukumar and Hensley H Mariathas, Christopher Patey, Nahid Rahimipour Anaraki, Anna Walsh, Oliver Hurley, Dorothy Senior, Holly Etchegary, Paul Norman, Shabnam Asghari in Journal of Patient Experience
Supplemental Material
sj-docx-3-jpx-10.1177_23743735251333213 - Supplemental material for “They Just Don’t Want to Feel Forgotten”: A Mixed-Methods Research on Patient Satisfaction With Wait Times in Emergency Departments
Supplemental material, sj-docx-3-jpx-10.1177_23743735251333213 for “They Just Don’t Want to Feel Forgotten”: A Mixed-Methods Research on Patient Satisfaction With Wait Times in Emergency Departments by Aswathy Geetha Manukumar and Hensley H Mariathas, Christopher Patey, Nahid Rahimipour Anaraki, Anna Walsh, Oliver Hurley, Dorothy Senior, Holly Etchegary, Paul Norman, Shabnam Asghari in Journal of Patient Experience
Footnotes
Acknowledgments
We thank our patient partners for contributing to this study. We also appreciate all team members’ advice and support: Dr James Rourke, Dr Kris Aubrey-Bassler, Dr Jennifer Jewer, and Dr John Knight. We also thank everyone who assisted us in data collection.
Consent to Participate
Participants provided informed verbal consent and could request to receive a copy of their consent documentation via electronic or post mail before participating in the study.
Data Availability
Data cannot be made available due to restrictions on data-sharing agreements. For more information, please contact sasghari@mun.ca.
Declaration of Conflicting Interest
The author(s) declared the following potential conflicts of interest with respect to the research, authorship, and/or publication of this article: CP and PN are the cofounders of SurgeCon Innovations. Our team received funding for a project entitled “SurgeCon: An Emergency Department Surge Management Platform” from the Canadian Institutes of Health Research, Newfoundland and Labrador Provincial Government, Newfoundland and Labrador Health Services, and the Trinity Conception Placentia Health Foundation. PN has a royalty-sharing agreement with MOBIA Technology Innovations and the Newfoundland and Labrador Health Services.
Ethical Considerations
Ethics approval for this study was obtained from the Health Research Ethics Authority of Newfoundland and Labrador (HREB #2019.264).
Funding
The authors disclosed receipt of the following financial support for the research, authorship, and/or publication of this article: The authors (SA, CP, DS, HE, and HM) are currently receiving financial support from the Canadian Institutes of Health Research (Grant No. SR4-165123), the Government of Newfoundland and Labrador (Grant No. 5404-2312-101), Newfoundland and Labrador Health Services, Memorial University of Newfoundland, and the Trinity Conception Placentia Health Foundation for the continued development of the SurgeCon platform to improve emergency department wait times and patient satisfaction.
Supplemental Material
Supplemental material for this article is available online.
References
Supplementary Material
Please find the following supplemental material available below.
For Open Access articles published under a Creative Commons License, all supplemental material carries the same license as the article it is associated with.
For non-Open Access articles published, all supplemental material carries a non-exclusive license, and permission requests for re-use of supplemental material or any part of supplemental material shall be sent directly to the copyright owner as specified in the copyright notice associated with the article.