
Abstract
We investigate the association between business strategy and firm-level tournament incentives in China and find that business strategy is associated with tournament incentives positively. We further find that this positive relationship manifests itself in local, but not central, state-owned enterprises (SOEs). In addition, we also offer some evidence that foreign institutional investors play a moderating role on the positive association between business strategy and tournament incentives. Our study fills a gap in the existing tournament literature by incorporating business strategy as an important determinant of tournament incentives in China.
Introduction
This article investigates the association between business strategy and firm-level tournament incentives in China. Business strategy is an important factor affecting the internal governance mechanism of firms, including the design of executive compensation structure (Baker et al., 1988; Miles & Snow, 1978, 2003; Porter, 1996; Varadarajan & Clark, 1994). A well-designed incentive mechanism not only allows executives to understand the importance of achieving firm objectives, but also encourages them to work hard toward achieving corporate targets. Research thus far has examined the relation between business strategies and chief executive officer (CEO) compensation structures (Hoskisson et al., 1989; Ittner et al., 1997; Rajagopalan & Prescott, 1990; Tosi & Gomez-Mejia, 1989), but has remained silent on how firm-level business strategy affects the executive compensation structure, the so-called tournament incentive. This is surprising since the upper echelon theory posits that “leadership of a complex organization is a shared activity, and the collective cognitions, capabilities, and interactions of the entire TMT enter into strategic behaviors” (Hambrick, 2007, p. 334). As such, a focus on executive groups rather than individuals can yield a better explanation of organizational outcomes than a focus on individuals (such as the CEO) alone (Hambrick, 2007; Hambrick & Mason, 1984).
Tournament incentives facilitate a contest among senior executives, and only the best relative performer in the contest can get the generous monetary rewards as well as a superior position in the corporate hierarchy (Bognanno, 2001; Eriksson, 1999; Lazear, 1995; Lazear & Rosen, 1981). Tournament incentives are captured by the pay gap between the CEO and the remaining executives. The larger the pay gap, the stronger the motivation for executives to win the contest. We posit a positive relationship between business strategy and the adoption of tournament incentives. Our study follows the organizational strategy typology by Miles and Snow (1978, 2003), in which they identify three recurring viable business strategies namely prospectors, defenders, and analyzers.
Prospectors attempt to be innovative market leaders by rapidly changing product lines, diversifying products, and stimulating and exploring new market opportunities. The rapid growth experienced by prospector-type firms leads to complexity of operations, unstable organizational structure, and high uncertainties and risks (Habib & Hasan, 2019; Miles & Snow, 1978, 2003) To deal with such complexities, Miles and Snow (1984) suggest that prospectors’ managerial recruitment strategy will be to employ highly talented executives who will outperform their peers in the industry. As more executives join in, leading to a larger internal candidate pool, prospector-type firms are likely to enlarge the tournament prize to compensate for the lower likelihood of promotion to the CEO position (Holmstrom, 1992; Lazear & Rosen, 1981; McLaughlin, 1988). In contrast, defender-type firms focus on production efficiency and cost control and, hence, offer less managerial discretion by enforcing strict guidelines on investment approval. Defenders, therefore, are less likely to adopt tournament incentives to compensate executives, as such firms are less concerned about executives’ ability to manage their strategic initiatives. Analyzers represent characteristics of both prospectors and defenders. In line with prior literature (Bentley-Goode et al., 2013; Simons, 1987), we focus only on prospectors and defenders, each of which sit at opposing spectrums of the strategic chain.
We examine our research proposition in the context of China for several reasons. First, the increase in labor cost and the intensive competition globally, encourage a majority of Chinese enterprises to transit from a more cost-oriented business strategy to a more differentiation-oriented strategy. In recent decades, China has gone through a big boom of e-commerce: for instance, the widespread use of the internet and mobile shopping platforms, all over China. The unique features of differentiation strategy, like brand name recognition, have become a crucial factor for firms’ success in a digital world. As a result, an increasing number of firms tend to adopt the differentiation strategy (Peng et al., 2015). How such a change in business strategy influences tournament incentives is a pressing research question. Second, several studies document the effect of business strategy on equity compensation in the United States, where equity-based compensation schemes dominate (Y. Chen & Jermias, 2014; Navissi et al., 2017). Unlike US executives, Chinese executives receive predominantly cash-based compensation (J. Chen et al., 2011; Huang & Boateng, 2017; H. Zhang et al., 2018). The relationship between such cash compensation–based tournament incentives and business strategies requires empirical scrutiny. On one hand, compared with defender-type firms, we expect prospector-type firms to design a tournament structure that widens the pay gap among executives and the CEO, because such cash and perk consumption is valuable. On the other hand, with half of the listed firms being state-owned, it is yet unclear whether state ownership would have any significant implication for the design of tournament structure in prospector-type versus defender-type firms in China.
Using a large sample of non-financial Chinese listed firms in the A-share market during the period from 2011 to 2017, we find that firms pursuing prospector strategy have larger tournament sizes compared with defender-type firms. 1 In terms of economic significance, the reported coefficient implies that one standard deviation increase in strategy, is associated with 11.37% increase in tournament incentives (proxied by natural logarithm of the pay gap [LnGAP]). The main findings are robust to alternative measures of business strategy and tournament incentives. Second, we test for the moderating effect of state ownership on the association between business strategy and tournament incentives, and find the association to be positive and significant for both the state-owned enterprises (SOEs) and the private firm (non-SOEs) sub-samples. However, when the SOE sample is further decomposed into central and local-SOEs, we find the positive association to be confined to the local-SOE group, but insignificant for the central-SOE group. In addition, we provide some evidence that qualified foreign institutional investors (QFII) also moderate the relationship between business strategy and tournament incentives.
Our study contributes to the existing literature in several important aspects. First, we contribute to existing executive compensation literature by focusing on top management tournament incentives rather than CEO compensation. Since, leadership of an organization is a shared activity, a focus on executive groups rather than individuals can provide richer insights for organizational outcomes than a focus on individuals alone (Hambrick, 2007; Hambrick & Mason, 1984). Second, we extend the scant literature on the determinants of tournament incentives by investigating the role of firm-level business strategy (Sun & Habib, 2020). To the best of our knowledge, no study has yet explored the relationship between business strategy and tournament incentives, which is rather surprising, given the dominant role business strategies play in shaping corporate decisions. Third, our findings have policy implications for regulators regarding the appropriate design of managerial compensation for the SOEs. Our findings suggest that only the local SOEs’ tournament incentives are sensitive to business strategy, hence, “Pay Cap” 2 policy may not fit for all types of SOE. The policy may be more suitable for central SOEs and defender-type local SOEs since these firms are less innovative, and do not necessarily need a large pay disparity to compensate their executives.
The rest of the article is organized as follows. The literature review and hypotheses development section offers theoretical background on both business strategy and tournament incentives, and develops empirical predictions. Next, our research design and procedure are described (e.g., data and sample selection, empirical model, measurements of main variable of interests). We report and explain the main findings in the empirical results section. Finally, we conclude by re-emphasizing the key findings, contributions, and potential implications of our study.
Literature review and hypotheses development
Research on business strategy
Business strategy is a set of proactive actions and moves that assist a firm in achieving and sustaining a competitive advantage within an industry (Varadarajan & Clark, 1994). The management literature provides several notable business strategy typologies that portray how a firm competes in its respective markets. For instance, Porter (1980) identifies strategies in terms of cost leadership (price) and product differentiation (quality), while March (1991) classifies business strategies into either exploitative or explorative, and Treacy and Wiersema (1995) differentiate between operational excellence, product leadership, and customer intimacy.
However, in this study, we adopt the business strategy typology developed by Miles and Snow (1978, 2003). Considering the differences in the magnitude and direction of change in various firms’ products and markets within the same industry, they categorize business strategy into three types: prospectors, analyzers, and defenders. The use of this typology brings several advantages compared with other strategy typologies mentioned above. First, their strategic types are one of the most used and well-cited in contemporary strategy literature for their strong and detailed theoretical orientation (Smith et al., 1989). Second, the construct validity of this typology has been widely scrutinized and tested by previous studies in a variety of settings with success (Bentley-Goode et al., 2013; Higgins et al., 2015; Ittner et al., 1997). Third, unlike other well-known typologies, which are unable to appropriately identify firms that operate under a mixed strategy, the Miles and Snow (1978, 2003) typology could more clearly differentiate firms that operate at one end or the other of a strategy continuum. In addition, the Miles and Snow typology can be operationalized using archival data (e.g., Ittner et al., 1997), thereby, enabling us to conduct archival research using a large number of observations. Other typologies, on the contrary, can be operationalized only through interviews and/or questionnaire surveys.
Prospectors (innovation-oriented strategy) have a very broad product domain and concentrate on seeking new products and identifying potential market opportunities, which require them to make substantial investments in research and development (R&D) and marketing activities. To respond quickly to changes in markets conditions, prospectors tend to maintain a more flexible organizational structure and to offer greater managerial discretion for coping with uncertainties and risks. Unlike prospectors, defenders emphasize cost efficiency and certainty as the basis for business contest/competition. They consider mainly how to obtain a competitive advantage on their limited products, service, and quantity through more efficient production and distribution in a single market. Therefore, defenders tend to maintain a narrow product domain and a more stable and centralized organizational structure to control operating costs (Miles & Snow, 1978; Thomas & Ramaswamy, 1996). However, such a strategy prevents them from adapting well to uncertainty and risk. Analyzers, the remaining strategy group, exhibit characteristics of both prospectors and defenders.
Several studies have shown the effects of business strategies on firm outcomes and managerial behavior. Compared to defenders, prospectors are more likely to engage in financial reporting irregularities (Bentley-Goode et al., 2013), experience weaker internal control (Bentley-Goode et al., 2017), adopt more aggressive tax avoidance strategies (Higgins et al., 2015), have a high probability of receiving a going concern opinion (Lim et al., 2018), provide less readable annual reports (Chen, Eshleman et al., 2017; Habib & Hasan, 2020), exhibit inefficient investments (Habib & Hasan, 2019; Navissi et al., 2017), make more profitable insider trading (G. Z. Chen & Keung, 2019). On the contrary, Bentley-Goode et al. (2019) find that prospectors exhibit lower information asymmetries than defenders, as prospectors tend to have greater analyst and press coverage, and more frequent voluntary disclosures. Following the same vein, Yuan et al. (2018) find that prospectors produce a better corporate social responsibility (CSR) performance than defenders.
In terms of executive compensation, Veliyath et al. (1994) find that prospectors pay their top executive team more than their defender or analyzer counterparts, since the executives of prospector-type firms face more employment risks, as proxied by the annual variance of quarterly sales. Using high-technology industries, Yanadori and Marler (2006) find that prospectors tend to pay higher salaries for their R&D employees. Y. Chen and Jermias (2014) find that product differentiation firms use a higher proportion of performance-based compensation (bonus, stock options, and other annual compensation) for their managers, than do cost-leadership firms. Sheng et al. (2019) document a negative relation between business strategy and employee wage premia in China. However, how business strategy influences on another type of incentive plan, namely, tournament incentives (promotion-based compensation) received far less attention.
Research on tournament incentives
Explicit compensation (e.g., CEO pay) continues to be one of the most controversial issues in the corporate governance domain (Murphy, 2013). This field of studies is dominated by agency theory, which posits that a well-designed CEO compensation package can help firms to reduce managerial opportunism by encouraging managers to better align their interests with those of the company’s shareholders (Jensen & Meckling, 1976). Despite its popularity, the empirical evidence for explicit CEO compensation remains inconsistent. Several studies show that a properly designed compensation system increases firm performance (Aggarwal & Samwick, 2006; Conyon & He, 2011; Kato & Long, 2006; Tang & Sun, 2014). However, others find that such compensation plans may exacerbate the agency problem by encouraging managerial rent-seeking (Bertrand & Mullainathan, 2001; Yermack, 1997). One of the possible reasons is that powerful CEOs can exert significant influence in setting their own pay (Bebchuk & Fried, 2003). Moreover, given that many unforeseen contingencies cannot be contracted ex-ante, executives may shirk responsibilities, especially when monitoring is less than perfect (Lazear & Rosen, 1981). Owing to these shortcomings associated with the explicit forms of compensation schemes, the tournament incentive, an alternative form of executive compensation, has gained popularity (e.g., Arend, 2019).
Tournament theory was originally developed by Lazear and Rosen (1981) and then extended by Rosen (1986). The theory states that tournament incentives facilitate a contest among senior executives, and the winner of the contest can get higher remuneration and superior status in the corporate hierarchy, while the remaining competitors “lose” the tournament and receive nothing (Bognanno, 2001; Eriksson, 1999; Faravelli et al., 2015; Lazear & Rosen, 1981). Tournament incentives, proxied by the pay gap between CEO and senior executives, serve to encourage senior executives to work hard to achieve the prize of the CEO position. Unlike explicit compensation plans where certain goals are specified beforehand, under tournament schemes executive performance is often evaluated by comparing how well one does against the other competing executives. Thus, tournament incentives are an efficient incentive mechanism to elicit effort when managerial performance is difficult to observe, especially when information asymmetry is severe, and the environment is uncertain (Bloom & Michel, 2002).
To date, a number of studies provide supporting evidence that tournament incentives enable the company to retain high-performing managers with appropriate human capital, and produce better firm performance (e.g., J. Chen et al., 2011; Coles et al., 2018; Eriksson, 1999; Hu et al., 2013; Kale et al., 2009; Lee et al., 2008; B. X. Lin & Lu, 2009; Y. Xu et al., 2016). The existence of tournament incentives is also found to reduce managerial earnings manipulation behavior (Z. Chen et al., 2016; H. Zhang et al., 2018); enhance innovation efficiency (Shen & Zhang, 2018; M. Xu et al., 2017); and reduce the occurrence of price crash (Chen, Kim et al., 2017). However, prior literature also documents evidence of opportunistic behavior stemming from tournament incentives. For example, prior studies have found that tournament incentives induce more sabotage activities (Harbring & Irlenbusch, 2011), more aggressive tax strategies (Kubick & Masli, 2016), and result in higher audit fees owing to increased levels of audit risk (Bryan & Mason, 2017).
Although studies on the consequences of tournament incentives are plentiful, we found only a few prior studies that sought to understand the determinants of tournament incentives. Some such determinants include firms’ growth patterns (Sahib et al., 2018); firms’ CEO characteristics, such as overconfidence (Vitanova, 2018), and cultural values, such as power distance and pay equity (Burns et al., 2017).
Business strategy and tournament incentives
As mentioned before, prospector-type firms that focus on seeking new growth opportunities and rapid changes in product markets, operate businesses under an intensively competitive environment as compared with defender-type firms (Miles & Snow, 1978, 2003). Such challenges encourage them to expand their top management team. Miles and Snow (1984) also suggest that prospectors’ managerial recruitment strategy will be to employ highly talented executives who will outperform their peers in the industry. This may lead to a larger internal candidate pool, who will compete for CEO promotion. When more competitors join in, there is a lower probability of getting CEO promotion and a smaller winning prize. Tournament theory suggests that a larger tournament prize is needed to compensate the lower likelihood of promotion for individual executives (Holmstrom, 1992; Lazear & Rosen, 1981; McLaughlin, 1988). Kato and Long (2011) find that firms tend to enlarge their tournament prize along with a larger candidate pool for the CEO promotion in China to prevent lower level of efforts from each candidate.
Moreover, the managerial level of effort tends to increase with the prize spread between the winner and the loser (Knoeber & Thurman, 1994). To ensure executives continue exerting high levels of effort, firms should enlarge their pay gap to compensate for this effect. Also, there is an increasing number of Chinese listed firms that tend to adopt the prospector-type strategy in the new era of e-commerce with the booming online sales via mobile shopping platforms in China. This is because innovative business strategy has become a vital factor for firm’s long-term success in a digital world (Peng et al., 2015). Very often, the rapid growth experienced by prospectors increases market uncertainty stemming from complexity and risky business operations (Bentley-Goode et al., 2013; Habib & Hasan, 2019). To deal with such complexity efficiently, innovative firms might pursue higher tournament incentives, since promotion-based tournaments help to attract and retain managers owing to the intense competition among potential candidates (Bloom & Michel, 2002; Lazear, 1995). Therefore, drawing on tournament theory, it is predicted that prospector-type Chinese listed firms tend to have larger tournament incentives.
In contrast, defender-type Chinese listed firms focus on production and distribution efficiency in a narrowly defined and stable product set, instead of adjusting their product-market portfolios frequently. Therefore, they are less concerned about their executives’ ability to manage firm strategic initiatives. They often have strict policies and procedures in their business operation (Navissi et al., 2017) that discourage executives from undertaking risky projects. Bentley-Goode et al. (2013) also document that defender-type firms experience lower business risks. Moreover, since they acquire growth potential from a competitive advantage on their existing range of products and services, they are less likely to experience inefficient labor investment and market uncertainty (Habib & Hasan, 2019; Singh & Agarwal, 2002). Therefore, executives in defender-type firms in China do not face the same level of challenges as do their counterparts in the prospector-type firms. They do not necessarily hire executives externally nor expand the top management team, as there is little demand for strategy-oriented executives in defender-type firms. In contrast with prospector-type firms, defenders in China are less likely to adopt tournament incentives to compensate their executives, i.e., the pay disparity among executives tends to be relatively small for defender firms. Hence, tournament theory predicts that defender-type Chinese listed firms are more likely to have smaller tournament incentives as compared with prospector-type firms. We, therefore, develop the following hypothesis:
Hypothesis 1. Business strategy has a positive relation with tournament incentives in China: firms following a prospector-type strategy demonstrate stronger tournament incentives than those following a defender-type strategy.
Business strategy and tournament incentives: the moderating effects of ownership
In the Chinese stock market, a large proportion of listed companies are SOEs (J. Chen et al., 2011; Hass et al., 2016; Kato & Long, 2011). The strong government influence in China has important implications for firms in formulating their business strategies (H. Li & Zhou, 2005; Ruekert & Walker, 1987) which, in turn, may have significant implications for tournament incentives. Unlike executives in non-SOEs, executives in SOEs have not only economic motivation, but also political motivation. They could enjoy extensive perks through political promotion that are not available to their counterparts (H. Zhang et al., 2018). The higher the political position, the larger the perks they can consume. Hence, they are motivated to pursue political promotion rather than internal corporate promotion.
Furthermore, Chinese SOEs normally receive substantial financial support from the state, for example, government loans, reduced taxes, and government subsidies, enabling them to avoid potential bankruptcy (Sheng et al., 2019; Tao et al., 2017). Because of the aforementioned “guarantee” from the state in China and the lack of interest for Chinese SOE executives in pursuing higher cash compensation, state ownership could potentially weaken the positive association between business strategy and tournament incentives in China. We, therefore, develop the following hypothesis.
Hypothesis 2a. The positive relation between business strategy and tournament incentives is weaker in SOEs than in non-SOEs in China.
State ownership in China can be further classified into “central SOEs,” controlled by the central government, and “local SOEs,” controlled by the local government. 3 In recent decades, the major reforms of SOEs 4 in China have enabled such firms to better integrate into the market economy system, and to improve their corporate effectiveness and efficiency constantly to respond to intensive competition from private companies and multinational companies. However, previous evidence shows that local, but not central, SOEs pursue a diversification strategy in China (Y. Zhang & Li, 2006), because local governments in China are keen to promote regional gross domestic product (GDP) through enhancing production, output, and employment: outcomes of business diversification.
As local SOEs in China have a stronger market orientation and managerial autonomy, they have been prompted by market liberalization to deploy more aggressive and innovative business strategies targeted at their business priorities (M. H. Li et al., 2018). To implement such business strategies, more capable executives are demanded in local SOEs, thereby increasing the compensation gap for the enlarged candidate pool. However, the extent of state control over central SOEs’ business strategies is likely to be stronger, compared with their counterparts in local SOEs. To sustain macro-level growth and national industrial policies, central SOEs in China comply with more restrictive investment approval procedures and closer scrutiny of their diversification initiatives (M. H. Li et al., 2018). Given that there are significant differences in terms of Chinese government intervention between central- and local-level SOEs, we predict that within SOEs, local SOEs with more diversified strategies will have larger tournament sizes than those in central SOEs. We, therefore, develop the following hypothesis:
Hypothesis 2b. The positive relation between business strategy and tournament incentives is more pronounced for local SOEs than for central SOEs in China.
To better integrate into the global competitive environment and to further internationalize the local financial market, the Chinese authorities launched the QFII program in 2002. QFII are foreign institutional investors who take a long-term, strategic investment approach in Chinese stocks. QFII include many of the world’s largest asset managers, central banks, sovereign wealth funds, superannuation funds, and university endowments. Their tolerance for risk on long-term investment is relatively higher than that of domestic investors in China. This is because these foreign institutional investors can better diversify risks through their international portfolios. Moreover, unlike domestic investors, they are less troubled by connections with corporate insiders, thereby lowering the risk of managerial entrenchment and fostering value-increasing investments (Bena et al., 2017; N.Y. Liu et al., 2014).
Consistently, existing literature provides empirical evidence that foreign institutional investors encourage managers to focus more on long-term investment in innovation, human capital, internationalization of a firm’s operations, and firm valuation (Bena et al., 2017; Luong et al., 2014). As previously discussed, Chinese listed firms that pursue prospector-oriented strategies realize growth in firm value mainly through opening up new markets and identifying potential market opportunities that require them to invest substantially in R&D and marketing activities. Therefore, the presence of foreign ownership in Chinese listed companies can better serve prospectors’ strategic goals. Qiao and Li (2019) also document that the interplay between foreign institutional investors and their long-term investment philosophies positively impact firm innovation in China. Following this logic, we expect prospector-type firms with QFII (i.e., foreign ownership) to be more willing to increase the sizes of tournaments enabling them to attract more talented executives for implementing complex and innovative strategies. We, therefore, develop the following hypothesis.
Hypothesis 2c. The positive relation between business strategy and tournament incentives is more pronounced in Chinese listed firms with QFII than those without QFII.
Research design
Data and sample
We collected data from the China Stock Market and Accounting Research (CSMAR) database, to construct our independent variable (business strategy), dependent variable (tournament incentives), and control variables. We establish an unbalanced panel dataset of 5,705 firm-year observations with 1,765 unique firms in the Chinese A-share stock market (both Shanghai and Shenzhen Stock Exchange) for the period spanning 2011–2017 with non-missing business strategy, tournament incentives, and all the controls. The sample period starts from 2011 because one of the most important datasets needed for computing the strategy scores, R&D expenses, became available only from 2007 in the CSMAR database, and we require 5-year data for individual components to calculate strategy scores (explained below).
Measurement of business strategy
We employed the business strategy measurement developed by Bentley-Goode et al. (2013). They follow the theoretical notions of strategy typologies proposed by Miles and Snow (1978, 2003) but use accounting information to create a composite strategy score. This measure has been extensively used in contemporary empirical strategy literature (Bentley-Goode et al., 2013, 2017, 2019; Chen, Eshleman et al., 2017; G. Z. Chen & Keung, 2019; Habib & Hasan, 2017, 2019, 2020; Higgins et al., 2015; Sheng et al., 2019).
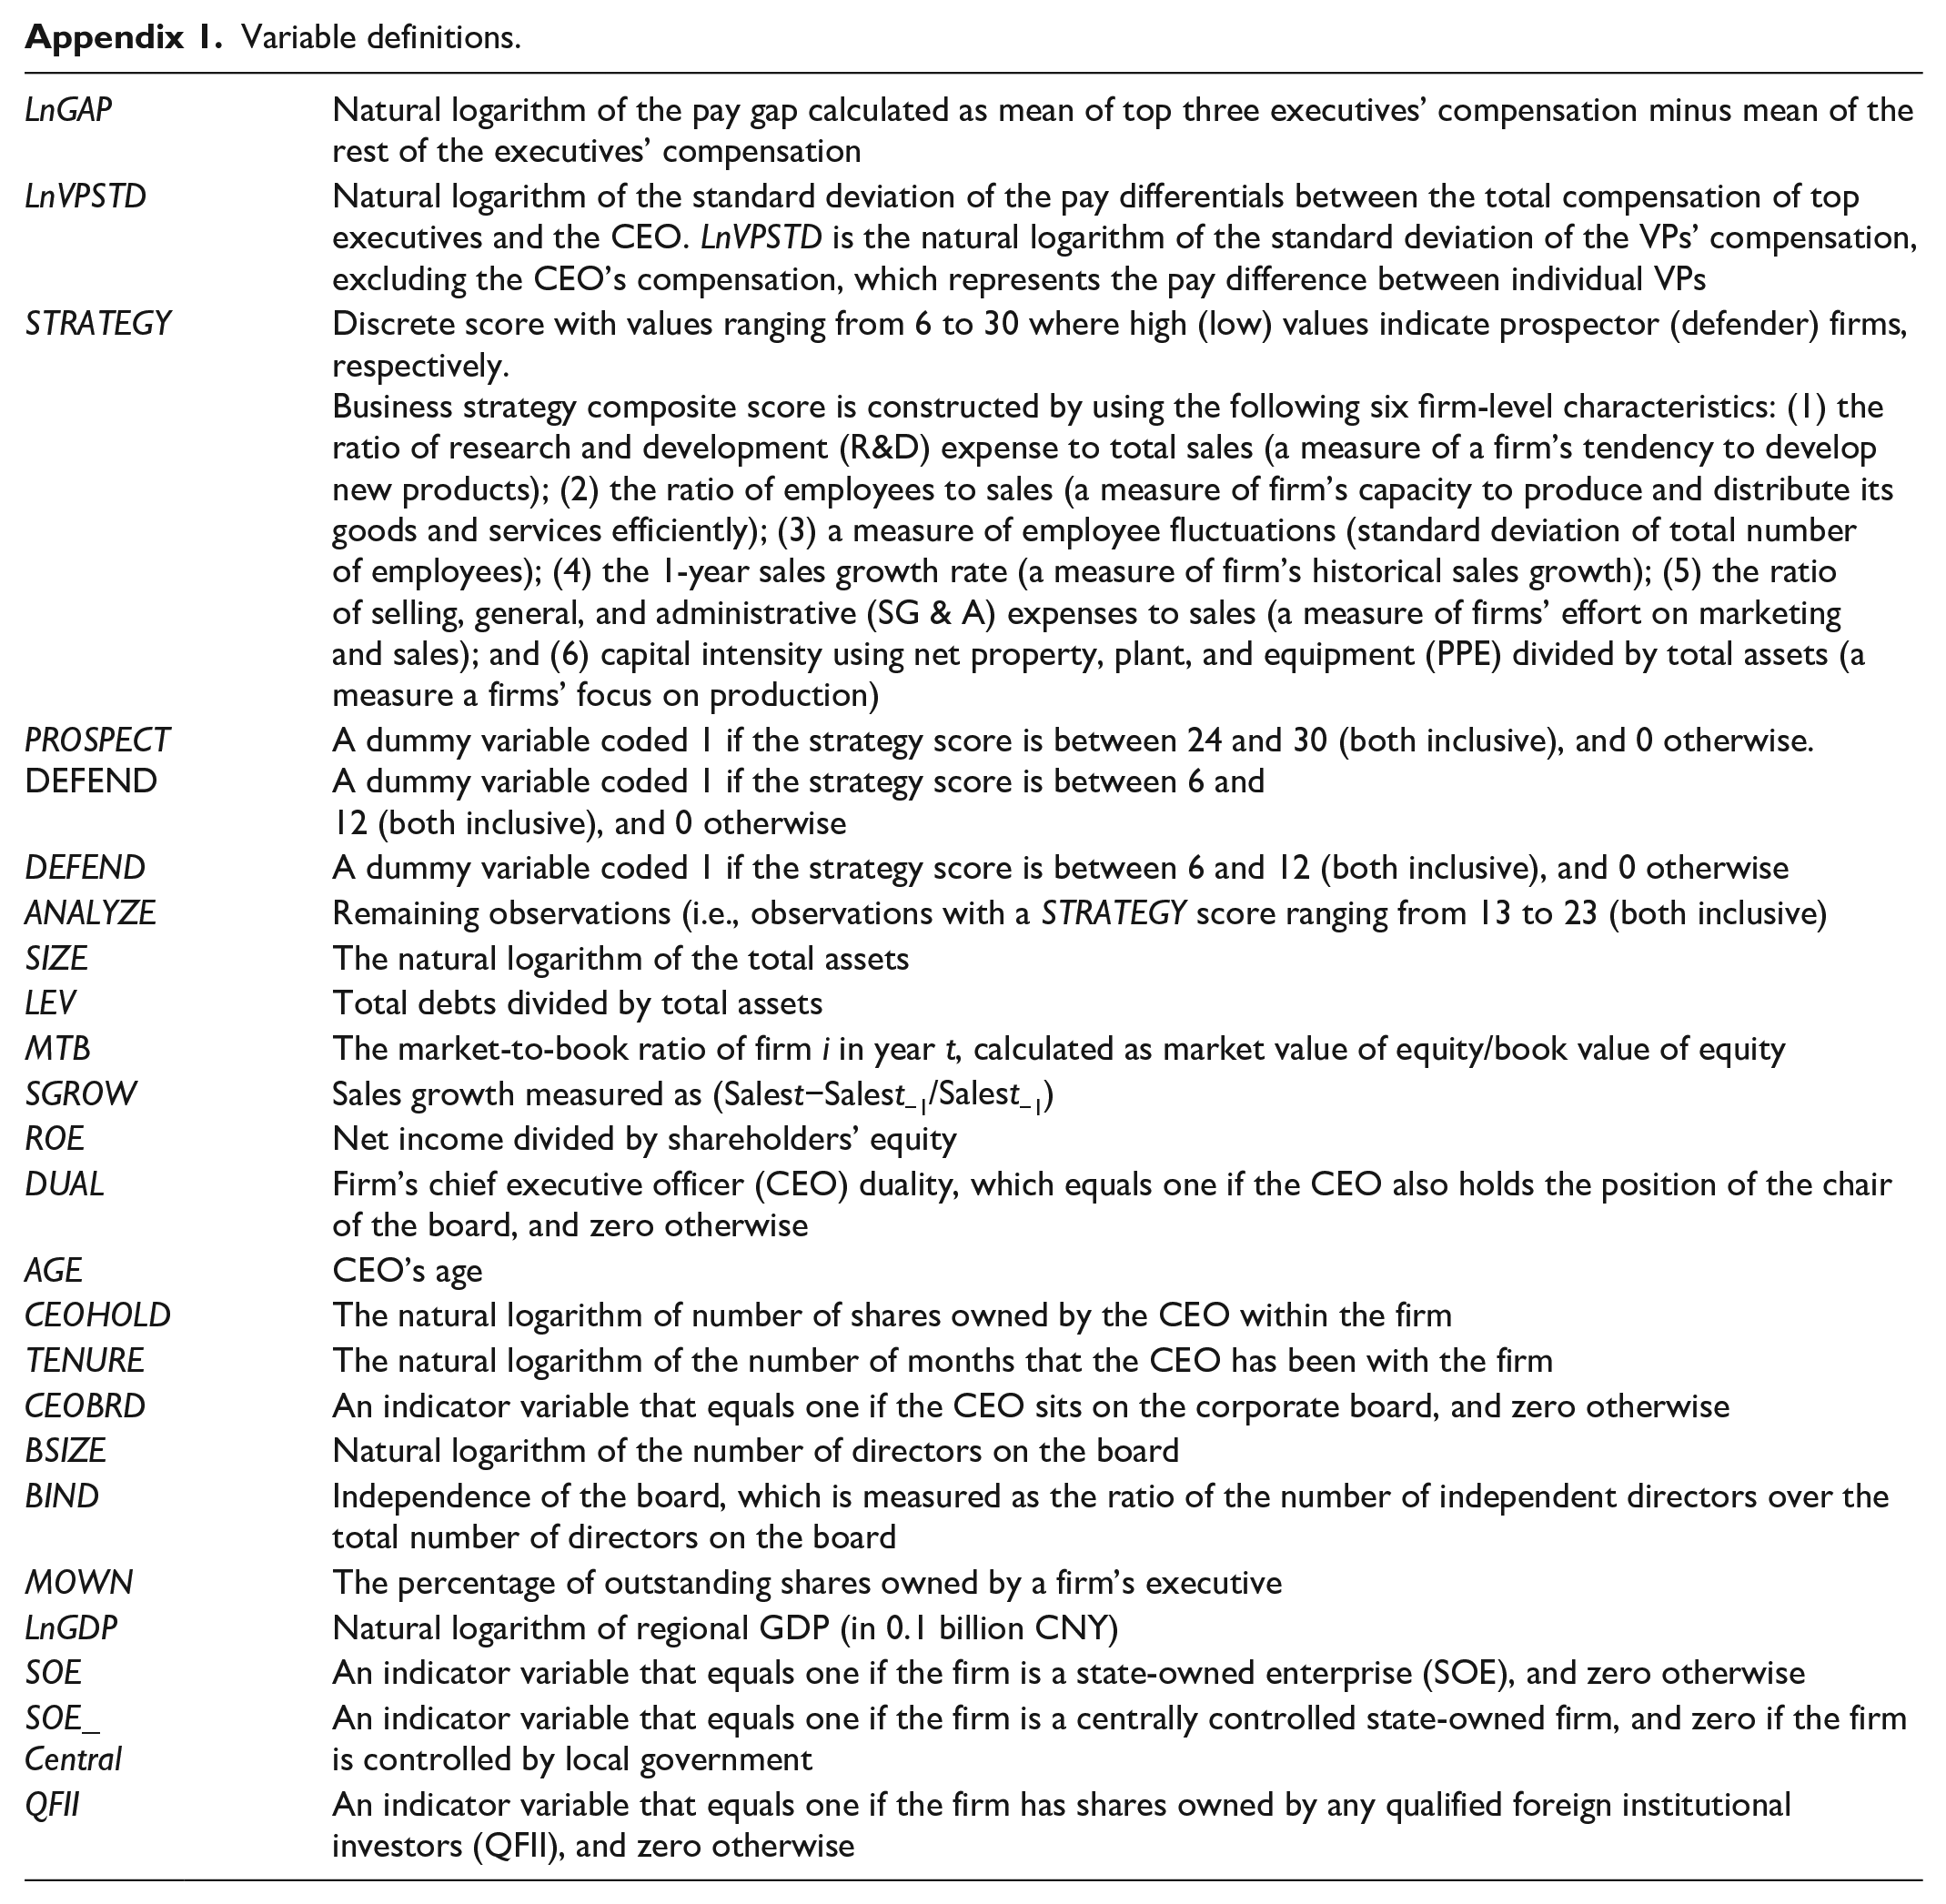
The main variable of interest is STRATEGY. We follow prior literature (e.g., Bentley-Goode et al., 2013; Chen, Eshleman et al., 2017; G. Z. Chen & Keung, 2019; Higgins et al., 2015; Ittner et al., 1997; Sheng et al., 2019) and compute strategy score by using the following six firm characteristics: (1) the ratio of R&D expense to total sales (measure of a firm’s propensity to seek new products); (2) the ratio of employees to sales (firm’s ability to produce and distribute its goods and services efficiently); (3) a measure of employee fluctuations (standard deviation of total employees); (4) the 1-year sales growth rate (proxy for a firm’s historical growth); (5) the ratio of marketing (selling, general, and administrative expenses) to sales (a proxy for firms’ emphasis on marketing and sales); and (6) a measure of capital intensity (net property, plant, and equipment scaled by total assets; designed to capture a firms’ focus on production).
Consistent with previous literature (Bentley-Goode et al., 2013), all variables are computed using a rolling average over 5 years (including the current year). We then rank each variable within each industry-year. 5 Within each firm-year, those observations with variables in the highest quintile are assigned a score of 5, while those in the lowest quintile are assigned a score of 1 (except capital intensity, which is reverse-scored so that observations in the lowest (highest) quintile are given a score of 5 (1). Then for each firm-year, we add up the scores for each of the six variables to get the total composite score. The highest possible score that a company could receive is 30 (prospector-type) and the lowest possible score is 6 (defender-type).
This continuous measure is our primary STRATEGY variable. However, this continuous variable does not categorize firms into three distinct strategy groups but, instead, only suggests that a higher (lower) score represents prospector (defender)-type firms. Following Bentley-Goode et al. (2013) and other research using their strategy classification, we create three separate groups namely, PROSPECT (a dummy variable, coded 1 if strategy score ⩾ 24, and 0 otherwise); DEFEND (a dummy variable, coded 1 if strategy score ⩽ 12, and 0 otherwise), and ANALYZE (a dummy variable, coded 1 if strategy score ⩾ 13 and ⩽ 23, and 0 otherwise). We use analyze as the benchmark group, because prospect and defend firms sit at opposite ends of the strategy spectrum. Refer to Appendix 1 for additional details of the key features of each strategic type.
Measurement of tournament incentives
In this study, we employ LnGAP and LnVPSTD as the main proxies for tournament incentives. Tournament incentives are usually captured by the pay difference between the CEO and remaining executives (Kini & Williams, 2012; Lazear & Rosen, 1981; Park, 2017). However, in China, publicly listed firms are mandatorily required to provide only the (1) total salary paid to the three highest paid executives and (2) the total salary paid to all executives (Conyon & He, 2011; B. X. Lin & Lu, 2009). The top executive team includes the President, Vice Presidents, Secretary to the Board, and other senior executives, as reported in the annual reports, excluding independent directors and supervisory board members (CSMAR). We find that approximately 67% of the sample firm-year observations did not report CEO compensation (either the CEO’s name or data related to CEO compensation were missing). We, therefore, follow previous Chinese studies (Liao et al., 2009; B. X. Lin & Lu, 2009; Sun et al., 2019; H. Zhang et al., 2018), and use the natural logarithm of the average pay gap between the top three executives and the remaining executives (LnGAP) to proxy for tournament incentives. Besides, we also use LnVPSTD, defined as the natural logarithm of the standard deviation of the pay disparity between the total payment of top executives and the CEO, as an alternative proxy for tournament incentives (Sun et al., 2019; H. Zhang et al., 2018).
Empirical model
To investigate the impact of business strategy on tournament incentives, we use the regression models as shown below
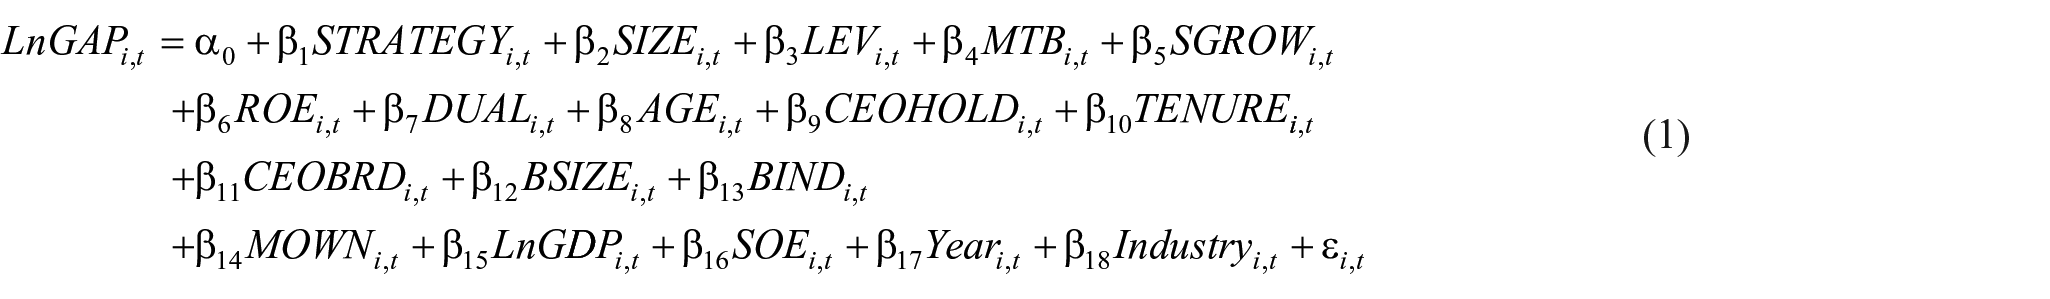
Our variable of primary interest is STRATEGY. A positive and a significant coefficient on STRATEGY would support H1. We include a series of control variables following prior literature on the determinants of tournament incentives (Burns et al., 2017; Kale et al., 2009). To control for firm-level fundamental factors, we include SIZE, calculated as the natural log of a firm’s total assets. In line with prior studies, we expect SIZE to be positively related to tournament incentives since executive pay level increases with firm size (Burns et al., 2017; Kale et al., 2009; Murphy, 1999). LEV is total liability divided by total assets and is expected to be associated with tournament incentives negatively (He & Fang, 2016; Jiang et al., 2019; Sun et al., 2019). MTB is the market value of shareholder’s equity divided by the book value of shareholder’s equity. Sun et al. (2019) find that MTB is correlated with tournament incentives negatively, while Jia (2018) show the opposite result. SGROW is defined as percentage change in sales from the prior year to the current year. Given the lack of prior evidence on any expected association between SGROW and tournament incentives, we do not make any directional prediction. ROE is calculated by dividing net income by shareholders’ equity. We expect ROE to be related to tournament incentives positively as evidenced in previous studies (Burns et al., 2017; He & Fang, 2016; Kale et al., 2009; B. X. Lin & Lu, 2009).
To isolate the possible confounding effect of CEO power on pay disparity, our model also includes DUAL (a dummy variable coded 1 if the CEO is also the chairman of the board, and zero otherwise), AGE (CEO’s age), CEOHOLD (the natural logarithm of number of shares held by the CEO within the firm), TENURE (the natural logarithm of the number of months that the CEO has been with the firm) and CEOBRD (a dummy variable that equals 1 if the CEO sits on the corporate board, and 0 otherwise), which are commonly used as proxies to denote CEO power. Equation (1) further controls for the firm-level corporate governance variables, including BSIZE (the natural logarithm of the number of directors on the board), BIND (the ratio of the number of independent directors over the total number of directors on the board), and MOWN (the percentage of outstanding shares owned by a firm’s executive). We also include a control for the effect of regional GDP (LnGDP) on firms’ executive compensation and government ownership, that is, SOE (a dummy variable coded 1 if the firm is a State-Owned Enterprise [SOE], and 0 otherwise). A list of definitions of all variables is provided in Appendix 1. We also include industry and year dummies to control for industry and year fixed effects, respectively. To alleviate concerns about potential cross-sectional and time-series dependence in the data, we compute t-values based on robust standard errors clustered by firm.
Empirical results
Descriptive statistics and univariate results
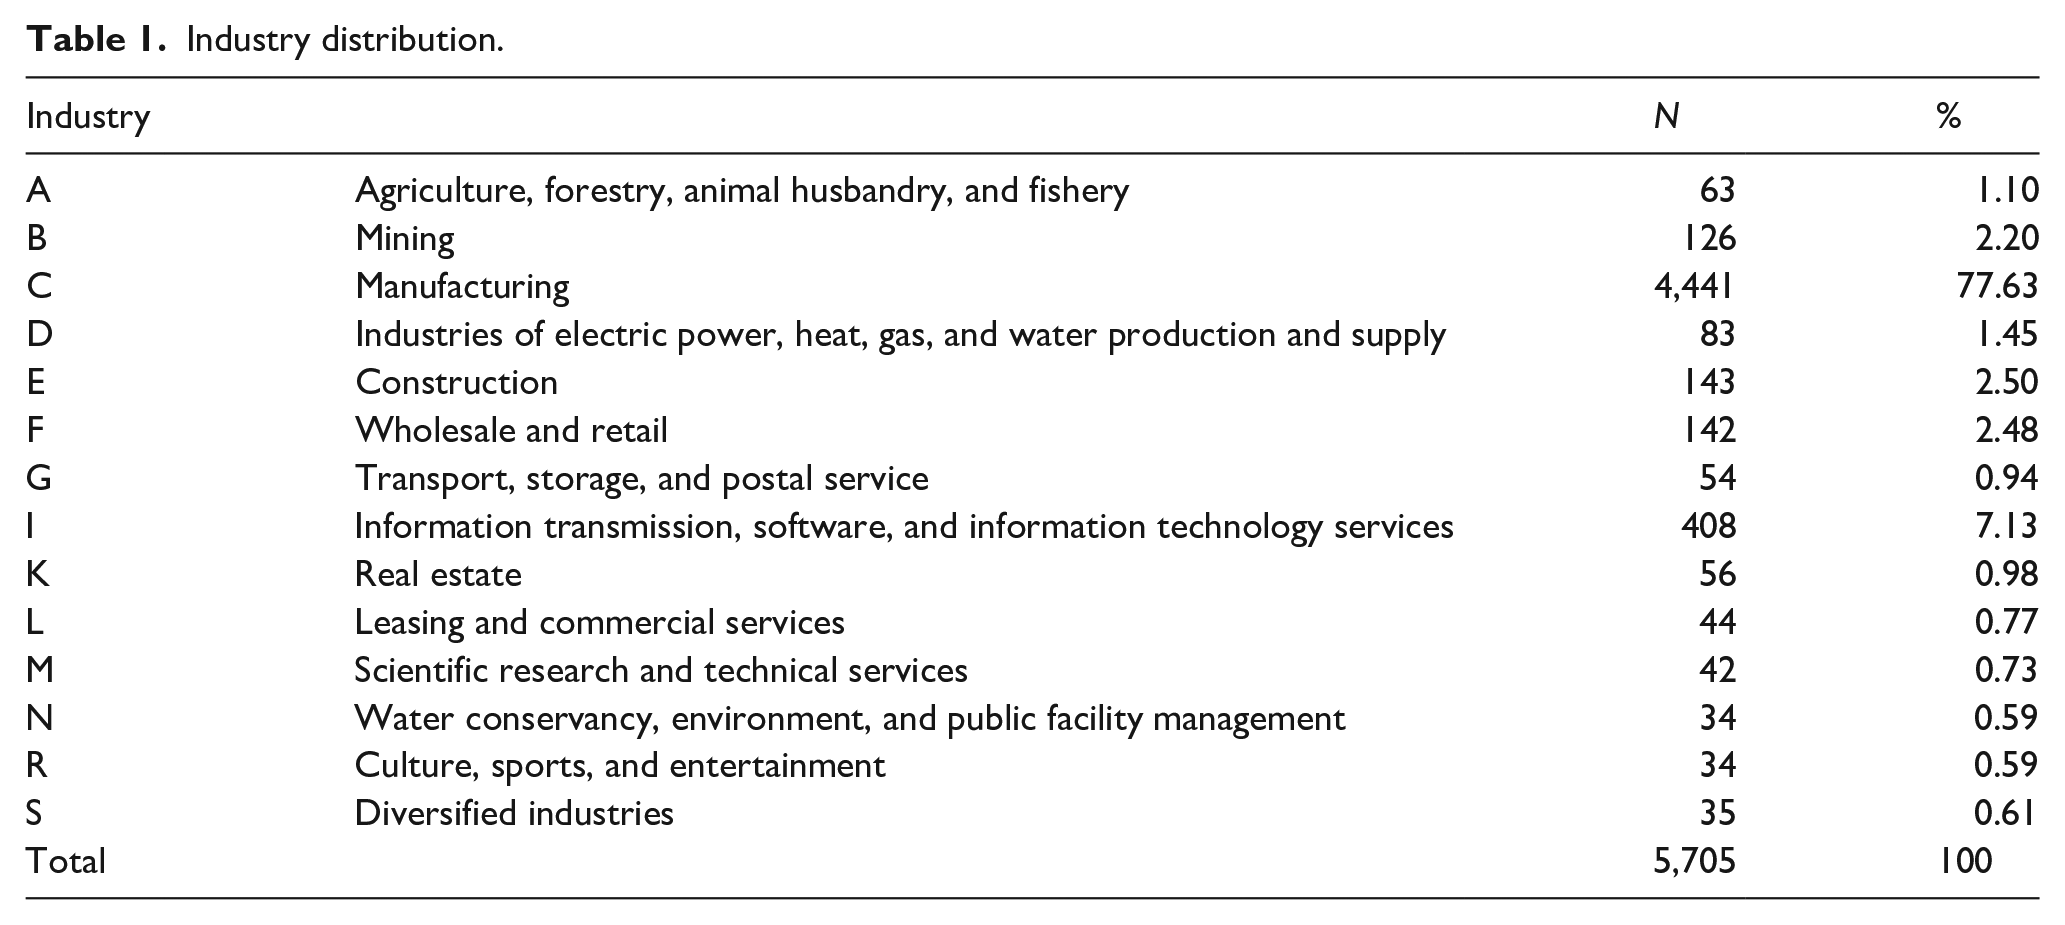
Table 1 exhibits the sample distribution across industries. Industries are categorized according to the Guidance on the Industry Category of Listed Companies issued by the China Securities Regulatory Commission (CSRC) in 2012. The top three industries are manufacturing (77.63%), followed by construction (2.50%), and wholesale and retail (2.48%). The industry composition of the sample firms is similar to that of all listed firms in the two Chinese stock exchanges that are dominated by the manufacturing sector.
Industry distribution.
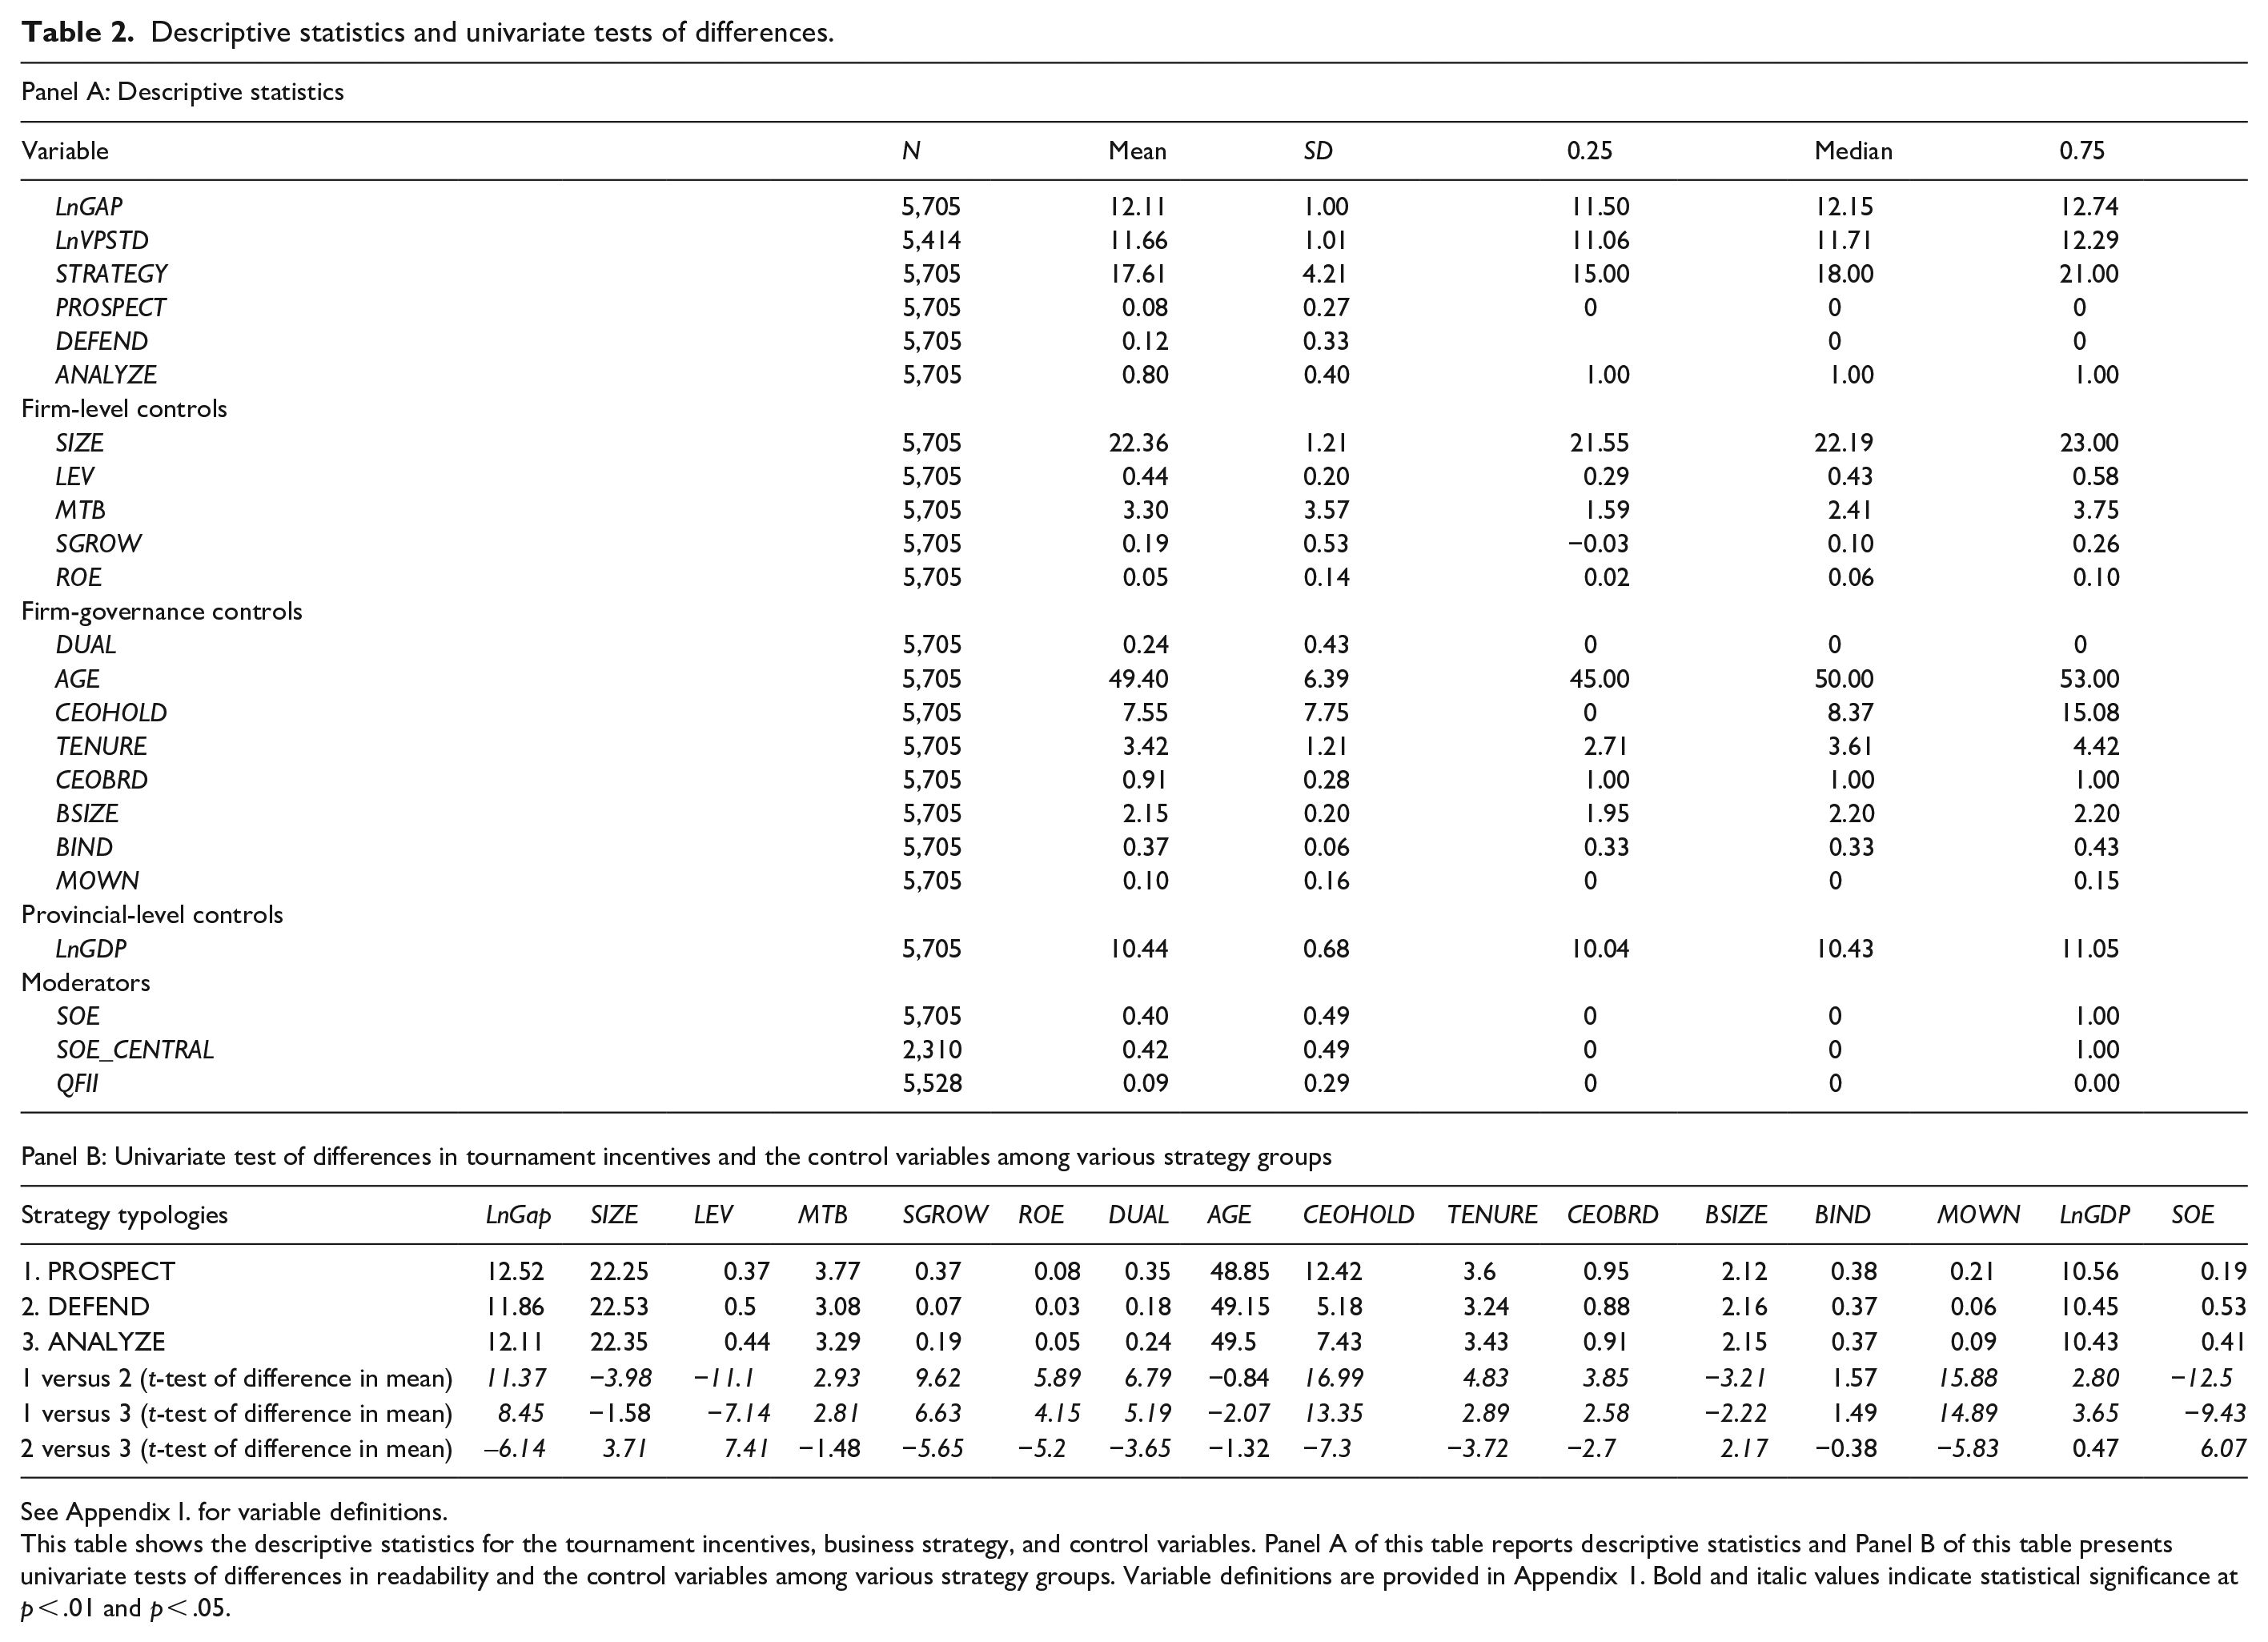
Panel A of Table 2 summarizes descriptive statistics for the regression variables. We winsorize the continuous variables at the 1% and 99% levels to reduce the possible impact of outliers. As shown in Table 2, Panel A, the mean (median) value of our independent variable STRATEGY is 17.61 (18.00). About 8.12% of the firm-years are prospector firms (PROSPECT) and 12.32% are defender firms (DEFEND). The mean (median) value of LnGAP is 12.11 (12.15), with an interquartile range of 11.50 to 12.74, which is close to that found by Sun et al. (2019). The alternative tournament incentives variable, LnVPSTD has a mean (median) value of 11.66 (11.71), with an interquartile range of 11.06 to 12.29. In general, the distributions of these control variables are similar to the statistics documented in previous studies (G. Z. Chen & Keung, 2019; Sun et al., 2019; H. Zhang et al., 2018).
Descriptive statistics and univariate tests of differences.
See Appendix 1. for variable definitions.
This table shows the descriptive statistics for the tournament incentives, business strategy, and control variables. Panel A of this table reports descriptive statistics and Panel B of this table presents univariate tests of differences in readability and the control variables among various strategy groups. Variable definitions are provided in Appendix 1. Bold and italic values indicate statistical significance at p < .01 and p < .05.
For firm-level controls, the average firm size (SIZE) in our sample is 22.36, with a mean leverage (LEV) ratio of .44, a market-to-book (MTB) ratio of 3.30, an average SGROW of 19%, and an average return on equity (ROE) of 5%. The mean values of the above basic control variables are similar to those found in previous studies (He & Fang, 2016; Y. Liu et al., 2015; Sun et al., 2019; H. Zhang et al., 2018). About 24% of the CEOs chair the board (DUAL), and an average CEO is 49 years old (AGE). CEOs, on average, hold about 25 million shares in the company (CEOHOLD), and have an average tenure of 42.6 months (TENURE). Approximately 91% of CEOs sit on corporate boards (CEOBRD). Panel A of Table 2 also indicates that an average board consists of 9 members (BSIZE), and 33% of board members are independent directors (BIND). Besides, the top management team on average owns 73 million shares (MOWN) within the firm. The regional GDP data show the average GDP across all regions in China is US$570 billion (LnGDP). About 40.5% of firm-year observations are SOEs (SOE).
Panel B of Table 2 also reports the univariate test of differences in mean values of the regression variables for firms pursuing different business strategies. It indicates that the mean LnGAP is 12.52 for the prospector group compared to 11.86 for the defender group. The difference is statistically significant (t-statistic 11.37, p < .01). Also, compared to the DEFEND group (M = 11.86), the ANALYZE group (M = 12.11) has significantly high tournament size. These findings support the theoretical argument that firms pursuing the prospector-type (defender-type) business strategy are associated with high (low) tournament size. Panel B of Table 2 also shows that compared to the DEFEND/ANALYZE group, the PROSPECT firms have significantly lower leverage and more growth opportunities; they are located in more developed regions and are less controlled by government. Prospect-type firms also show high values for DUAL, CEOHOLD, TENURE, and CEOBRD. These statistics clearly show the importance of controlling these factors in our regression model.
Correlation analysis
Table 3 shows the Pearson correlation matrix for the variables used in the basic regression models. STRATEGY is correlated positively and significantly with LnGAP (coefficients of .15, p < .01), thereby, providing univariate support to H1. Consistent with previous studies, control variables such as SIZE, SGROW, and ROE are correlated with LnGAP positively and significantly, while LEV is correlated negatively and significantly (Jiang et al., 2019). The correlations between LnGAP and most of the CEO characteristics, DUAL, AGE, and CEOHOLD are positive and significant (coefficients = .09, p < .01; coefficients = .05, p < .01; coefficients = .11, p < .01; He & Fang, 2016). BSIZE is correlated negatively with LnGAP and BIND is positively associated with LnGAP (coefficient = −.02, p < .1; coefficient = .04, p < .01): results that are largely consistent with prior studies (Sun et al., 2019). The regional GDP is positively related to LnGAP as the coefficient of LnGDP is .18 (p < .01). As expected, SOE is significantly and negatively related to LnGAP (coefficient = −.19, p < .01).
Correlation analysis.
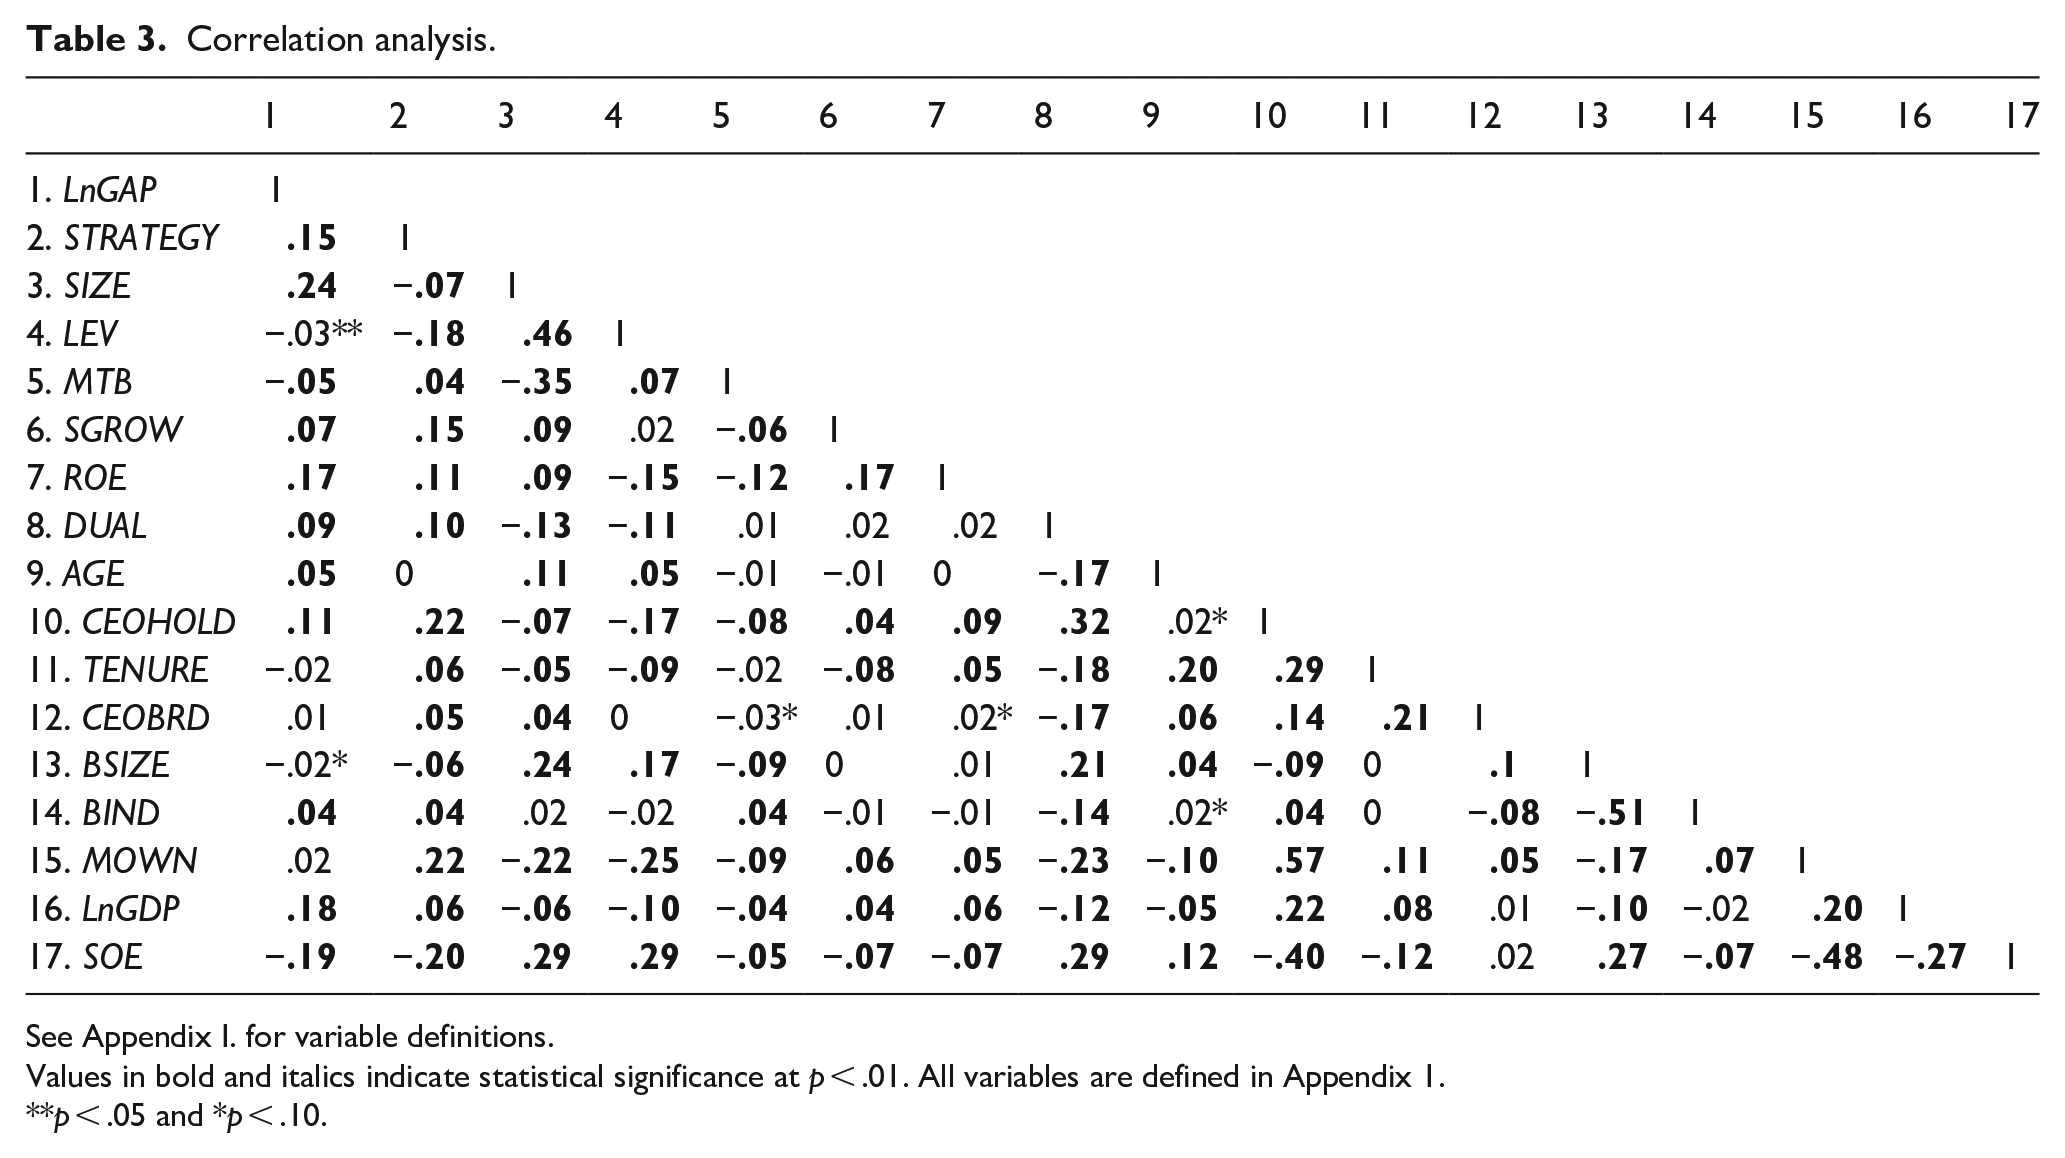
See Appendix 1. for variable definitions.
Values in bold and italics indicate statistical significance at p < .01. All variables are defined in Appendix 1.
p < .05 and *p < .10.
Baseline regression results
Table 4 reports the ordinary least squares (OLS) regression results for H1. The coefficient of our main variable of interest, STRATEGY, exhibits a positive and significant coefficient of .027 (p < .01) in Column (1), thereby supporting H1. In terms of economic significance, this reported coefficient suggests that a one standard deviation increase in STRATEGY (SD = 4.21) increases LnGAP by 11.37% (.027 × 4.21). Consistent with prior studies ( Burns et al., 2017; Jiang et al., 2019; Kale et al., 2009; B. X. Lin & Lu, 2009) and our prediction, we find a significantly positive coefficient for SIZE (coefficient = .315, p < .01), MTB (coefficient = .022, p < .01) and ROE (coefficient = .699, p < .01), and a negative coefficient for LEV (coefficient = −.541, p < .01). CEO characteristics, such as DUAL and AGE are positively and significantly related to LnGAP (coefficient = .096, p < .05; coefficient = .007, p < .05; He & Fang, 2016). The coefficient on LnGDP is positive (coefficient = .173, p < .01) while that on SOE is negative (coefficient = −.454, p < .01). The remaining control variables are related insignificantly to LnGAP.
OLS regression results of the relation between business strategies and tournament incentives.
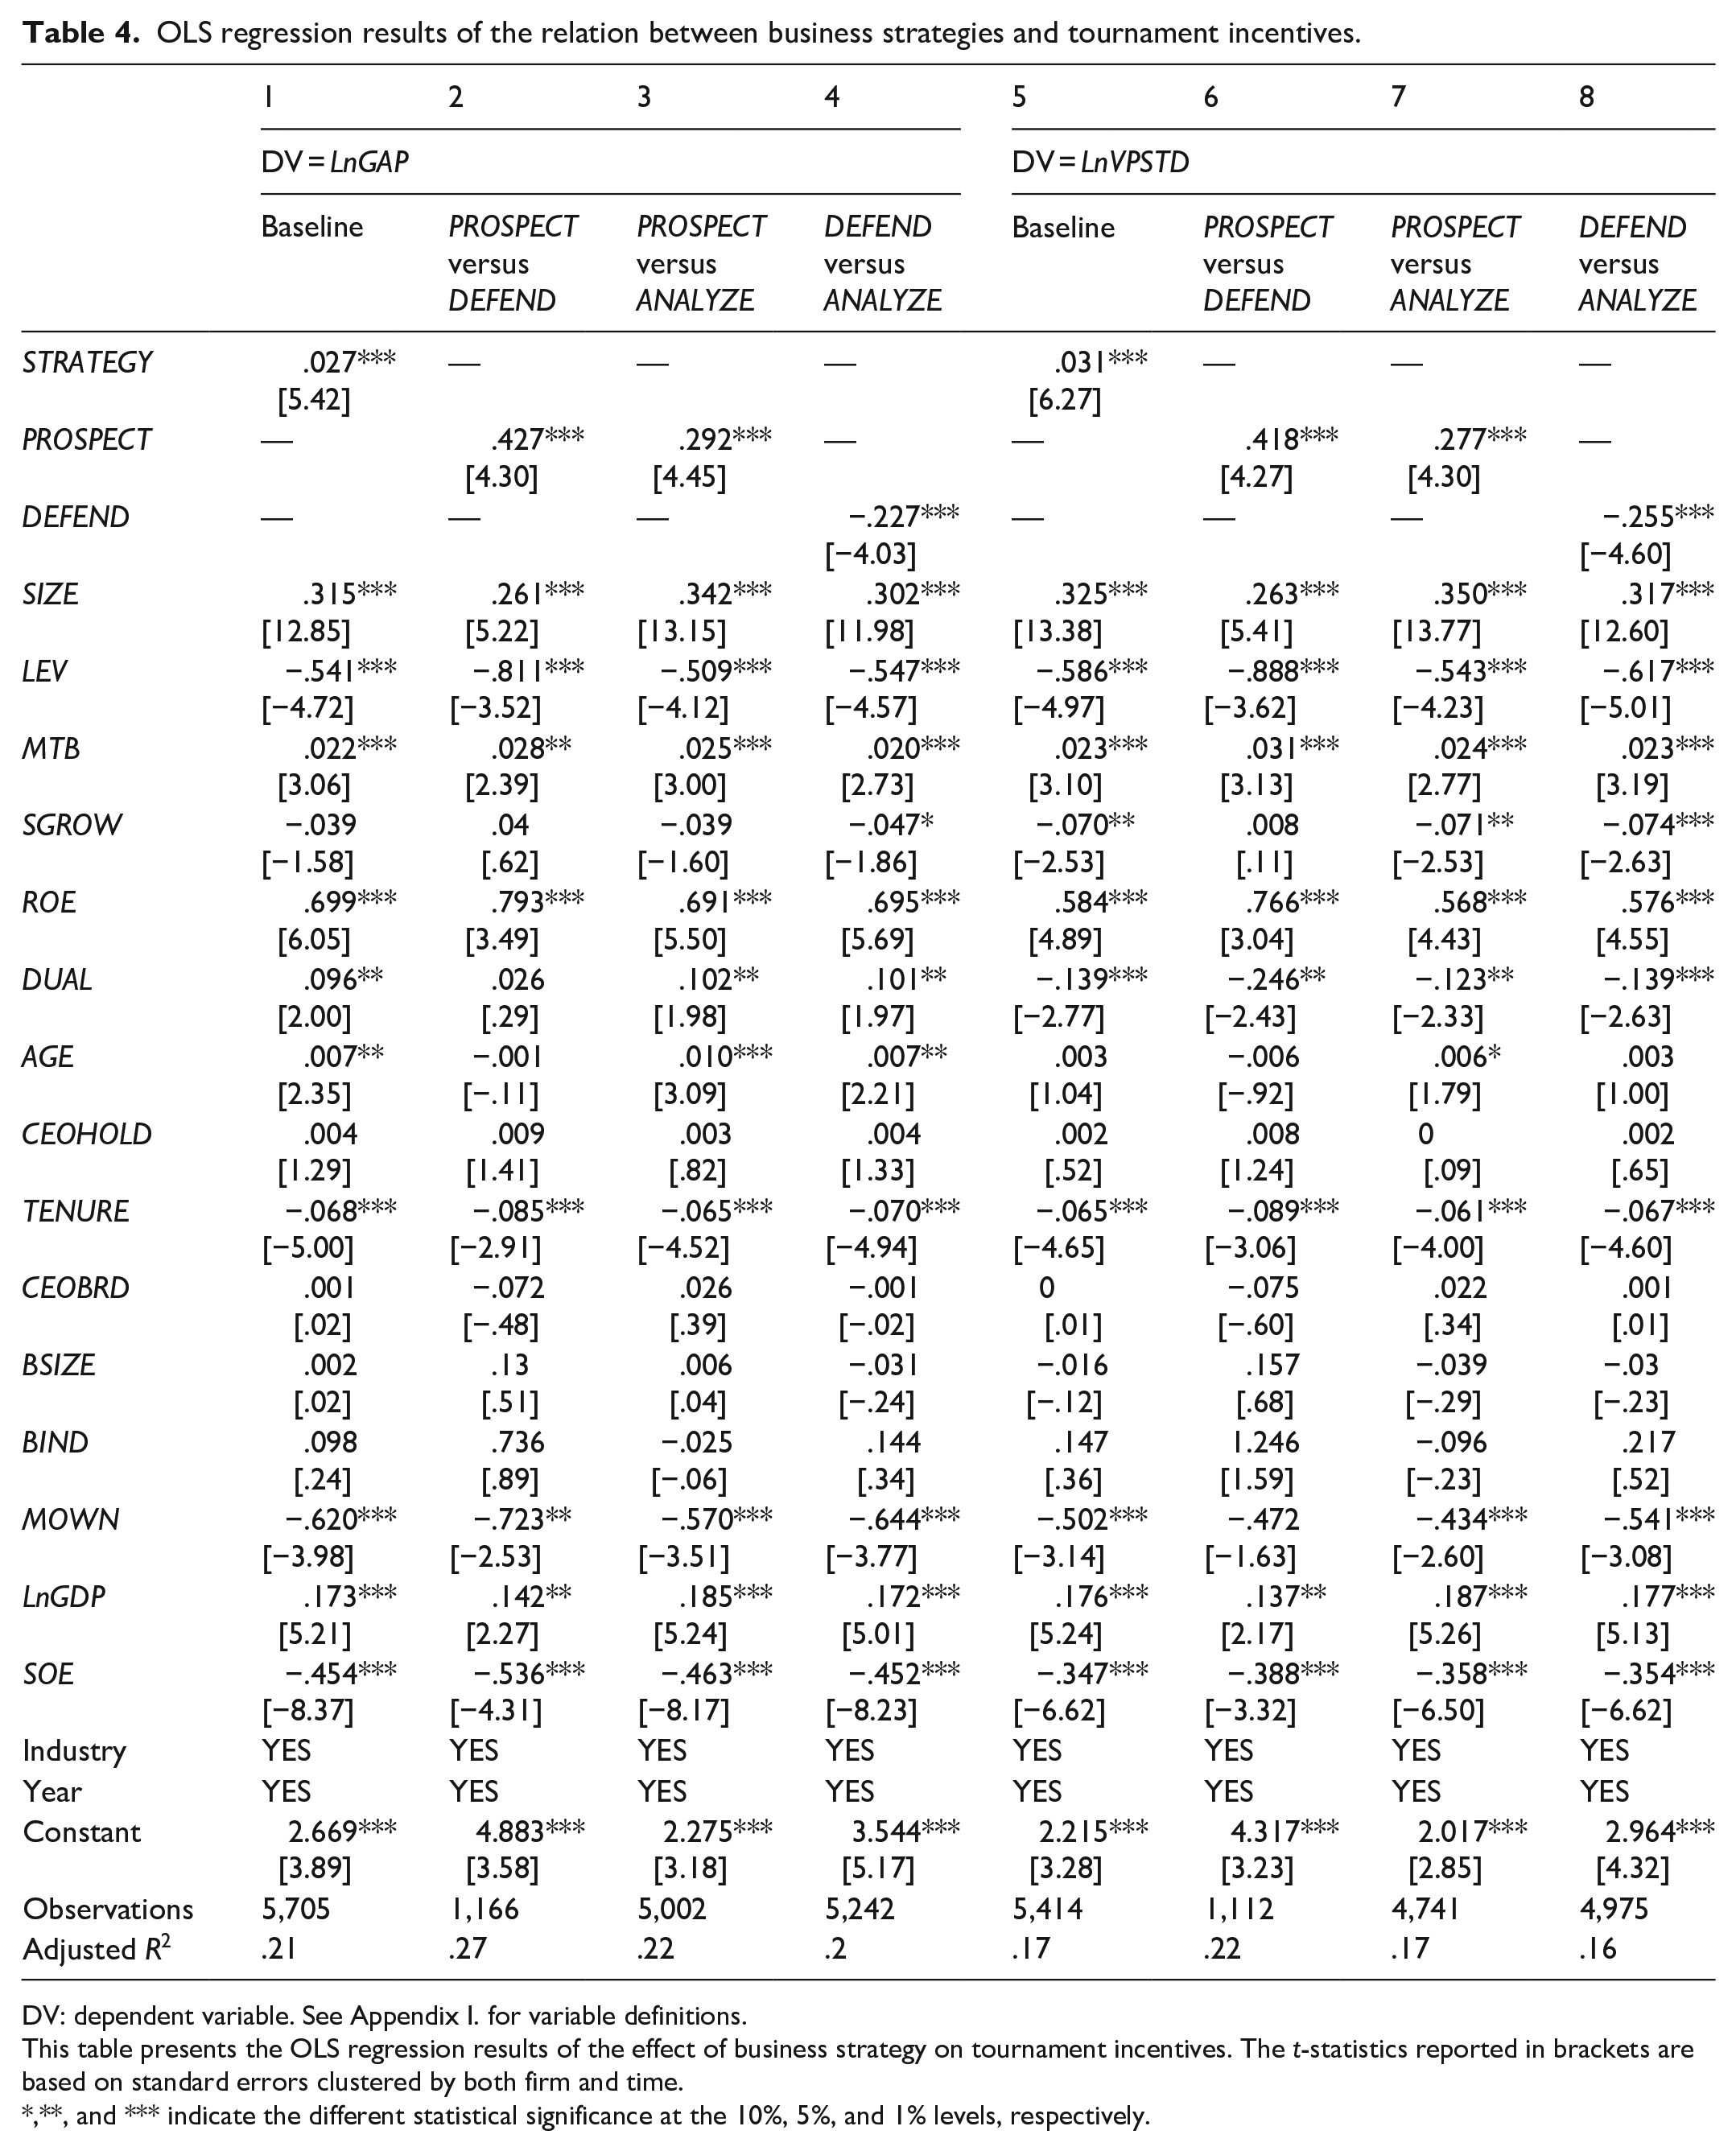
DV: dependent variable. See Appendix 1. for variable definitions.
This table presents the OLS regression results of the effect of business strategy on tournament incentives. The t-statistics reported in brackets are based on standard errors clustered by both firm and time.
*, **, and *** indicate the different statistical significance at the 10%, 5%, and 1% levels, respectively.
Columns (2) to (4) report the regression results for Equation (1) for the sub-sample of firms pursuing different business strategies. Column (2) shows the coefficient on PROSPECT is positive and significant (coefficient = .427, p < .01) when we restrict the sample to firms consisting of PROSPECT and DEFEND firm-year observations. Column (3) shows the coefficient on PROSPECT is positive and significant (coefficient = .292, p < .01) when compared with ANALYZE-type firms. Finally, column (4) reports the coefficient on DEFEND is negative and significant (coefficient = −.227, p < .01) as compared with ANALYZE-type firms. The sign and significance of most of the control variables such as SIZE, MTB, LEV, DUAL, LnGDP, and SOE are generally consistent with estimates in Column (1) of Table 4. Taken together, our results in Table 4 confirm that business strategy (STRATEGY) and prospect-type firms (PROSPECT), in particular, are positively related to LnGAP.
Columns (5) to (8) report the regression results for Equation (1) using LnVPSTD as an alternative proxy for tournament incentives. We find the relationship between business strategy and this alternative tournament measure to be positive and significant as well (coefficient = .031, p < .01 in Column 5). Moreover, in Columns (6) to (8), the results of sub-sample groups under two different strategies are consistent with results reported in Columns (2) to (4). Overall, the results in Table 4 show that firms with innovative strategies are more likely to enlarge tournament size as compared with defenders.
Business strategy and tournament incentives: the moderating effects of ownership structure
Table 5 presents the regression results of the moderating effects of government ownership and QFII on the relationship between business strategy and tournament incentives. Regressions results are based on sub-sampling procedure, which allows the coefficients on all the control variables to vary between the groups. To test H2a, we group the observations into SOE versus non-SOE groups. Results are reported in Columns (1) and (2), respectively. Results in Table 5 report that the coefficients on STRATEGY are positive and significant for both the SOE, Column (1), coefficient = .023, p < .01, and non-SOE groups, Column (2), coefficient = .025, p < .01. Results of the chi-square test show that the coefficient of the STRATEGY variable is insignificant between the two groups (χ2 .09, p = .765). This finding does not support Hypothesis 2a. Columns (3) and (4) in Table 5 report the results for Hypothesis 2b. We re-estimate the regression for SOE_Central, coded 1 if an SOE is centrally controlled, and 0 otherwise (local SOEs). We find that positive and significant association between business strategy and tournament incentives holds only for local SOEs (coefficient = .042, p < .01; Column 4). Results of the chi-square test show that the coefficient of the STRATEGY variable is significantly different between the two groups (χ2 19.28, p = .001). We, therefore, find support for Hypothesis 2b.
Business strategies and tournament incentives: The effect of ownership structure.
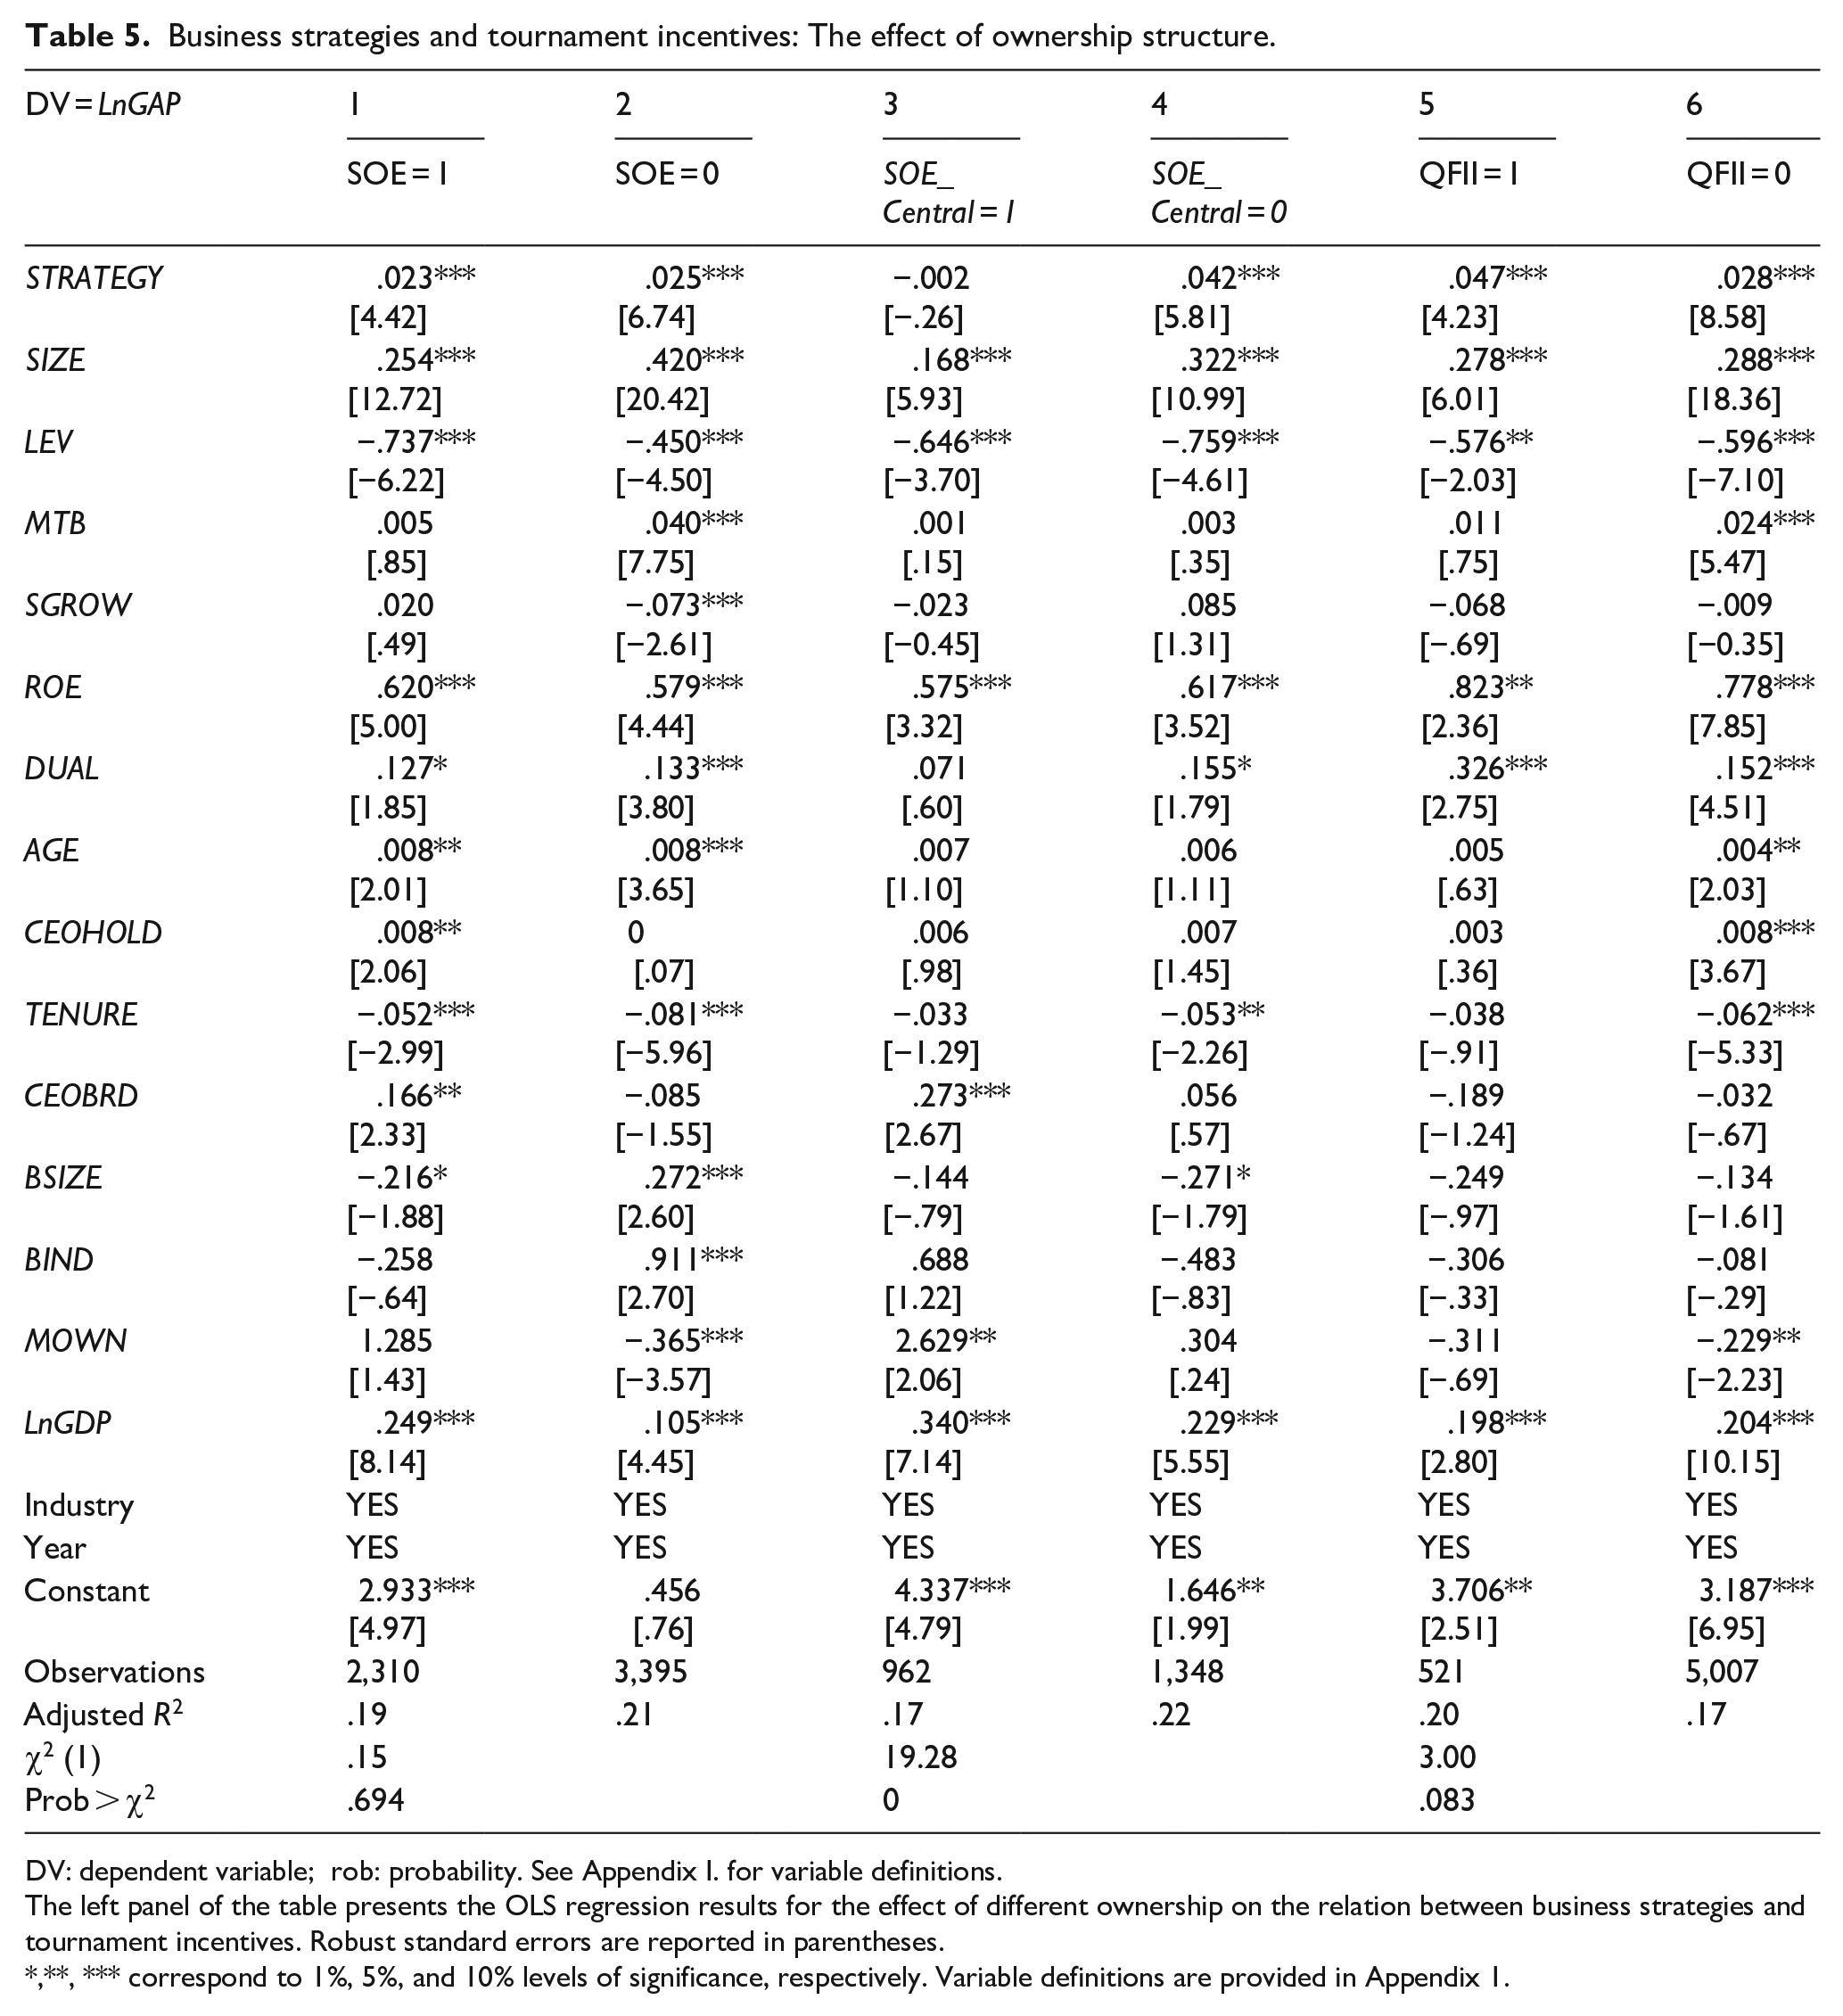
DV: dependent variable; rob: probability. See Appendix 1. for variable definitions.
The left panel of the table presents the OLS regression results for the effect of different ownership on the relation between business strategies and tournament incentives. Robust standard errors are reported in parentheses.
*, **, *** correspond to 1%, 5%, and 10% levels of significance, respectively. Variable definitions are provided in Appendix 1.
Finally, Columns (5) and (6) of Table 5 present the results for Hypothesis 2c, that is, the moderating effect of foreign institutional investors (QFII) on the association between business strategy and tournament incentives. We create an indicator variable coded 1 if a firm has shares owned by any QFII, and 0 otherwise (non-QFII). The results indicate that the coefficients on STRATEGY are positive and significant for both the QFII, in Column (5), coefficient = .047, p < .01, and the non-QFII, in Column (6), coefficient = .028, p < .01, groups. However, the magnitude of the coefficient is greater for firms with QFII, compared with firms without QFII. Results of the chi-square test show that the coefficient of the STRATEGY variable is significantly different between the two groups (χ2 3.00, p = .09). We, therefore, find support for Hypothesis 2c.
Endogeneity test
Although our results present a positive relationship between business strategy and tournament incentives, the sign, magnitude, and statistical significance of these estimates may be biased if firm-level business strategy is associated with the error term (e) in equation (1) (Wooldridge, 2002). To control for endogeneity that arises from observable, rather than unobservable factors (Shipman et al., 2017), we conduct propensity score matching analysis (PSM) by matching sample firms with control firms having similar characteristics according to a function of covariates (Rosenbaum & Rubin, 1983, 1985). We use the nearest neighbor (NN), radius, and kernel techniques to perform the PSM tests.
In our setting, we first model the determinants of business strategy among firms. Instead of grouping firms based on the mean (median) of their strategy score, we consider firms as PROSPECT (treatment group) if their strategy scores are equal or above 24, and those firms with a strategy score equal or lower than 12 as DEFEND (control group). We do so because there is a large proportion (about 80%) of firms belonging to ANALYZE groups. Partitioning the sample based on the median strategy score will result in many analyzer firms becoming prospector as well as defender firms. To ensure a balance between treated and control subjects in the matched sample (Austin, 2011), we include all of the control variables as shown in equation (1) as potential determinants of firm-level business strategy. One important function of PSM is to examine the distribution of measured baseline covariates between treated and control subjects. If there are no systematic differences in the baseline covariates between these two groups after conditioning on the propensity score, the propensity-scoring model has been correctly specified (Austin, 2011).
In Table 6, Panel A, the p-values for the t-test indicate that the matching algorithm was successful in achieving balance for all of the covariates. All the 15 t-tests are statistically insignificant between the treated and the control sub-groups in all 3 PSM techniques conducted with a caliper of .01 and without replacement for the NN, radius and kernel methods. Panel B of Table 6 also presents the PSM regression results for the NN (Columns 1 and 4); radius (Columns 2 and 5), and kernel (Columns 3 and 6) methods. Results in Columns (1) to (6) are consistent with the main results. For example, the coefficients on STRATEGY are positive and significant for both the LnGAP (.035, p < .01) and LnVPSTD (.035, p < .01) specifications in Column (1) and in Column (4) for the NN method. Overall, the PSM analysis provides robust evidence about the positive association between business strategy and tournament incentives.
Propensity-matched technique.
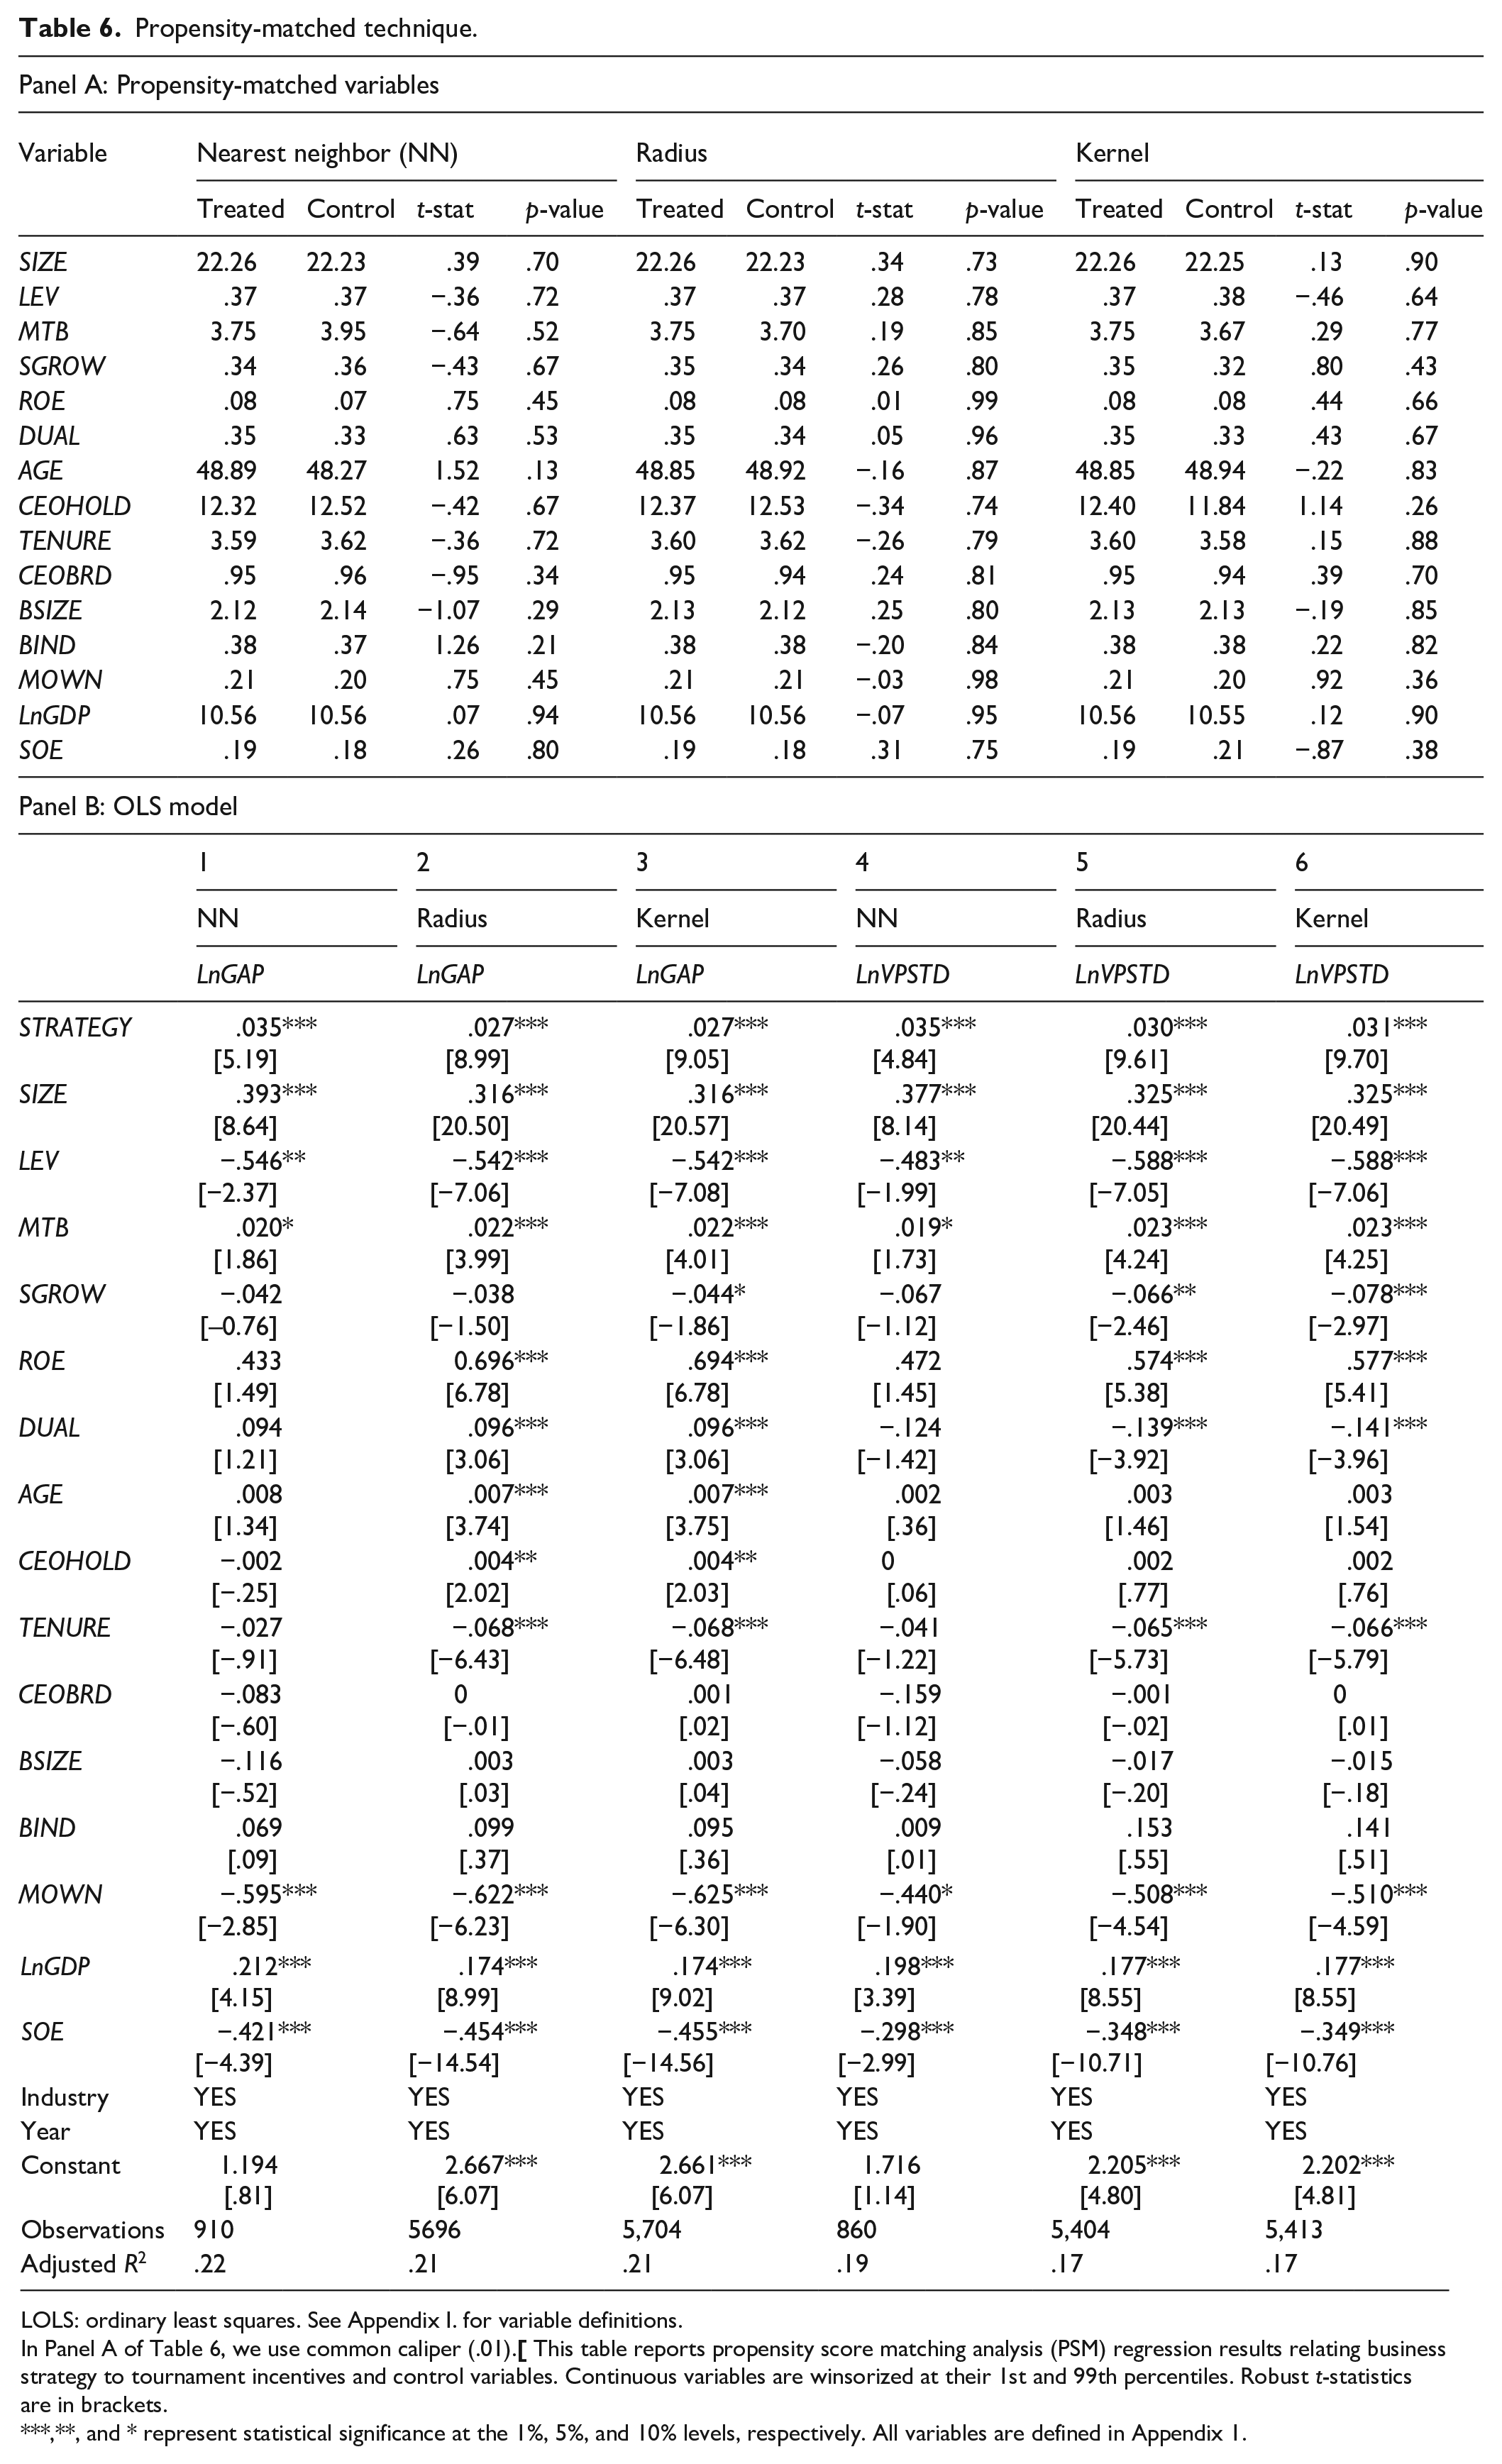
LOLS: ordinary least squares. See Appendix 1. for variable definitions.
In Panel A of Table 6, we use common caliper (.01).
***, **, and * represent statistical significance at the 1%, 5%, and 10% levels, respectively. All variables are defined in Appendix 1.
Conclusion
This study examines the impact of business strategy on tournament incentives for a sample of Chinese listed firms from 2011 to 2017. We argue that firms following innovative strategies are more likely to enlarge their tournament size. We find evidence consistent with this hypothesis. Furthermore, we find that the positive relation between business strategy and tournament incentives is confined to non-SOEs and local SOEs. The results also suggest that qualified foreign institutional owners affect the relationship between business strategy and tournament incentives.
Our study contributes to existing literature in several important aspects. First, we extend the scant literature on the determinants of tournament incentives by exploring the role of firm-level business strategy. Although a plethora of research has examined the consequences of tournament incentives, little attention has been paid to answering the fundamental question as to why tournament incentives exist. We examine business strategy, a hitherto unexplored determinant of tournament incentives. Second, our research also extends the business strategy and executive compensation literature. Although previous studies document that business strategies affect CEO compensation, whether business strategy has any influence over tournament incentives has remained unanswered. Our study, thus, sheds new light on debates surrounding optimum compensation plans for firms. Third, extensive tournament-based studies have been conducted in the developed countries (mainly in the United States). Our study makes an incremental contribution to the existing tournament literature by providing new evidence on the importance of business strategies in determining cash-based tournament incentives in an emerging market, China. Fourth, our research enriches the business strategy–tournament incentives relationship by documenting the important role that institutional differences, including ownership structure and the cash-based compensation environment play.
The findings on state ownership have important policy implications. Over the past two decades, top executives in the listed SOEs have been criticized for receiving very generous pay packages despite the poor performance of their firms (H. Zhang et al., 2018). To mitigate this concern, the state-owned Assets Supervision and Administration Commission (SASAC) launched a “pay cap” policy. The aim of this policy is to narrow the compensation differences between the average compensation of executives and the average salary of the employees of SOEs from a ratio of 12:1 to a ratio of 7:1 or 8:1 (State Council, 2014). However, the evidence of this study suggests that pay disparity for prospector-type local SOEs is sensitive to business strategies. SOEs that focus on seeking new markets and diversifying products have to offer relatively higher compensation to their executives, preferably through well-designed tournament schemes. Therefore, the “Pay Cap” policy may be more appropriate for central SOEs, and defender-type local SOEs that face fewer uncertainties and lower risks.
One of the limitations of this study is our use of cash compensation alone to measure tournament incentives. Ideally, tournament incentives should be measured using both cash and equity compensation. However, equity-based compensation schemes are still in their infancy in China. The Securities Regulatory Commission issued the act “Measures for Equity Incentive Administration of Listed Companies” in 2005. However, the evidence suggests that many companies are yet to adopt the equity-based incentive plans (Hass et al., 2016), although recent evidence suggests that equity-based compensation arrangements are gaining traction, as evidenced in academic publications (Hass et al., 2016; B. Liu et al., 2019; D. L. Zhang et al., 2020). Therefore, new insights can be gained in the tournament incentive literature in China if future studies could take the equity incentives into consideration.
Footnotes
Appendix
Variable definitions.
| LnGAP | Natural logarithm of the pay gap calculated as mean of top three executives’ compensation minus mean of the rest of the executives’ compensation |
| LnVPSTD | Natural logarithm of the standard deviation of the pay differentials between the total compensation of top executives and the CEO. LnVPSTD is the natural logarithm of the standard deviation of the VPs’ compensation, excluding the CEO’s compensation, which represents the pay difference between individual VPs |
| STRATEGY | Discrete score with values ranging from 6 to 30 where high (low) values indicate prospector (defender) firms, respectively. Business strategy composite score is constructed by using the following six firm-level characteristics: (1) the ratio of research and development (R&D) expense to total sales (a measure of a firm’s tendency to develop new products); (2) the ratio of employees to sales (a measure of firm’s capacity to produce and distribute its goods and services efficiently); (3) a measure of employee fluctuations (standard deviation of total number of employees); (4) the 1-year sales growth rate (a measure of firm’s historical sales growth); (5) the ratio of selling, general, and administrative (SG & A) expenses to sales (a measure of firms’ effort on marketing and sales); and (6) capital intensity using net property, plant, and equipment (PPE) divided by total assets (a measure a firms’ focus on production) |
| PROSPECT
DEFEND |
A dummy variable coded 1 if the strategy score is between 24 and 30 (both inclusive), and 0 otherwise. A dummy variable coded 1 if the strategy score is between 6 and 12 (both inclusive), and 0 otherwise |
| DEFEND | A dummy variable coded 1 if the strategy score is between 6 and 12 (both inclusive), and 0 otherwise |
| ANALYZE | Remaining observations (i.e., observations with a STRATEGY score ranging from 13 to 23 (both inclusive) |
| SIZE | The natural logarithm of the total assets |
| LEV | Total debts divided by total assets |
| MTB | The market-to-book ratio of firm i in year t, calculated as market value of equity/book value of equity |
| SGROW | Sales growth measured as (Sales t −Salest−1/Salest−1) |
| ROE | Net income divided by shareholders’ equity |
| DUAL | Firm’s chief executive officer (CEO) duality, which equals one if the CEO also holds the position of the chair of the board, and zero otherwise |
| AGE | CEO’s age |
| CEOHOLD | The natural logarithm of number of shares owned by the CEO within the firm |
| TENURE | The natural logarithm of the number of months that the CEO has been with the firm |
| CEOBRD | An indicator variable that equals one if the CEO sits on the corporate board, and zero otherwise |
| BSIZE | Natural logarithm of the number of directors on the board |
| BIND | Independence of the board, which is measured as the ratio of the number of independent directors over the total number of directors on the board |
| MOWN | The percentage of outstanding shares owned by a firm’s executive |
| LnGDP | Natural logarithm of regional GDP (in 0.1 billion CNY) |
| SOE | An indicator variable that equals one if the firm is a state-owned enterprise (SOE), and zero otherwise |
| SOE_Central | An indicator variable that equals one if the firm is a centrally controlled state-owned firm, and zero if the firm is controlled by local government |
| QFII | An indicator variable that equals one if the firm has shares owned by any qualified foreign institutional investors (QFII), and zero otherwise |
Acknowledgements
We appreciate helpful comments from the Associate Editor, Claudio Giachetti, and the two anonymous reviewers.
Declaration of conflicting interests
The author(s) declared no potential conflicts of interest with respect to the research, authorship, and/or publication of this article.
Funding
The author(s) received no financial support for the research, authorship, and/or publication of this article.