
Abstract
There is a debate in academia and the business world on whether tax payments should be considered part of firms’ social responsibility. Existing literature provides conflicting evidence on the relationship between corporate tax payments and corporate social responsibility (CSR). Borrowing a concept from a behavioral theory of the firm (BTOF), this study attempts to present a more refined model on the relationship between the two. The results in this study reveal that as firms’ performance rises further above their aspiration level, they are less likely to show better CSR performances and are also less likely to avoid taxes. Firms performing just above their aspiration level show higher CSR performances and firms performing nearby (both below and above) their aspiration level avoid more taxes. In conclusion, firms’ CSR and tax payment decisions are related to the desire to meet or beat an aspiration level or sustain competitive advantage than being ethical or unethical.
Keywords
Introduction
There is a wide debate in academia and among stakeholders of businesses on whether corporate social responsibility (CSR) activities and corporate tax payments are complements or substitutes. Though limited, existing empirical research provides competing evidence on the relation between CSR and tax avoidance. For example, while Hoi et al. (2013) find no relation between CSR strengths and tax avoidance but a positive relationship between CSR weaknesses and tax avoidance supporting the notion that CSR activities complement tax payments, Davis et al. (2016) find a positive relationship between overall CSR performance and tax avoidance and argued that tax payments and CSR activities are substitutes. While the former evidence supports the notion that tax payments are part of firms’ socially responsible activity, the latter supports the view that paying taxes detracts social welfare by hampering innovation, investment, job growth, and economic development. Part of existing literature also views CSR activities as mechanisms of tempering firms’ reputational loss from fraud or other illegal activities such as excessive tax avoidances (Prior et al., 2008). Studies proposing no relationship between CSR and tax avoidance are not rare (Dhaliwal et al., 2012). This study is an attempt to refine the relationship between these two constructs and the related opposing views. Subsequently, the study plays a novel role in investigating how prior performance relative to the aspiration level is related to firms’ CSR and tax avoidance behavior borrowing a concept from a behavioral theory of the firm (BTOF)—first proposed by Cyert and March (1963).
This study proposes that firms’ alignment to either CSR or tax avoidance may depend on their prior performance relative to their aspiration level. Using a sample of Standard &Poor’s (S&P) 1500 firms for the period covering 2007 through 2016, the study provides pieces of evidence with significant contributions and implications for the BTOF, tax avoidance, and CSR literature. First, the findings on the relationship between relative performance and CSR are consistent with BTOF. Firms’ behavior toward CSR is affected by their prior relative performance. Motivated by the desire to improve subsequent performance and reclaim the status quo, firms performing below aspiration levels are more likely to show better CSR performance. On the contrary, firms performing above the aspiration level show lower CSR performance since their motivation for “problemistic search” declines as they are satisfied with the existing routines or as they have already consumed their resources to the maximum. Assuming CSR activities are considered to have a long-term benefit to a firm, there is no evidence showing that firms with superior financial performance are more motivated to engage in such activities. This finding contributes to the existing CSR literature by conveying relative performance as one more factor determining CSR behavior. While prior studies show the relationship between relative performance and strategic business activities such as innovation (Greve, 2003b), acquisitions (Iyer & Miller, 2008), research and development (Rudy & Johnson, 2013), new market penetration (Ref & Shapira, 2016), and radical invention (Eggers & Kaul, 2018), this study is the first to directly test its relationship with CSR. This sheds light on the finding of Lys et al. (2015) who document the signaling effect of CSR on the future financial performance of the firm. The results in this study revealed that higher CSR performances are related to firms’ desire and motivation to achieve better financial performance. The results, however, are contrary to prior studies linking higher financial performance with more corporate strategic activities (Xu et al., 2019) and higher CSR performance with financial reporting quality or ethical behavior (Kim et al., 2012). Firms performing far above the aspiration level are less likely to show a better CSR performance in the subsequent period while they are also less likely to manipulate their financial reports.
Second, this study is the first to show a significant and convincing relationship between relative performance and tax avoidance. There is an inverted “U”-shaped relationship. While Xu et al. (2019) propose more deviant activities for firms performing far below their aspiration, this study finds lower tax avoidances for such firms. As it could lead to scrutiny from regulators and taxing authorities (Chyz & Gaertner, 2018), poorly performing firms may consider tax avoidance a risky activity triggering their survival. Contrary to Rego (2003) and Chen et al. (2010), results in this study present lower tax avoidance for firms with extremely high financial performances. Firms performing far above the aspiration level may not be motivated to take risks as they are already satisfied with their current status (Kim et al., 2015). However, findings in this study show higher tax avoidances for firms performing near, both above and below, their aspiration level. The results can be interpreted in two ways based on two contrasting types of risk-taking behaviors: deviant and aspirational (Xu et al, 2019). Firms performing below the aspiration level, but near the aspiration level, may take deviant risk motivated by their myopic desire to meet or beat the aspiration level within a short time. Whereas firms performing at or above, but near, the aspiration level may take aspirational risk motivated by their desire to sustain their competitive advantage and fulfill their long-term objectives using legal tax-planning techniques. These results might also have important practical implications for regulatory bodies and taxing authorities concerned about understanding firms’ tax behavior. Firms performing below and above, but near, the aspiration level might avoid more taxes than others.
The third and the main contribution of this study is refining the relationship between CSR and tax avoidance. Although firms performing below aspiration are more likely to show better CSR performance than above-aspiration performers, the results in this study do not provide evidence that higher CSR performance is related to higher tax avoidance for firms performing below the aspiration level. The results for the full sample show a slight significant positive relationship between CSR performance and tax avoidance which disappears when relative performance is included in the model. Hence, the relationship between CSR and tax avoidance is attributed to firms’ performance relative to the aspiration level. When the sample is divided into two groups, the relationship turns negative for firms performing below their aspiration level. This negative relationship shows that lower CSR performance is related to more tax avoidance consistent with the substitute hypothesis (Davis et al., 2016). For firms meeting or beating their aspiration level, the slight positive relationship persists consistent with the complement hypothesis (Hoi et al., 2013). Therefore, the relationship between CSR and tax avoidance depends on firms’ relative performance and the related type of risk they are likely to take. Firms performing below (but near) their aspiration level are likely to take a deviant risk and, therefore, engage in short-term myopic activities such as tax avoidance than long-term competitive activities such as CSR. On the contrary, firms performing above (but near) their aspiration level are likely to take an aspirational risk and engage in both CSR and tax-planning activities. Firms performing far below their aspiration level are likely to invest in CSR to reclaim status quo and reputation but unlikely to engage in tax avoidance as they may be struggling to survive. Firms performing far above their aspiration level are unlikely to engage in both as they are already satisfied with their current status and lack the motivation to take risks. Therefore, corporate tax payments are more likely related to firms’ desire to improve short-term financial performance and meet aspiration level or to save costs and sustain long-term competitive advantage rather than firms’ socially responsible or irresponsible behavior.
The remainder of the article is structured as follows: The section “Literature review and hypotheses development” presents the literature review and the hypotheses. The section “Research design” describes the research designs. The section “Results and discussion” presents the main results and discusses the results and their implications. The section “Conclusion” concludes the article, presents limitations, and provides directions for future research.
Literature review and hypotheses development
A BTOF
The BTOF brought its foundation from a book by Cyert and March (1963) titled “a behavioral theory of the firm.” Since then, the book has remarkably been the “most influential management book” and became a foundation for a broad range of organizational studies (Argote & Greve, 2007). BTOF emphasizes the organizational decision-making process and how performance feedback may affect decision-making and organizational change. It states that since firms have more than one stakeholder, they have no specific goal. Their goal is to solve the constraints they face in the business process. Mainly, firms measure their performance, create aspiration levels based on their own past performance or that of their competitors, make a comparison between their actual performance and the aspiration, and decide to make changes if the performance is lower than the aspiration level (Greve, 2003a). By providing a simple and discrete measure of failure or success, the aspiration level serves as a reference point in evaluating firms’ performance (Xu et al., 2019). While performance below the aspiration level is a sign of failure, performance above the aspiration level indicates success.
Greve (2003c) listed five guiding steps in BTOF, which firms may follow in making decisions for a change. The first step is evaluating performance by comparing it with benchmarks (also called targets, goals, or aspirations). In evaluating performance and defining success or failure, firms look for deviations from benchmarks (their own historical performance or performance of their competitors), rather than actual values. They evaluate their performance as a “positive or negative deviation” from historical or social aspiration levels (Ref & Shapira, 2016). After making a comparison, if they found themselves performing below the aspiration levels, firms go to the second step (i.e., “problemistic search”). However, when performance exceeds aspiration, the motivation for “problemistic search” goes down, and, therefore, organizational change is less probable. “Problemistic search” is a search for solutions initiated when an organization performs poorly relative to its aspiration. “Problemistic search” has the potential to change any behavior and bring specific action depending on the history of the firm and its competitive environment (Greve, 2003a).
The third step is looking for the availability of slack resources. There are three types of slack (absorbed slack, unabsorbed slack, and potential slack) widely identified in prior studies (Ref & Shapira, 2016) representing excess costs in organizations, uncommitted liquid resources, and firms’ borrowing ability. The availability of extra resources facilitate change and increase the probability of searching for and using new opportunities, and risk-taking (Iyer & Miller, 2008). Therefore, firms performing below aspiration are more likely to bring change if they have surplus slack resources. Available high slack itself may be more likely to bring organizational change although prior empirical research shows its weak effect (Bromiley, 1991; Greve, 2003a). In the fourth step, the evaluation of alternative solutions generated by “problemistic” and slack search is made based on their riskiness and aptness to the organizational strategy. Relative performance is an important factor in determining the level of risk that firms are willing to accept. While performance below the aspiration level increases risk tolerance, performance above the aspiration level decreases risk tolerance (Greve, 2003a). The sensitivity of shareholders to consistent improvements in firm earnings and performance-linked management incentive packages push firms toward short-term solutions in the face of underperformance (Yu et al., 2018), but successful organizations get satisfied with their existing performance and are not motivated to search for ways to improve. The last step is making a decision based on the available problems, solutions, and the decision-maker’s risk tolerance. The section below discusses some of the empirical findings supporting this theory.
Prior empirical evidence on BTOF
According to the BTOF, managers look toward targets to make their decisions, such as a firm’s performance compared to its historical (past) or peer (industry) performance rather than using actual values (Greve, 2003b). Past or peer performance goals or targets are termed aspirations and attainment discrepancies refer to the differences between the actual performances and aspirations. When performance falls below aspiration, firms are willing to search for actions that help them improve firm performance including activities that otherwise are considered risky. Such firms feel outcompeted by their competitors and incompetent to achieve their own expectations and, therefore, strive more to reverse the poor-performance and reclaim the status quo (Eggers & Kaul, 2018). Therefore, the lower the performance (relative to the aspiration level), the more the managers’ risk-taking and motivation for change driven by the search for ways to improve performance (Lehman & Hahn, 2013). This notion has got wide empirical support. Bromiley (1991) finds a negative relationship between firm performance and risk-taking measured by the variance in security analysts’ earnings forecasts. Several other studies find a positive relationship between performance below aspiration and risk-taking or organizational change–related activities such as production changes (Greve, 1998), innovation (Greve, 2003b), expansion (Audia & Greve, 2006), new product development (Audia & Brion, 2007), acquisitions (Iyer & Miller, 2008), research and development, corporate lobbying (Rudy & Johnson, 2013), new market penetration (Ref & Shapira, 2016), radical invention (Eggers & Kaul, 2018), and bribery (Xu et al., 2019).
However, when performance gets far above aspiration, the inspiration for “problemistic search” declines and, therefore, so does the probability of doing new activities (Kim et al., 2015). Empirical evidence shows that when a firm’s performance rises above the aspiration level, there is a decrease in the probability of organizational change (Audia et al., 2000), risk-taking (Wiseman & Bromiley, 1996), and research and development (R&D) search intensity (Greve, 2003c). Ref and Shapira (2016) explain three reasons for this decline in firms’ motivation for “problemistic search.” First, as performance above aspiration “indicates a satisfactory match between a firm’s resources and the markets in which it operates, redeploying resources into something new may be less rewarding.” Second, extremely high performance over aspiration may indicate a higher utilization of existing resources. Such firms may remain with limited excess resources and the willingness to use these surplus resources on something new declines. Third, as performance surpasses aspiration level, firms’ determination of searching for new things goes down as they are comfortable with the existing business. Therefore, as performance exceeds aspiration level, firms’ may be less willing to spend additional resources, time, and attention for making changes to the prevailing routines. Past success increases managers’ satisfaction and leads to a belief that the current course of action requires no change (Audia et al., 2000).
Hypotheses development
Relative performance and CSR
The BTOF predicts an increase in firms’ risk-taking and organizational change following a decline in performance below the aspiration level. The accounting literature also documents managers’ sensitivity and defensive behavior to a performance decline because of its expensive and damaging consequences to the firm (Burgstahler & Dichev, 1997). Burgstahler & Dichev provide two general reasons why firms avoid reporting decreases in earnings. First, firms reporting performance decrease may incur additional transaction costs in subsequent periods because of the uncertainty that the decline creates on the firms’ stakeholders. For example, banks may be less willing to lend to such firms and, therefore, may place additional covenant requirements or charge higher interest. Second, decreases (losses) are more value relevant than increases (gains) in the stock market and, therefore, a small decrease in earnings is more likely to seriously cut firm value downward leading to shareholders’ disappointment. Furthermore, most firms pay incentives to managers based on the firms’ short-term financial performance (Yu et al., 2018). Therefore, firms facing performance shortfalls are more likely to aggressively react and take measures to reverse the problem in the subsequent period.
Firms performing below aspiration could invest in CSR and use it as a mechanism to reduce the costs related to their prior poor performance by regaining their reputation and image and also by increasing employee commitment. Prior studies show that CSR may have various value-enhancing benefits such as increasing customer loyalty (Pirsch et al., 2006), improving corporate reputation and image (Coldwell et al., 2007), increasing employee retention and commitment (Turker, 2008), enhancing brand performance (Lai et al., 2010), intensifying innovation (Wagner, 2010), improving productivity (Sun & Stuebs, 2012), and shaping irregular employees attitude (Ali & Jung, 2017). However, although performance below the aspiration level increases the tendency to search for solutions and bring changes, it may not be the case that firms consider CSR as their best solution. As firms might have multiple solutions available (Greve, 2003c), it is not clear whether CSR could be one of the most reasonable possible alternate solutions. One of the reasons is there is no convincing and conclusive evidence on whether CSR leads to better financial performance and, hence, managers doubt its contribution in this aspect (Lu et al., 2014; Zhao & Murrell, 2016). Second, while CSR could have a long-term benefit, low-performing firms might be interested in finding short-term solutions to their immediate problems. Firms performing below the aspiration level require drastic actions that can restore their standing and help them reach their aspiration level soon (Xu et al., 2019). Third, recent developments in BTOF show that firms performing far below the aspiration levels are likely to face increasing resource constraints (Kuusela et al., 2017; Ref & Shapira, 2016) and, therefore, may not be interested in resource-consuming investments such as CSR. Moreover, when performance gets too low that the firm is likely to fail, the focus of attention will be survival than meeting aspiration levels or investing in social and environmental activities (Audia & Greve, 2006).
Firms performing above the aspiration level have no strong motivation to solve immediate problems as there is no strain. As performance relative to the aspiration level increases, firms’ propensity to organizational change decreases (Greve, 1998; Kim et al., 2015). Managers of such firms wisely evaluate the impact of their actions on the firm’s future in both financial and social terms (Xu et al., 2019). Therefore, these firms are expected to be less motivated to spend additional money and energy on CSR or any other resource-consuming activities. However, they might also be concerned about sustaining their competitive advantage in the long run and willing to take some aspirational risk motivated by the excessive slack resources they have (Xu et al., 2019). Higher performance translates into more accumulated resources and these excessive resources might create the motivation to invest in CSR or other future-oriented activities.
In conclusion, performance below aspiration is less likely to be related to higher CSR engagement, and performance at or above aspiration level is more likely to increase CSR-related activities. Therefore, the first hypothesis is stated as:
Relative performance and tax avoidance
Aspiration level is often described as the smallest performance outcome that would be deemed satisfactory by the manager of a firm. When performance falls below aspiration, firms are willing to engage in activities that are considered risky. Such firms feel outcompeted by their competitors and incompetent to achieve their expectations and, therefore, strive more to reverse the poor performance and also reclaim the status quo (Eggers & Kaul, 2018). However, when performance exceeds aspirations, firms are likely to believe that their existing way of doing business is sufficient enough and there is no or little incentive to change what appears to be satisfactory and, hence, the probability of making risky decisions declines (Kim et al., 2015). Therefore, the less the performance (compared to the aspiration level), the more the managers’ risk-taking driven by the search for ways to improve performance, but this negative relationship gets weaker for performance above aspirations (Lehman & Hahn, 2013). A body of empirical research has supported the positive relationship between failure to meet aspirations and the acceptance of higher risk where risk is mostly measured as variance in analyst forecasts (Bromiley, 1991) variance in return on assets (ROA; Palmer & Wiseman, 1999), or change in R&D intensity (Miller & Bromiley, 1990). Firms with performance declines below the aspiration level are also found to subsequently increase their lobbying activities (Rudy & Johnson, 2013) and bribery expenditures (Xu et al., 2019) in an attempt to improve economic performance by engaging in political and corrupt actions.
A significant body of literature documents evidence consistent with the idea that tax avoidance is related to more risk and managers’ risk preferences. For example, Rego and Wilson (2012) find a negative relationship between the CEO’s risk-taking incentives and the level of the firm’s tax avoidance measured by cash effective tax rate. Badertscher et al. (2009) and Chen et al. (2010) find that managerial and family ownership types are related to higher tax rates consistent with the idea that managers of such firms lower expected tax rates because they would bear a greater proportion of the risks of such strategies. In addition, there are also research findings that suggest that banks, the stock markets, and regulatory bodies perceive tax avoidance as a risky activity. Hasan et al. (2014) document evidence showing the existence of a positive relationship between tax avoidance and bank-borrowing spreads. Tax-avoiding firms are also found to incur more strict collateral and covenant requirements in bank loan contracting, face higher yield spreads when issuing public bonds, and therefore, prefer bank loans over public bonds (Hasan et al., 2014). Kim et al. (2014) present evidence that tax avoidance is associated with more negative skewness in stock returns and increased stock price crash risk. Chyz and Gaertner (2018) also document a finding that tax avoidance could potentially increase reputational costs and could lead to scrutiny from regulators and taxing authorities and a forced CEO turnover. Using additions to unrecognized tax benefit (UTB) as a measure of uncertainty, Dyreng et al. (2019) find that “firms with relatively low cash effective tax rates, bear significantly greater tax uncertainty than firms that have higher cash effective tax rates.” Furthermore, evidence from the study by Frank et al. (2009) suggests that firms that aggressively manage earnings also aggressively manage taxes and, therefore, have less-transparent financial reports. Harris and Bromiley (2007) mentioned that falsifying financial reports constitutes a risky action and provided evidence that performances below aspirations increase the likelihood of earnings management measured by restatements. Based on BTOF, it can be argued that though tax avoidance is a risky activity, managers of firms with performance shortfalls are more likely to use it because it could bring a significant improvement to the firm’s after-tax net income with less effort. Studies also suggest that, as firms’ performance gets far below aspirations, they are likely to prefer resource-freezing or cheaper activities such as divestment and tax avoidance than highly resource-consuming investments such as acquisitions and research and developments (Kuusela et al., 2017). Therefore, one would expect firms performing below aspirations to have higher tax avoidance levels (low tax rates) compared to those performing above aspirations.
However, there is scant literature providing evidence indicating no relationship between tax avoidance and firm risk (Dyreng et al., 2019; Guenther et al., 2019; Guenther et al., 2017; Hutchens et al., 2019). A study by Guenther et al. (2017) attempted to verify whether tax avoidance is associated with greater firm risk and find that higher tax avoidance levels are more persistent than low levels of tax avoidance. This finding is consistent with the idea that higher tax avoidance reflects the extent to which firms systematically take the advantage of tax-favored legal transactions, as opposed to the managers’ incentives to reduce the firm’s tax payments through risky tax strategies. Guenther et al. (2019) find evidence suggesting no relationship between higher tax avoidance and more uncertainty. Hutchens et al. (2019) examine the association between tax avoidance and risk using latent class mixture models and find that only 19% of their sample exhibits a positive association between tax avoidance and firm risk. There are also prior studies with pieces of evidence that show that earnings management (accounting fraud) is negatively related to aggressive tax avoidance. Two other studies (Erickson et al., 2004; Lennox et al., 2013) provide evidence that firms overpay taxes intending to cover their intentionally inflated earnings and accounting fraud decreases with an increase in tax avoidance. It is possible that firms may inflate their book income and intentionally make no effort to reduce the taxes on such bogus performances. If the firms which engage in accounting fraud pay more taxes (and if higher tax avoidances are related to a systematical way of taking the advantages related to tax-favored transactions), one would expect firms performing below aspirations to show higher earnings management but lower tax avoidances. Furthermore, it is also argued by prior studies that better-performing firms have more incentive to avoid taxes as they are less likely to face government scrutiny, can save more money from cutting taxes, and have greater resources to invest on tax planning (Chen et al., 2010; Rego, 2003). Therefore, it is not clear if there is a relationship between relative performance and tax avoidance.
CSR and tax avoidance
Though limited, existing research find competing evidence on the relation between CSR and tax avoidance. For example, while Hoi et al. (2013) find no relation between CSR strengths and tax avoidance, Davis et al. (2016) find a positive relationship. Davis et al. (2016) discuss three views on the relationship between these two constructs. The first group of researchers view tax payments as part of firms’ CSR activities and, therefore, predict a negative relationship between CSR and tax avoidance. According to this view, CSR and tax payments are substitutes. Paying taxes is considered as one of the socially responsible acts of business organizations (Christensen & Murphy, 2004). The second group views “paying taxes as detracting from social welfare” with a positive relationship between CSR and tax avoidance expected. According to this view, CSR and tax payments are complements. Tax payments may have adverse effects on innovation, investment, job growth, and economic development (Djankov et al., 2008). It is also argued that “for-profit corporations are more efficient than governments in allocating resources” (McGee, 2010). Hence, paying taxes may create inefficient resource utilization by transferring funds from business organizations to the government. The last group predicts no relationship between the two. According to this view, “firms should engage in socially responsible activities only when such activities maximize shareholder wealth” and, therefore, the decisions to engage in tax avoidance and/or CSR activities are independent of each other and are unrelated (Dhaliwal et al., 2012).
Based on the discussions made above, it is not possible to predict the relationship between CSR and tax avoidance. However, the direction of the relationship is not expected to be the same for the two groups as low- and high-performing firms differ widely in their motivations and capacities and are expected to exhibit different strategies and behaviors (Chen, 1996; Xu et al., 2019). Recent BTOF research also shows that below-aspiration and above-aspiration performers are likely to take opposing strategic actions (Kuusela et al., 2017). Therefore, it can be stated that the relationship between CSR and tax avoidance may not be the same between firms performing below the aspiration level and at or above the aspiration level. By classifying firms into two groups, firms that report a performance below their aspiration level and those which met or beat their aspiration level in the prior year, this study attempts to understand the direction of the relationship between CSR and tax avoidance.
Firms performing below the aspiration level may be interested to invest in CSR if they think CSR can help them boost short-term performance by increasing employee commitment and creating reputation (Coldwell et al., 2007; Turker, 2008). However, if the firms are not convinced with the financial benefits of CSR as documented in prior studies, it is also possible that such firms decide to reduce their CSR expenditures and focus on activities with immediate solutions (Rudy & Johnson, 2013; Xu et al., 2019). Given these two scenarios, it is still not clear whether firms consider tax payment as an integral part of CSR. If tax payments are considered an integral part of CSR supporting the “supplement” hypothesis, it is possible that we will find a negative relationship between CSR and tax avoidance in both scenarios. A negative relationship supports the “complement” hypothesis and absence of a relationship indicates that CSR and tax payment decisions are unrelated. However, based on the BTOF, it can be plausible to expect a negative relationship between CSR and tax avoidance for firms performing below their aspiration level. Such firms are likely to have resource constraints and are less likely to invest on resource-consuming investments (Kuusela et al., 2017) such as CSR. On the contrary, the firms are more likely to take a deviant risk and, therefore, engage in short-term myopic and cheaper activities (Xu et al., 2019) such as tax avoidance. Therefore, the third hypothesis is stated as:
As they are already satisfied with their existing performance, the need for “problemistic search” deriving from myopic behavior will no more exist for firms performing at or above the aspiration level (Greve, 1998; Kim et al., 2015; Xu et al., 2019). However, such firms are more likely to invest on CSR because of at least two reasons. First, higher financial performances are related to excessive slack resource availability (Kim et al., 2015). Therefore, these firms could be able to invest in strategic activities such as CSR. Second, the long-term value-enhancing benefits of CSR are widely recognized recently, and firms would be more likely to use their scarce resources to invest on CSR. Studies show that CSR could help firms by increasing customer loyalty (Pirsch et al., 2006), improving corporate reputation and image (Coldwell et al., 2007), increasing employee retention and commitment (Turker, 2008), enhancing brand performance (Lai et al., 2010), intensifying innovation (Wagner, 2010), improving productivity (Sun & Stuebs, 2012), and shaping irregular employees’ attitude (Ali & Jung, 2017). However, these firms may not be showing higher tax avoidance as they are less likely to engage in short-term myopic activities hindering their reputation and competitive advantage (Xu et al., 2019). On the contrary, prior research documents more tax avoidance for firms with higher financial performance. Such firms have more incentive to avoid taxes. They bear less risk of scrutiny from the government as they are already paying huge taxes, can save more money from cutting taxes, and have greater resources to engage in tax planning (Chen et al., 2010; Rego, 2003). Therefore, the last hypothesis predicts no relationship between CSR and tax avoidance for firms performing above the aspiration level.
Research design
Data and sample
The dataset used in this study contains S&P 1500 companies’ CSR data obtained from Thomson Reuters and financial statements data obtained from Compustat. While there are several data sources suggested for measuring CSR performance, Thomson Reuters is among the most reliable CSR data providers supported by its giant specially trained research team (Cheng et al., 2014; Luo et al., 2014). Because of the limited availability of CSR data (Thomson Reuters environmental, social, and governance (ESG) score) for the prior years, the original data ranged from 2006 to 2017 with 6,664 firm-year observations. Firms with at least 3 years ESG data on Thomson Reuters are included. In calculating median industry performance, the minimum number of firms in an industry is limited to at least five, and observations related to industry groups with a negative median performance (ROA) during the periods t−1 and t−2 are also excluded. Therefore, the performance of a firm is compared to at least five competing firms in deciding whether the firm has met an aspiration level or not consistent with Kuusela et al. (2017) and other prior studies. It is less likely that firms could aspire to negative performances or losses. Consistent with prior studies, financial institutions, utility firms, and firm-years with any missing data are excluded. Financial institutions and utility firms have inherent differences in regulatory and institutional structures related to tax (Kubick et al., 2015). The final sample size totals unbalanced panel data of 2,997 firm-years ranging between 2007 to 2016. All continuous variables are winsorized between 1% and 99% levels to eliminate the influence of outliers.
Variables measurement
Tax avoidance
Since this study is aimed at measuring how firms may behave in the year following a performance shortfall, cash effective tax rate (CASH_ETRit) is used to measure tax avoidance. CASH_ETR is cash taxes paid during the year divided by pre-tax book income less-special items (Hanlon & Heitzman, 2010). Consistent with prior studies, I restrict CASH_ETRit to fall in the interval between 0 and 1 and multiply it by −1. To corroborate the results, additional tax avoidance metrics such as long-term cash effective rate, effective tax rate, and book–tax differences are used.
Relative performance
There are different models for measuring performance and aspiration. While there are other likely performance metrics such as return on equity and profit margin, I use ROA as a financial performance metric in this study. ROA, the most used metric in BTOF research, can be calculated from financial reports easily, and is available for managers and shareholders in estimating management compensation and firm survival (Kuusela et al., 2017). As mentioned above, firms’ behavior is affected by the positive or negative deviation of their performance from a target (aspiration). The BTOF emphasizes two types of aspirations (comparison) named historical and social aspirations (Ref & Shapira, 2016). Historical aspiration is a comparison of current performance with a firm’s own recent past performance. Social aspiration compares the firm’s current performance with the performance of comparable other firms in the industry. Prior studies used these metrics either separately or by combining them into one metric (Bromiley & Harris, 2014). This study uses the aspiration metric, which combines both social and historical information to form a single aspiration level calculated using the switching model. Aspiration level equals industry performance for firms below industry performance, and slightly (5%) better than prior performance for firms above industry performance. This method increases parsimony while allowing both social and self-referents to influence aspiration level (Bromiley & Harris, 2014). Consistent with Bromiley (1991), if firm i’s ROAt−−2 is less than the industry median ROAt−2, aspiration level (ASPIREit−1) equals the industry median ROA at t−1. If the firm’s ROAt−2 is greater or equal to the industry median ROAt−2, the aspiration level (ASPIREit−1) equals 1.05 times the industry median ROA at t−1. This study uses a three-digit standard industry classification (SIC) code consistent with Kuusela et al. (2017) and other prior studies. Attainment discrepancy (ATT_DISCit−1) is the difference between ROAt−l and ASPIREt−1. Performance is below aspiration if the value of ATT_DISCit−1 is less than 0 and is above aspiration if the value is greater than 0.
CSR performance
Thomson Reuters Eikon ESG score consists of three pillars: environmental, social, and governance performance. There are 10 categories under the three pillars. Environmental performance includes the firm’s resources use or efficiency, carbon emission, and environmental innovation. Social performance includes workforce, human rights, community, and product responsibility. Management, shareholders, and CSR strategy are categorized under governance performance. For each firm, over 400 indicators are used to calculate the ESG scores. Each indicator or category is given a performance indicator score ranging from D− to A+. There are 12 scores a firm may get where D− shows the least performance and A+ the highest. The letters are changed into numbers ranging from 1 (for D−) to 12 (for A+) to calculate each firm’s CSR score in terms of the percentage performance compared to the maximum possible performance (i.e., 12). Therefore, the CSR performance metric (CSRit) is a fraction ranging from 0 to 1 based on the sum of the scores for the six ESG categories included under environmental and social pillars, where larger values indicate higher CSR performance and vice versa. Separate results for environmental performance (CSR_ENVit) and social performance (CSR_SOCit) are also presented. Consistent with prior studies (Kim et al., 2012; Luo et al., 2014), human rights and governance metrics are excluded in measuring CSR, and corporate governance is separately controlled in the analysis.
Control variables
Several control variables that prior research has found to be associated with such as CSR, tax avoidance, and relative performance are included. Firm size (SIZEit−1) is the log total assets of the firm at the beginning of the year. Prior studies show small and large firms responding differently to low performance (Audia & Greve, 2006) and large firms may have better resources and political sensitivity to plan and avoid more taxes (Kubick et al., 2015). I also include firms’ cash balance calculated using the indirect method (CASHit) and operating cash flows (CFOit), both deflated to beginning total assets. It is expected that the existence of excess cash flow (Jensen, 1986) may affect the decision to take risky decisions and, therefore, firms with excess cash reserves may be less likely to save cash using risky tax avoidance measures. In an attempt to control if taxes are affected by the manipulation of values reported in accounting income, current year accrual (ACCRit) is included. Accounting manipulations are also expected to be inversely related to better CSR performances (Kim et al., 2012). ACCRit is determined by deducting total operating cash flow from earnings before extraordinary items (Kothari et al., 2005). Firms’ tax and CSR decisions might also be affected by their current financial performance. Therefore, profit margin (PMit) calculated as net income deflated to sales and asset turnover (TURNit) calculated by deflating sales to total assets are included in the model consistent with Lys et al. (2015). These financial performance metrics are expected to be positively related to both CSR and tax avoidance. Prior studies also document relationships between CSR, audit quality, and tax avoidance (LópezPuertas-Lamy et al., 2017; McGuire et al., 2012). Therefore, a dummy variable BIG4it valued 1 if the firm was audited by one of the big four audit firms (0 otherwise) is included in the model. It is predicted that firms audited by the BIG4 get better audit service including tax planning and are likely to avoid more taxes.
Consistent with McGuire et al. (2014) and other studies, I control for firm growth opportunity, capital intensity, research and development activities, and corporate governance. Change in sales (ΔSALESit) is the difference between the current and prior years’ sales revenues deflated to beginning total assets. ΔSALESit is used to control for the firms’ growth opportunities. Fast-growing firms require more funds and are more likely to enjoy greater marginal benefits from tax saving, and hence may avoid more taxes (Edwards et al., 2016). PPEit is a proxy for capital intensity calculated by dividing net property, plant, and equipment by lagged total assets. R&Dit is research and development expenses divided by sales. Firms’ capital- and research-related resource requirements may affect their desire to use additional tax-planning and CSR activities. Three mainly used corporate governance indicators (i.e., board size, board independence, and CEO–Board chairmanship separation) are included. Board size (Board_Sit) is the number of firms’ board members. Board independence (BOARD_Iit) is the percentage of strictly independent board members in the board. CEO–Board chairmanship separation (CEO_Sit) is an indicator variable with a value of 1 if the CEO is not chairing the board, 0 otherwise. Studies show that better-governed firms show better CSR performance (Jo & Harjoto, 2011).
Following Iyer and Miller (2008) and Ref and Shapira (2016), distance from bankruptcy and availability of slack resources measured at t−1 are also controlled. Distance from bankruptcy (Z-SCOREit−1) measured using Altman’s (1983) Z-score is an indicator of how far a firm is from bankruptcy with a higher value indicating lower risk of bankruptcy and a lower score indicating a higher risk of bankruptcy. Altman’s Z-score is calculated as: ([1.2 × working capital divided by total assets] + [1.4 × retained earnings divided by total assets] + [3.3 × income before interest expense and taxes divided by total assets] + [.6 × market value of equity divided by total liability] + [1.0 × sales divided by total assets]). This study uses three metrics to capture organizational slack: absorbed slack, unabsorbed slack, and potential slack. Absorbed slack (SGAit−1) refers to excess costs in organizations measured as the ratio of selling, general, and administrative expenses to sales. Unabsorbed slack, denoted by the current ratio (CUR_RATIOit−1) calculated as current assets divided by current liabilities, refers to the firms’ uncommitted liquid resources. Potential slack is the inverse of leverage (LEVERit−1) measured as the ratio of total debt to total equity multiplied by −1, which captures firms borrowing ability. Larger SGAit−1, CUR_RATIOit−1, and LEVERit−1 values indicate higher slacks and vice versa. Firms that are far from bankruptcy and firms with more slacks are less likely to engage in risk-taking behaviors (Iyer & Miller, 2008) and it is expected that they are less vulnerable to tax avoidance. Two other recent studies (Edwards et al., 2016; Law & Lillian, 2015) also find that financially constrained firms are most likely to engage in more tax avoidance. Firm and year fixed effects are also included to control for cross-sectional and time-varying effects.
Empirical model
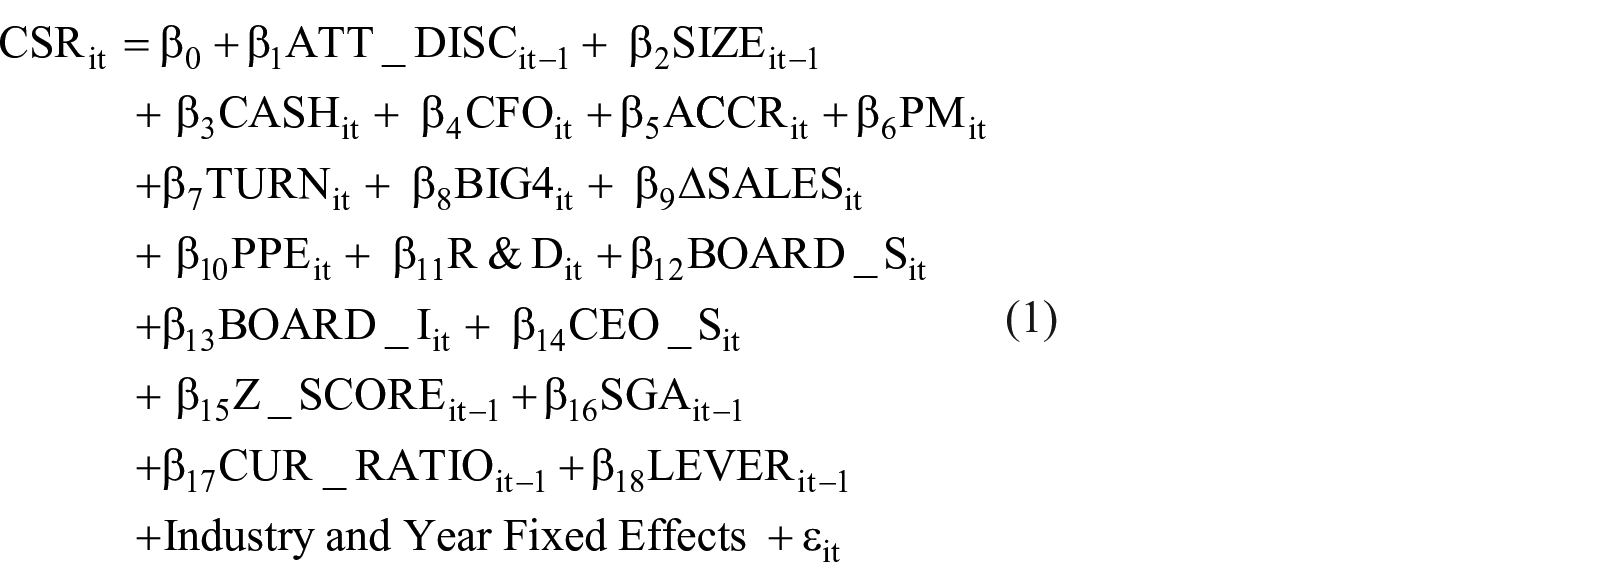
The hypotheses presented above are tested using the following GLM regression equations (equations (1) to (3)). All the variables used are operationally defined in the section “Variables measurement.” All the equations use an unbalanced panel regression model and control for year and industry effects. The control variables are only listed in the first equation for parsimony. The regression models control for the following variables: firm size (SIZEit−1), level of cash (CASHit), operating cash flow (CFOit), accruals (ACCRit), profit margin (PMit), asset turnover (TURNit), big four audit firms (BIG4it), sales growth (ΔSALESit), capital intensity (PPEit), research and development intensity (R&Dit), board size (BOARD_Sit), board independence (BOARD_Iit), CEO–Board chairmanship separation (CEO_Sit), distance from bankruptcy (Z-SCOREit−1), absorbed slack (SGAit−1), unabsorbed slack (CUR_Rit−1), and potential slack (LEVERit−1). All variables are defined and their predicted relationships are stated in the section “Variables measurement.”
The first hypothesis (H1) predicts a positive relationship between relative performance and CSR performance. The regression model presented below in equation (1) estimates H1. If this hypothesis is supported, a significant positive coefficient estimate on ATT_DISCit−1 is expected.
H2 predicts no relationships between relative performance (ATT_DISCit−1) and tax avoidance (CASH_ETRit). An estimate from the regression model in equation (2) is used to test H2. If the hypothesis is supported, a non-significant coefficient estimate on ATT_DISCit−1 in equation (2) is expected.

H3a predicts a negative relationship between CSR performance (CSRit) and tax avoidance (CASH_ETRit) among firms performing below the aspiration level. Whereas H3b predicts no relationship between the two variables for firms performing at or above their aspiration level. The following regression model is used to test H3a and H3b for separate sub-samples of firms performing below the aspiration level and meeting or beating the aspiration level. If the hypotheses are supported, coefficient estimates on CSRit in equation (3) is expected to have a significant negative sign for firms performing below aspiration and a non-significant sign for firms performing at or above their aspiration.

Results and discussion
Descriptive statistics
Table 1 presents the descriptive statistics of all variables of interest. Panel A shows the mean, standard deviation, lower quartile (LQ), and upper quartile (UQ) figures for the overall sample. Panels B and C show the same figures for the samples divided into those firms performing below their aspirations and those meeting or beating their aspiration levels in the prior year. Panel D presents t-test statistics for mean differences between firms performing below their aspiration level and those meeting or beating their aspiration level. From the total 2,997 sample firm-year observations, 40% (1,202) perform below their aspiration level, the remaining 60% (1,795) meet or beat their aspiration level. The mean level of tax avoidance measured using CASH_ETRit, is slightly larger for firms performing below aspirations than the other firms but this difference is not statistically significant (t-value = .79). Firms performing below aspiration also show slightly higher overall CSR performances on average (which is only significant at 10% alpha level). Mean values of control variables also indicate that firms performing below aspiration are larger in size, are more likely to be audited by the big four audit firms, and have larger and more independent boards. These firms also report lower liquidity, operating cash flows, profit margin, asset efficiency, research and development spending, and slacks, and are more likely to face bankruptcy than the other firms. However, there are no statistically significant differences observed between these two groups of firms in terms of financial reporting quality, growth potential, and capital intensity.
Descriptive statistics.

M: mean; SD: standard deviation; LQ: lower quartile; UQ: upper quartile.
Table 1 presents summary statistics (mean values, standard deviations, lower quartiles, upper quartiles, and t-values for mean differences) for the variables used in the empirical analyses. The sample is comprised of 2,997 unbalanced panel data of firm-years spanning the period 2007–2016. While Panel A presents summary statistics for the whole sample, Panels B and C show comparative summary statistics for the sample divided into firm-years performing below their aspiration (Panel B) and those meeting or beating their aspiration level (Panel C). Panel D presents t-values for mean differences between firms performing below their aspiration and those meeting or beating their aspiration level. All variables are defined in the section “Variables measurement.”
Indicate significant mean differences at .10 significance level.
Indicate significant mean differences at .05 significance level.
Indicate significant mean differences at .01 significance level.
Correlation analysis
Table 2 presents the Pearson correlation coefficients. Relative performance is negatively related to all the three CSR performance metrics at less than 5% significant level. These negative correlations may preliminarily (at univariate level) indicate that lower performance relative to an aspiration level is followed by higher CSR performance. Tax avoidance measured by CASH_ETRit is positively related to all the CSR metrics but only at a 10% significant level. The CSR metrics are also negatively related to firm size, accounting accruals, big four audit firms, and profit margin and are positively related to the level of cash, research and development spending, board size, board independence, and potential slack.
Pearson correlations.

Table 2 presents Pearson correlation coefficients for the variables used in the empirical analyses. The sample is comprised of 2,997 unbalanced panel data of firm-years spanning the period 2007–2016. Coefficients with significant correlations at less than 5% alpha level are shown in bold.
Indicate significant correlations at 10% alpha level. All variables are defined in the section “Variables measurement.”
CASH_ETRit shows positive associations with firm size, firm cash level, operating cash flow, profit margin, change in sales, research and development spending, board independence, and absorbed slack. While asset turnover and potential slack show a negative relationship with CASH_ETRit, the remaining controls fail to show significant relationships. Most of the control variables are related to each other with the largest coefficient being .57 between research and development spending and absorbed slack.
Multivariate (regression) analysis
The first hypothesis (H1) predicts a positive relationship between relative performance and subsequent CSR performance. Panel A, B, and C of Table 3 presents regression results where CSRit, CSR_ENVit, and CSR_SOCit are the dependent variables. As opposed to the prediction, the negative coefficient estimates on attainment discrepancy (ATT_DISCit−1) in Panels A, B, and C show an inverse relationship between relative performance and CSR with t-values of −3.76, −3.19, and −3.64, respectively. However, the results differ when the sample is divided into two groups. As presented in Panel D of the table, there is no significant relationship (t-value of −1.61) between attainment discrepancy and CSR performance for firms performing below the aspiration level. The negative coefficient estimate in Panel E, with a t-value of −3.72, indicates that higher performance far above the aspiration level is related to lower CSR performance. As the financial performance gets higher far above the aspiration level, firms are less likely to show better CSR performance in the subsequent period. Among the control variables, firm size, operating cash flow, accruals, big four audit firms, unabsorbed slack, absorbed slack, and potential slack are inversely related to CSR performance. While profit margin, asset turnover, research and development spending, board size, board independence, and distance from bankruptcy show a positive association with CSR performance, the remaining control variables are not statistically related to it.
Multivariate results: relative performance and CSR.

DV: dependent variable; CSR: corporate social responsibility.
Table 3 presents results for multiple regression where relative performance (ATT_DISCit−1) is the independent variable. The dependent CSR metrics are overall CSR score (CSRit) in Panels A, D, and E, and social performance (CSR_SOCit−1) and environmental performance (CSR_ENVit) in Panels B and C, respectively. Panels D and E present results for firm-years performing below their aspiration level and firm-years meeting or beating their aspiration level, respectively. The full sample is comprised of 2,997 unbalanced panel data of firm-years spanning the period 2007–2016. All p-values are two-tailed. All variables are defined in the section “Variables measurement.”
Indicate the regression coefficient estimate’s statistical significance (two-tailed) at .10 level.
Indicate the regression coefficient estimate’s statistical significance (two-tailed) at .05 level.
Indicate the regression coefficient estimate’s statistical significance (two-tailed) at .01 level.
Table 4 reports the results of multiple regression analyses of relative performance (ATT_DISCit−1) and tax avoidance (CASH_ETRit). While Panel A presents the results for the full sample, Panels B and C present results for firm-years performing below their aspiration and firm-years meeting or beating their aspiration level, respectively. The results for the full sample show a slightly negative significant relationship between relative performance and tax avoidance only at a 10% significance level (t-value of −1.90). However, results in Panel B present a positive relationship for firms performing below the aspiration level, with a t-value of 3.52, indicating higher tax avoidance exhibited by firms near the aspiration level than firms far below the aspiration level. All the ATT_DISCit−1 values for this group are numbers below zero and larger negative values (smaller numbers) show more deviations from the aspiration level. Therefore, the positive coefficient estimate for this group should be interpreted as a negative relationship between lower financial performance below the aspiration level and tax avoidance indicating higher tax avoidance for firms near the aspiration level compared to those far below the aspiration level. ATT_DISCit−1 values for firms performing at or above aspiration levels are all positive numbers and coefficient estimates in Panel C should be interpreted directly. For firms performing at and above the aspiration level (Panel C), there is a negative relationship between better financial performance above the aspiration level and tax avoidance (t-value of −4.13). Once again, firms near the aspiration level avoid more taxes.
Multivariate results: relative performance and tax avoidance.

DV: dependent variable.
Table 4 presents results for multiple regression where relative performance (ATT_DISCit−1) is the independent variable and tax avoidance (CASH_ETRit) is the dependent variable. Panel A presents results for the full sample, while Panels B and C presenting results for firm-years performing below their aspiration level and firm-years meeting or beating their aspiration level, respectively. The full sample is comprised of 2,997 unbalanced panel data of firm-years spanning the period 2007–2016. All p-values are two-tailed. All variables are defined in the section “Variables measurement.”
Indicate the regression coefficient estimate’s statistical significance (two-tailed) at .10 level.
Indicate the regression coefficient estimate’s statistical significance (two-tailed) at .05 level.
Indicate the regression coefficient estimate’s statistical significance (two-tailed) at .01 level.
Table 5 reports the results of multiple regression analyses of CSR performance (CSRit) and tax avoidance (CASH_ETRit). While Panels A and B present the results for the full sample, Panels C and D present results for firm-years performing below aspiration level and at or above the aspiration level, respectively. Relative performance (ATT_DISCit−1) is included in the regressions presented in Panel B. The results for the full sample in Panel A show a slight significant positive relationship between CSR performance and tax avoidance with a t-value equal to 1.69. However, when ATT_DISCit−1 is included in the model, the relationship turns to be insignificant with a t-value of .42. For firms performing below their aspiration level, the relationship between CSR and tax avoidance is a slight negative with a t-value equal to −1.82. But, for firms meeting or beating their aspiration level, there is a positive relationship (t-value = 2.02). Among the control variables showing a consistent relationship, the level of cash, profit margin, change in sales, research and development spending, and board independence are positively related to tax avoidance. Asset turnover, CEO–Board separation, and all types of slack are negatively related to tax avoidance. Accruals are positively related to tax avoidance for firms performing below aspiration but negatively related for firms meeting or beating aspiration. Firm size, operating cash flows, board size, and distance from bankruptcy do not show consistent relationships with tax avoidance.
Multivariate results: CSR and tax avoidance.

CSR: corporate social responsibility; DV: dependent variable.
Table 5 presents results for multiple regression where CSR performance (CSRit) is the independent variable and tax avoidance (CASH_ETRit
Indicate the regression coefficient estimate’s statistical significance (two-tailed) at .10 level.
Indicate the regression coefficient estimate’s statistical significance (two-tailed) at .05 level.
Indicate the regression coefficient estimate’s statistical significance (two-tailed) at .01 level.
Additional tests
I ran additional tests (untabulated) to determine the robustness of the results. First, consistent with Iyer and Miller (2008) and others, separate analyses for relative performance compared to historical aspiration and social aspiration levels are made. The results for both historical and social performance aspiration levels are consistent with the main results. Second, additional tax avoidance metrics such as long-term cash effective rate, effective tax rate, and book–tax differences are used. The results are consistent with the main result. Third, relative performance is measured using a return on equity and profit margin. Subsequent results from the regression analysis still show consistent results. Finally, Heckman’s (1979) two-stage estimation procedure is used to check and control for endogeneity bias. First, regressions for observing the positive outcome of the dependent variables in each of the equations used in this article are modeled. Then, estimated parameters are used to calculate the inverse Mills’ ratio, which is then included as an additional explanatory variable in the ordinary least squares (OLS) estimation. The results found this way did not show any significant differences from the tables presented in this article.
Discussion
The objective of this study was to investigates how performance discrepancies from the aspiration level may affect firms’ CSR and tax avoidance behaviors. Grounded by the BTOF, firms are classified into two expected behaviors toward risk-taking or organizational change based on their prior performance relative to their historical or/and social aspiration level. This study predicts these two groups of firms to behave differently in their CSR and tax avoidance activities because of their differences in motivations, capacities, and strategies (Chen, 1996; Kuusela et al., 2017; Xu et al., 2019). The findings from this study have theoretical and practical implications for academia and the business world.
First, the findings on the relationship between relative performance and CSR have important contributions to the BTOF and CSR literature. Firms’ behavior toward CSR activities is affected by their prior relative performance. Firms with a performance shortfall compared to their aspiration levels are more likely to show better CSR performance than other firms. However, there is no significant relationship between relative performance and CSR for the sub-sample of firms performing below their aspiration level while sub-sample firms performing at or above their aspiration level showing a negative relationship. These results present a partially consistent relationship with recent BTOF studies proposing an inverted “U”-shaped relationship between relative performance and organizational change or risk-taking activities. According to Ref and Shapira (2016), firms performing near the aspiration level, both below and above the aspiration level, are more likely to get motivated to take risks and bring changes. Firms performing far below the aspiration level may not be motivated because they are likely to face increasing resource constraints and concerned about survival than bringing changes (Kuusela et al., 2017; Ref & Shapira, 2016). Such firms could also have difficulties in generating additional funds into the firm as the cost of doing so gets higher with a decline in performance (Burgstahler & Dichev, 1997). Firms performing far above the aspiration level get satisfied with their current performance or are already utilizing their resources to the maximum and may be less motivated to bring changes or take risks (Ref & Shapira, 2016). The lack of difference in CSR performance among firms performing below the aspiration level reported in this study may be attributed to managers’ being not convinced with the short-term financial benefit of CSR as firms performing just below the aspiration level are concerned with solutions with immediate impact on financial performance (Rudy & Johnson, 2013). While Lys et al. (2015) document the signaling effect of CSR on the future financial performance of the firm, this study shows that CSR is related to firms’ desire and motivation to achieve better financial performance.
The above results are, however, contrary to a recent finding by Xu et al. (2019) who propose an increase in long-term strategic activities with an increase in performance far above the aspiration level. Assuming CSR activities are considered to have a long-term benefit to a firm, there is no evidence showing firms with superior financial performances are more motivated to engage in such activities. The results presented in Table 3 are also contrary to prior studies relating CSR with ethical behavior or financial reporting quality (Kim et al., 2012). While there is a significant negative relationship between accruals (ACCRit) and CSR for the whole sample, the relationship fades out for the divided sample, and no significant relationship is observed for firms performing at or above their aspiration level. These findings contribute to the existing CSR literature by conveying relative performance as one more factor determining CSR behavior. More specifically, firms performing far above the aspiration level are less likely to show a better CSR performance.
Second, the study contributes to the existing literature investigating the determinants of tax avoidance. There is a significant difference in the level and sign of tax avoidance between firms performing below and at or above the aspiration level. This relationship is consistent with the inverted “U”-shaped relationship. There is a positive relationship for firms performing below the aspiration level indicating higher tax avoidance exhibited by firms near the aspiration level than firms far below the aspiration level. For firms performing at and above the aspiration level, there is a negative relationship showing a decrease in tax avoidance with an increase in performance far above the aspiration level contrary to Rego (2003) and Chen et al. (2010). These results indicate that extremely higher or lower financial performances are not related to higher tax avoidance. On one hand, the results show that tax avoidance is not considered a cheaper activity to become a choice for firms performing far below the aspiration level (Kuusela et al., 2017). As it could lead to scrutiny from regulators and taxing authorities (Chyz & Gaertner, 2018), poorly performing firms may consider tax avoidance a risky activity triggering their survival. On the other hand, these results create a doubt on the notion that firms are likely to take risky misappropriate deviant actions as performance gets far below the aspiration level. According to Xu et al. (2019), as performance gets far below the aspiration level, the probability of exhibiting such deviant activities increases. However, the findings in this study show higher tax avoidance for firms performing near, both above and below, the aspiration level.
The results on the relationship between relative performance and tax avoidance can be interpreted in two ways based on two contrasting types of risk-taking—deviant and aspirational (Xu et al., 2019). Firms performing below the aspiration level, but near the aspiration level, may take deviant risk motivated by their desire to meet or beat the aspiration level within a short period of time. Results in both Tables 4 and 5 show a positive relationship between earnings manipulations (ACCRit) and tax avoidance for firms performing below their aspiration. Therefore, these firms are more likely to manipulate their financial statements and also use aggressive tax avoidance activities. Aggressive financial statement manipulation along with aggressive tax avoidance is a very risky decision as it is likely to attract scrutiny from regulators (Frank et al., 2009). Whereas firms performing at or above, but near, the aspiration level may take aspirational risk motivated by their desire to sustain their competitive advantage and fulfill their long-term objectives. Tables 4 and 5 show negative relationships between earnings manipulations (ACCRit) and tax avoidance for firms performing above aspiration. Therefore, these firms are more likely to use legal tax-planning techniques rather than aggressively manipulating their financial reports. These results might also have important practical implications for regulatory bodies and taxing authorities concerned about understanding firms’ tax behavior. Firms below and above, but near, the aspiration level are more likely to avoid taxes than others.
The third and the main contribution of this study is refining the relationship between CSR and tax avoidance. Although firms performing below aspiration are more likely to show better CSR performance than above aspiration performers, the results in this study do not provide evidence that higher CSR performance is related to higher tax avoidance for firms performing below the aspiration level. The results for the full sample show a slightly significant positive relationship between CSR performance and tax avoidance. However, when firms’ relative performance is controlled, there is no significant relationship observed between the two. Therefore, the relationship between CSR and tax avoidance is attributed to firms’ performance relative to the aspiration level. When the sample is divided into two groups, the positive relationship disappears for firms performing below their aspiration level and turns into negative. This negative relationship shows that lower CSR performance is related to more tax avoidance consistent with the substitute hypothesis (Davis et al., 2016). However, this relationship can be attributed to firms performing below, but near, the aspiration level only. As it is discussed above, firms performing near (but below) the aspiration level are likely to show higher tax avoidance and slightly lower, while not statistically significant, CSR performance. Therefore, it can be argued that firms taking a deviant risk because of their myopic desire to reach the aspiration level are less likely to invest in long-term CSR activities but excessively avoid taxes to boost short-term performances.
For firms meeting or beating their aspiration level, the slight positive relationship persists consistent with the complement hypothesis (Hoi et al., 2013). This result is expected as discussions made above show that firms performing above, but near, the aspiration level exhibit higher CSR performance and also avoid more taxes. Such firms are likely to take aspirational risk motivated by their desire to sustain their competitive advantage and engage in both CSR and tax-planning activities. Therefore, this study contributes to the existing CSR and tax avoidance literature by refining the relationship based on the type of risk they are likely to take. Firms performing below (but near) their aspiration level are likely to take a deviant risk and, therefore, engage in short-term myopic activities such as tax avoidance than long-term competitive activities such as CSR. On the contrary, firms performing above (but near) the aspiration level are likely to take an aspirational risk and engage in both CSR and tax-planning activities. These firms may be interested in cost-saving tax-planning activities so that they can bring more changes to the firm and sustain their competitiveness.
Conclusion
This study attempts to advance on the existing view on the relationship between CSR and tax avoidance by incorporating firms’ behavioral aspects. Grounded by the BTOF, firms are classified based on their expected behavior toward risk-taking or organizational change. Firms may behave differently in their CSR and tax avoidance activities based on their prior relative performance. Using a sample of S&P 1500 firms for the period covering 2007 through 2016, this study provides pieces of evidence with significant contributions and implications for the BTOF, tax avoidance, and CSR literature. First, the findings contribute to the existing BTOF and CSR literature by conveying relative performance as one of the factors determining firms’ CSR behavior. More specifically, firms performing far above the aspiration level are less likely to engage in CSR activities than other firms as they are less motivated to bring changes. Second, this study contributes to the existing literature investigating the determinants of tax avoidance. There is an inverted “U”-shaped relationship between relative performance and tax avoidance indicating higher tax avoidance by firms in the neighborhood of the aspiration level. Last and most importantly, this study contributes to the existing CSR and tax avoidance literature by refining the relationship between these two constructs. Firms performing below (but near) their aspiration level are likely to take a deviant risk and, therefore, engage in short-term myopic activities such as tax avoidance than long-term competitive activities such as CSR. On the contrary, firms performing above (but near) their aspiration level are likely to take an aspirational risk and engage in both long-term sustainability-related activities such as CSR and also current cost-saving activities such as tax planning. In conclusion, tax payments may serve two roles based on the type of risk the firm is motivated to take. Higher tax avoidances reported by firms near below the aspiration level are related to motives to show better short-term financial performance while firms near above the aspiration level are motivated in tax avoidance to cut current corporate costs and sustain their long-term competitive advantage.
Despite its valuable contributions, it can be realized that this study is not without limitations. First, the sample of S&P 1500 firms may bind the generalizability of the findings of the study to only big US firms. Future researchers with data access from big CSR databases like KLD can provide more compelling evidence using larger sample size, a wider time-period, and geographically diverse data. Second, despite the weak effect documented by prior studies on the impact of slack on risk-taking and motivating change (Greve, 2003a) and though it is controlled in this study, future research may show the combined effect of relative performance and slack in determining tax avoidance and CSR-related activities of firms. Finally, while this study focuses on firm characteristics only, the existing literature shows that CEO characteristics such as incentives and compensations might also affect tax avoidance.
Footnotes
Acknowledgements
The author is grateful and acknowledges the contribution of the editors and two anonymous reviewers. Your detailed comments were highly valuable.
Author’s note
This article is a work by a single person.
Compliance with ethical standards
This article is an original work of the author and it complies with all ethical standards of the journal of business ethics.
Declaration of conflicting interests
The author(s) declared no potential conflicts of interest with respect to the research, authorship, and/or publication of this article.
Funding
The author(s) received no financial support for the research, authorship, and/or publication of this article.