
Abstract
We investigate the role of financial constraints on firms’ exporting behavior, including firms’ export decision, export intensity, firms starting to export decision, and exports persistence. Our financial constraints variable is a synthetic variable that summarizes information on different dimensions such as total assets, profitability, liquidity, solvency, repaying ability, and (new in this type of analyses) the cost of external financing. Using data on Spanish manufacturing for the period 1992–2014, we find evidence supporting that financial health is relevant to explain small and medium-sized enterprises (SMEs) exporting decisions and starting to export decisions but not those of large firms. Financial health does not seem to affect large firms’ export intensity and the results of the impact of financial health on SMEs export intensity are not conclusive. Nevertheless, financial health is a determinant of export persistence of large firms and SMEs.
Introduction
In an increasingly globalized world internationalization has been seen as a necessary strategy for firm’s growth and survival (Hsu et al., 2013). In fact, the international economics literature has reached a wide consensus about the benefits of operating internationally. Firms selling beyond their boundaries are not only more productive than domestic firms (Bernard & Jensen, 1999; Greenaway et al., 2007; Peters et al., 2018; Wagner, 2007) but also bigger, more capital-intensive and pay higher wages (Baldwin & Gu, 2003; Girma et al., 2004; Greenaway & Kneller, 2004). Besides, firms active in international markets before a negative macroeconomic shock are more resilient than non-exporters and perform better during and after the shock in terms of jobs, productivity, or likelihood of survival (Eppinger et al., 2018). 1 Then, one may wonder, if exports is such an efficient strategy why do not all firms commit to it? 2 One reason which has received special attention in the literature is the lack of liquidity (Greenaway et al., 2007; Musso & Schiavo, 2008; Minetti & Zhu, 2011; Máñez et al., 2014; Muûls, 2008, among others). 3 However, as mentioned in Wagner (2014a, 2019) despite the efforts made by researchers there are still some shortcomings which have caused that we cannot guide policy makers in an evidence-based way. First, we still lack for a good measure of financial constraints. 4 This is even more worrying in the case of smaller companies, which are the more likely to suffer from credit constraints. Besides, also mentioned in Wagner’s study, usually, the period of time available for the analysis is not long enough and therefore it is difficult to investigate the direction of causality between exporting and credit constraints in a convincing way. Finally, the lack of studies using panel data makes difficult to control for unobserved firms’ characteristics which could dangerously invalidate the results.
Our article contributes to solve these issues proposing a new way to measure financial constraints. In comparison with other Spanish studies using the same dataset (Beneito et al., 2015, 2016; Máñez et al., 2014), we add new variables containing relevant information related to the existence of liquidity constraints and create an index that approximates the level of firms’ financial constraints. Following the method recommended by Musso and Schiavo (2008), we build a firm-year score aimed to mirror the degree of financial constraints at the firm level. We believe this is the best method to assess financial constraints since it allows us to capture different degrees of financial constraints. Furthermore, the index (which in a certain way is similar to credit ratings) can be built independently of the firm size. Differently from Musso and Schiavo (2008), we add to this score, besides quantity variables, a price variable acknowledging the importance of both the amount of funds the firm has access to and the cost of them. We also solve the problem related to the limited amount of years available for analysis by using a sample of Spanish manufacturing firms for a period of 22 years, allowing us to control for unobserved time-invariant firm characteristics. Our second contribution is related to the acknowledgment of the different effects of liquidity constraints depending on firms’ stage. Starting from a dynamic model, which analyzes the dichotomic choice of exporting or not and firms’ export intensity, we take one step further and disentangle the effects of financial constraints on the decision of starting to export and continuing exporting. Finally, because we believe the size may play a role in the linkages between exporting and financial constraints, our last contribution consists in studying the dynamic decision to export and export intensity, the decision to start exporting, and the decision of continuing exporting distinguishing between large firms and small and medium-sized enterprises (SMEs).
The data used in the study come from the Survey of Business Strategies (ESEE) for the period 1992–2014. ESEE is an annual panel survey representative of Spanish manufacturing firms by industry and size categories. The final working sample consists of more than 20,000 observations corresponding to 2,600 firms.
The main results can be summarized as follows. First, financial constraints are a significant determinant of SMEs export decision but not significant for large firms. Second, financial health does not seem to be relevant in the determination of large firms’ exports intensity, and its impact on SMEs export intensity is not conclusive. Second, and aligned with our result on the decision to export, an improvement on financial health would help SMEs to start exporting, while would not have any effect on large firms. Taking into account the high percentage of SMEs in the manufacturing sector in Spain, jointly our first and third results highlight the importance of accessing to liquidity in their internationalization process, with important policy implications. Third, financial health is also positively associated with export persistence regardless firm size. The probability of dropping out from foreign markets is lower for less financially constrained firms, both large firms and SMEs.
The remainder of the article is structured as follows. Section “Related literature” discusses the related literature and summarizes the measurements used in previous studies to proxy financial constraints. Section “Financial constraint variables” introduces the scores used to measure financial constraints. Section “Data and descriptive statistics” describes the Spanish data set on which the empirical analysis is based and provides descriptive statistics, while section “Financial constraints and firms’ decisions of whether to export and export intensity” analyzes the role of financial constraints in firms’ export decisions and export intensity. In section “The decision to start exporting and financial constraints,” we analyze whether financial constraints have an impact on firms’ decision to start exporting. Section “Financial constraints and export persistence” investigates whether financial constraints affect firms’ export persistence. The final section discusses these results and highlights the contribution of the research to policy and managerial practice.
Related literature
Theoretical models of heterogeneous firms à la Melitz (2003) have incorporated financial drivers as a factor explaining export adoption. The intuition behind these models is that due to the high fixed costs involved in the internationalization process, which are largely sunk (Roberts & Tybout, 1997), only firms not financially constrained can afford the extra costs and access to foreign markets (Caggese & Cuñat, 2013; Chaney, 2016; Manova, 2013; Muûls, 2008). 5 Using similar arguments, the link between firms’ financial health and export exit has been also studied. However, here the effects of credit constraints on the exit decision are more ambiguous. On one hand, exporting firms to remain in the activity have to face the fixed costs of operating internationally (Aw et al., 2011) and, therefore, firms facing financial constraints may have difficulties to maintain their international presence. On the other hand, given that financial constraints also affect entry, firms have strong incentives to remain in international markets since they may not be able to pay again the high start-up costs (Askenazy et al., 2015). Moreover, all the considerations presented up to now might prove to be particularly relevant for SMEs. First, SMEs have been found to have less access to external finance and to be more constrained in their operations (Beck & Demirguc-Kunt, 2006). 6 Second, large firms usually have larger internal funds than SMEs increasing their ability to finance trade costs (Damijan & Kostevc, 2011; Requena-Silvente, 2005). Third, SMEs are usually more risk averse, which make them to self-impose additional constraints hampering exporting ventures. 7 Bonnet et al. (2005) find that a significant amount of French companies, even when facing internal constraints, do not resort to external loans, and when they do, borrow a smaller amount than the one corresponding to their size. The lower access to internal funds jointly with the higher difficulties on accessing to external funds for SMEs affects the probability of survival of these companies in foreign markets, which is lower than in the case of large companies.
On the empirical side, the first study analyzing the link between financial constraints and exports, using firm-level data, was Greenaway et al. (2007). They find no evidence that firms enjoying better ex-ante financial health are more likely to start exporting but that participation in export markets improves firms’ ex-post financial health (in the case of continuous exporters, but no for starters).
8
Since then, a growing number of empirical works have looked at the link between liquidity constraints and export adoption using firm-level data. The stylized fact is that financial constraints are important for the export decisions of firms: exporting firms are less financially constrained than non-exporting firms. Studies that look at the direction of this link usually report that less constrained firms self-select into exporting, but that exporting does not improve financial health of firms. (Wagner, 2014a, p. 1479)
9
The relevance of the analysis of the effects of financial health on export persistence relies on the fact that if a country aims to be competitive in international markets is not enough with easing access to international markets, it is also of crucial importance that these firms will persist in export markets. On theoretical grounds, persistence in export markets may arise both from the existence of sunk costs associated with start/continue exporting and from learning-by-exporting effects associated with continuous exporting. Learning-by-exporting is related to the fact that exporters may exhibit efficiency gains from economies of scale, learning from foreign markets, or from increased competition forcing them to become more efficient. Furthermore, it is important to consider that Timoshenko (2015) shows that exporting experience acquired by continuous exporters brings forth continuing exporting. The rationale behind this result is quite simple, experienced exporters have learned more from operating in foreign markets than less experienced exporters, and thus, the profitability obtained in a given market increases with the extent of exporting experience. Therefore, firms could be interested in continuing to export even in the presence of exogenous adverse shocks in export markets to keep this virtuous circle going.
Empirical studies documenting the effects of credit constraints on export persistence are much scarcer and evidence is ambiguous and far from conclusive. While Askenazy et al. (2015) and Görg and Spaliara (2018), for a sample of French and UK manufacturing firms respectively, find a higher probability of export exit associated with credit constraints, Berman and Héricourt (2010) in a multi-country study find no evidence that access to finance influences the decision of continuing exporting. Therefore, more research is needed to understand the link between liquidity constraints and export exit. Regarding the role of firms’ size in the relationship between exporting and financial constraints, Zia (2008) shows the effects of subsidized export loans on exports of small and large firms. For a sample of Pakistan companies, the removal of these subsides negatively affects small firms, while large firms are not affected. Meanwhile, Forbes (2007) shows how during a period of raising capital flow taxes, small Chilean firms suffer more from financial constraints. Furthermore, these financial constraints loosen with the size of the firm. Finally, Damijan et al. (2010) find that small businesses always benefit from having access to higher liquidity (either through internal or external funds), while the results for medium and large companies are ambiguous.
Independently whether the entry or exit decision is under analysis, empirical papers can be clustered in four groups depending on how financial constraints are measured. The next subsections are devoted to explain each of these measurements pointing out their main advantages and drawbacks.
Qualitative measures
The first group consists of works measuring financial constraints according to a self-reported assessment of the firm financial situation. Within this group, Minetti and Zhu (2011) considered as “strong credit rationing firms” those responding “yes” to the next two questions: (1) “In 2000, would the firm have liked to obtain more credit at the market interest rate?” In the case of an affirmative answer to (1), the following question was asked: (2) “In 2000, did the firm demand more credit than it actually obtained?.” The conclusion from this study is that the probability of exporting for credit-rationed firms is lower than for non-credit rationed ones. Arndt et al. (2012) for Germany, Caggese and Cuñat (2013) for Italy, or Espanol (2007) for Argentina are other studies also using data collected through a survey to construct a direct indicator to identify liquidity constrained companies. 10 However, this way of measuring financial constraints has two main drawbacks. First, as a qualitative measure, these proxies what are actually measuring is the perceived financial constraints (Bovha Padilla et al., 2009) and, therefore, they are subject to measurement error that might be correlated with the explanatory variables (Bertrand & Mullainathan, 2001). 11 Second, these measures are likely to suffer from endogeneity problems since some unobserved firms’ characteristics (e.g., the ability of managers to obtain funds from banks) could be correlated with the response behavior of firms.
Credit ratings
The second group includes studies using credit rationing scores provided by credit rating agencies to proxy financial constraints (Muûls, 2008, 2015; Secchi et al., 2011; Wagner, 2014b). One of the strengths of this method is that the score is determined independently by a private firm reducing then the measurement bias. Moreover, the degree of credit constraints can be evaluated at the firm level and not just classifying firms as constrained and not constrained. However, this way of measuring credit constraints is not exempt of weaknesses. On one hand, given that the score is built using a number of firms’ characteristics such as firm age, productivity, and firm size, the measurement will be endogenous to firm’s performance and characteristics. On the other hand, credit rating scores are usually available only for large companies operating in highly developed countries, and, thus, empirical results should not be considered as stylized facts.
Financial ratios
The third group consists of studies that use either balance sheet information or financial statements to build financial ratios to approximate firms’ liquidity constraints. Among these works, cash flow and leverage or debt-related measures are the most common approaches used to identify the presence of financial constraints (Akarım, 2013; Askenazy et al., 2015; Beneito et al., 2015, 2016; Berman & Héricourt, 2010; Buch et al., 2010; Forlani, 2010; Görg & Spaliara, 2018; Greenaway et al., 2007; Máñez et al., 2014; Manole & Spatareanu, 2010; Stiebale, 2011; Zhiyuan & Miaojie, 2013). Sensitivity of exports to cash flow is interpreted as a signal of a large wedge between internal and external costs of funds, which would imply firms being financially constrained. In this manner, a high level of leverage is seen as a signal of high-risk firms and therefore with scarce access to external funds. However, these indirect procedures have already been seriously criticized. In the case of cash flow, it is implicitly assumed that firms have a preference for internal finance, although there could be some firms that prefer external funding or a combination of both internal and external funds. Most importantly, it is also assumed that cash flow only reflects the sensitiveness of exports to costlier external sources of finance. While it could also capture, for instance, uncontrolled demand conditions in estimation that are correlated with firms’ internal finance and export decision. 12 By the same token, a high leverage could also be signaling that the firm has enjoyed wide access to external funds and therefore it is not financially constrained (Bellone et al., 2010).
Financial scores
In line with the previous group, the last group consists of studies that also using balance sheet information build financial scores aiming to measure firms’ financial health. Musso and Schiavo (2008), Bellone et al. (2010), or Silva (2011) are some works employing this method. 13 We believe this is the best way to measure liquidity constraints since it groups all the strengths of credit rationing scores, avoiding its main weakness. Unlike the credit rationing that are only available for large companies, these scores, as a self-measure constructed by the researcher, are available to any company, regardless of their size. Besides, as argued by Muûls (2008), similar to credit rationings although the score could be endogenous to the firm’s performance and characteristics, it is not directly affected by its exporting behavior, since exports are not used to build the score (Wagner, 2014a). However, as it will be explained below, there is still room for improvements in these scores.
Financial constraint variables
In the spirit of Musso and Schiavo (2008), we have built a financial constraint variable that is a synthetic index that collapses the information on six variables that contain relevant information relative to the existence of financial constraints. These six variables are total assets, profitability (returns on sales), liquidity (ratio of current assets to current liabilities), solvency (own funds over total liabilities), repaying ability (financial debt over cash flow), and cost of firm’s new long-term debt (Beneito et al., 2015). Different from Musso and Schiavo (2008) index that is based on quantities (as the first five variables in our index), we incorporate a price variable, namely the financial costs of long-term debt. It is important to note, that to the best of our knowledge, this is the first analysis that incorporates a price variable into a financial constraint index such as that proposed by Musso and Schiavo (2008).
We use the following procedure to build the financial constraints index. First, we compute the relative value of each of these variables with respect to the industry-year average. Second, we classify the relative values of each variable according to the quintile to which they belong. We classify the relative values of each of the first five variables in the above paragraph according to the quintile they belong in increasing order. The financial cost variable is classified also in quintiles but in decreasing order. The result is that for each firm-year observation we end up with six categorical variables ranging from one to five, where one would correspond to the most financially constrained firms and five the least financially constrained firms. Third, we combine the information on these six categorical variables in two different ways to obtain a synthetic index: Score E is calculated as the simple sum of the six categorical variables; Score F as six (number of variables considered to build the score) minus the count of the number of variables for which the firm-year observation lies in the first quintile. Finally, we re-scale these indexes to have a 1–10 common range. Interestingly, as in Musso and Schiavo (2008), the ranking of firm-year observations is quite robust to the different aggregation methods. 14 It is important to note that, such as we have built the two synthetic indexes, smaller values of the scores are associated with higher degree of financial constraints.
For the sake of robustness, we include in Appendix 2 additional tables with the results of replicating our different empirical analyses with two financial scores identical to Scores E and F, but for the fact that they do not include the financial cost variable, that is, in line with Musso and Schiavo (2008) they are calculated on the basis of the five quantity variables described above. Thus, Score EE (Score FF) has been calculated as Score E (Score F) but without including the financial cost variable. When the results with Scores EE and FF differ from those obtained with Scores E and F we will note it. 15
Data and descriptive statistics
Data
The data are drawn from the Spanish Survey of Business Strategies (ESEE), an annual survey of Spanish manufacturing sponsored by the Ministry of Industry and carried out since 1990. The ESEE is a representative sample of Spanish manufacturing firms classified by industry and size categories that provides information at the firm level.
The sampling procedure of the ESEE is as follows. Firms with less than 10 employees were excluded from the survey. Firms with 10–200 employees (SMEs) were randomly sampled, representing around 5% of the population in 1990. All firms with more than 200 employees (large firms) were requested to participate, obtaining a participation rate around 70% in 1990. Important efforts have been made to minimize attrition and to annually incorporate new firms with the same sampling criteria as in the base year, so that the sample of firms remains representative over time. 16
The ESEE has some relevant characteristics that make it well suited for our analysis of the relationship between firms’ financial health and export behavior. First, the survey provides balance information, and data about financing that allows calculating the financial ratios and measures used to build scores E and F. Second, the ESEE supplies the necessary information to identify firms that export in a continuous way, quit exporting, or stop answering the survey during our 22 years long period under analysis (from 1992 to 2014). 17
From the ESEE survey, we sample out those firms’ observations that fail to supply relevant information about all the variables involved in our analysis. The number of observations differs according to the data requirements of the three pieces of analysis carried out, namely, the analysis of the role of financial health on the firms’ decisions to whether export or not and export intensity in case they export, decision of starting to export and export persistence. In each of the analyses, we specify the criteria for sample selection.
Descriptive statistics
We start providing some information on our two financial scores. First, it is important to note that the correlation between the two financial scores that we use to measure firms’ financial health is 0.767. Table 1 shows the mean of our two financial scores both for the full sample and for the subsamples of SMEs and large firms, and distinguishing between exporters and non-exporters. 18
Mean of scores: financial constraints, size, and export status.
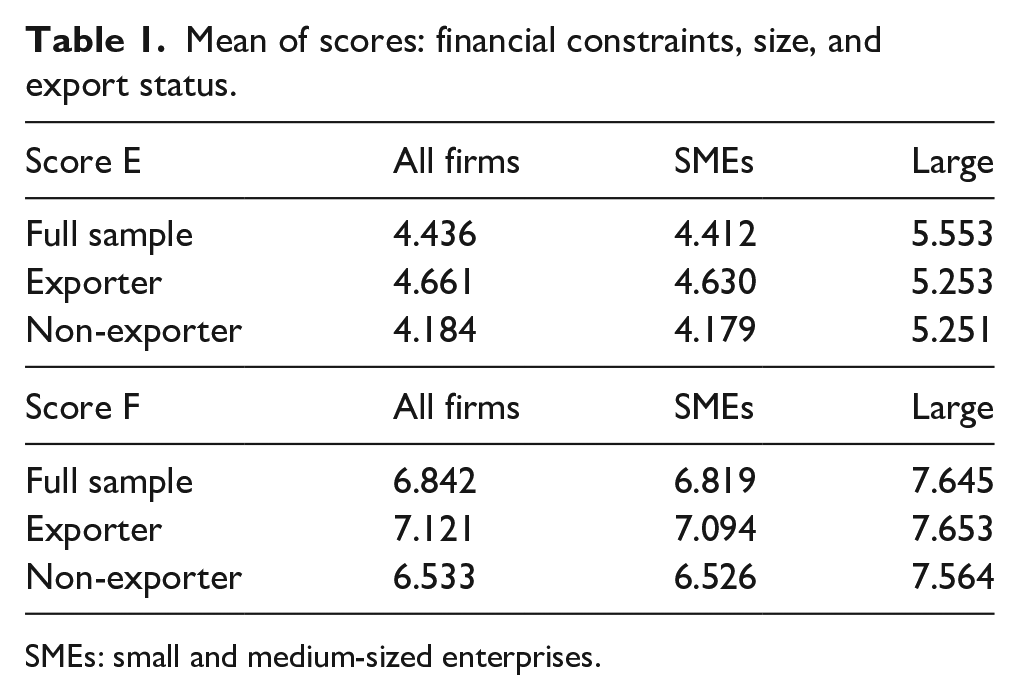
SMEs: small and medium-sized enterprises.
For the full sample of firms, mean values for Scores E and F are larger for large firms than for SMEs. The same happens for the samples of exporters and non-exporters. Furthermore, as we are interested in exploring the possible role of size in the relationship between financial constraints and firms’ export behavior, we use stochastic dominance techniques to check whether, as one would expect, large firms enjoy better financial health than SMEs (i.e., whether the financial scores distribution of large firms dominates that of SMEs). Thus, we compare

using the Kolmogorov–Smirnov (KS, hereafter) one- and two-sided tests, where
Stochastic dominance tests of the distributions of financial scores: large firms versus SMEs.
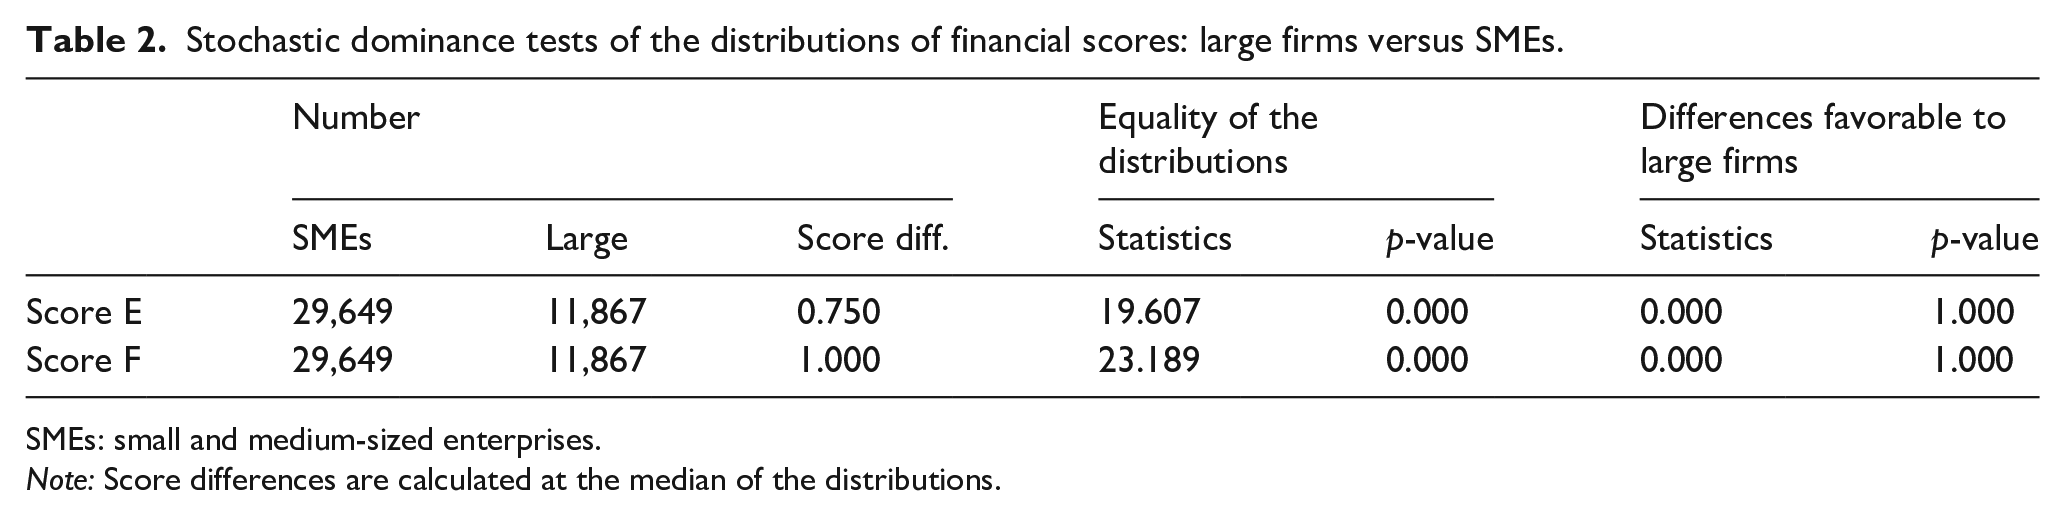
SMEs: small and medium-sized enterprises.
Note: Score differences are calculated at the median of the distributions.
Before analyzing how financial restrictions affect firms’ export behavior and to get a first picture of the relationship between firms’ financial health and exporting, we check whether exporters enjoy better financial health (are less financially constrained) than non-exporters. We double check this relationship using both stochastic dominance techniques and estimating the reduced-form equation proposed by Bellone et al. (2010).
First, we check whether the financial scores distribution (for Scores E and F) of exporters stochastically dominates that of non-exporters. Thus, for each size group, we compare
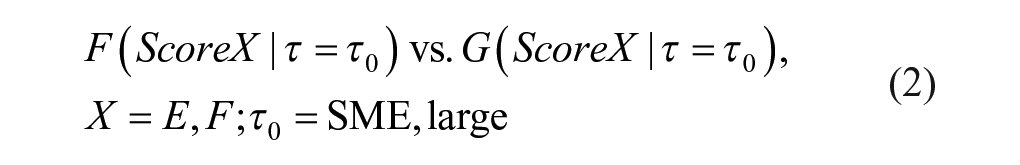
using the KS one- and two-sided tests, where
Stochastic dominance tests of the distributions of financial scores: exporters versus non-exporters.
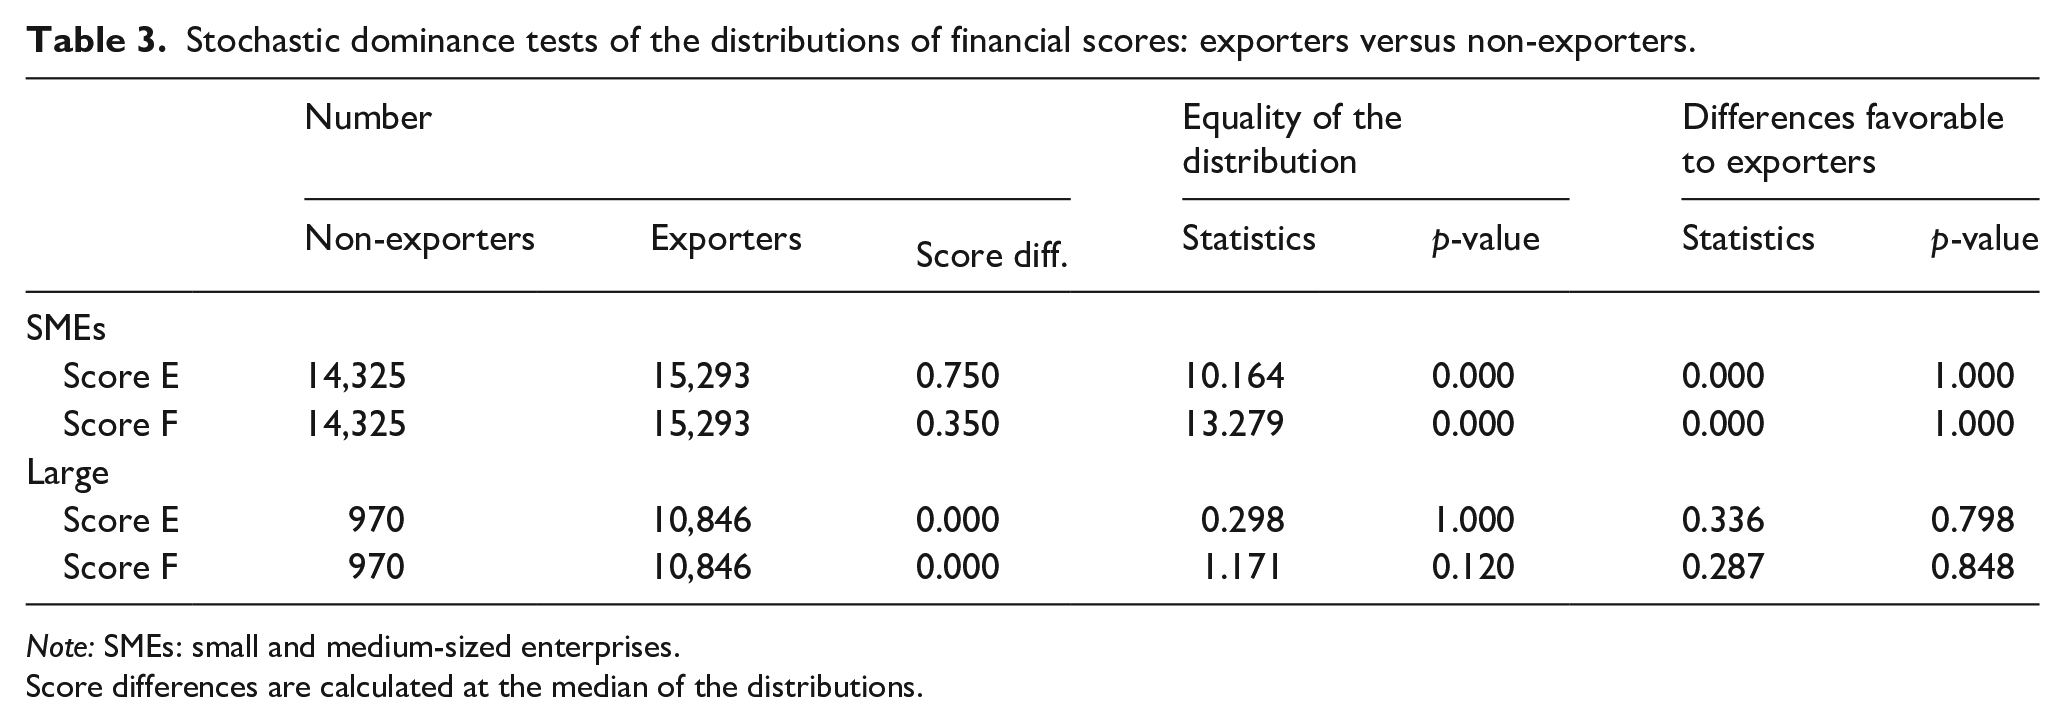
Note: SMEs: small and medium-sized enterprises.
Score differences are calculated at the median of the distributions.
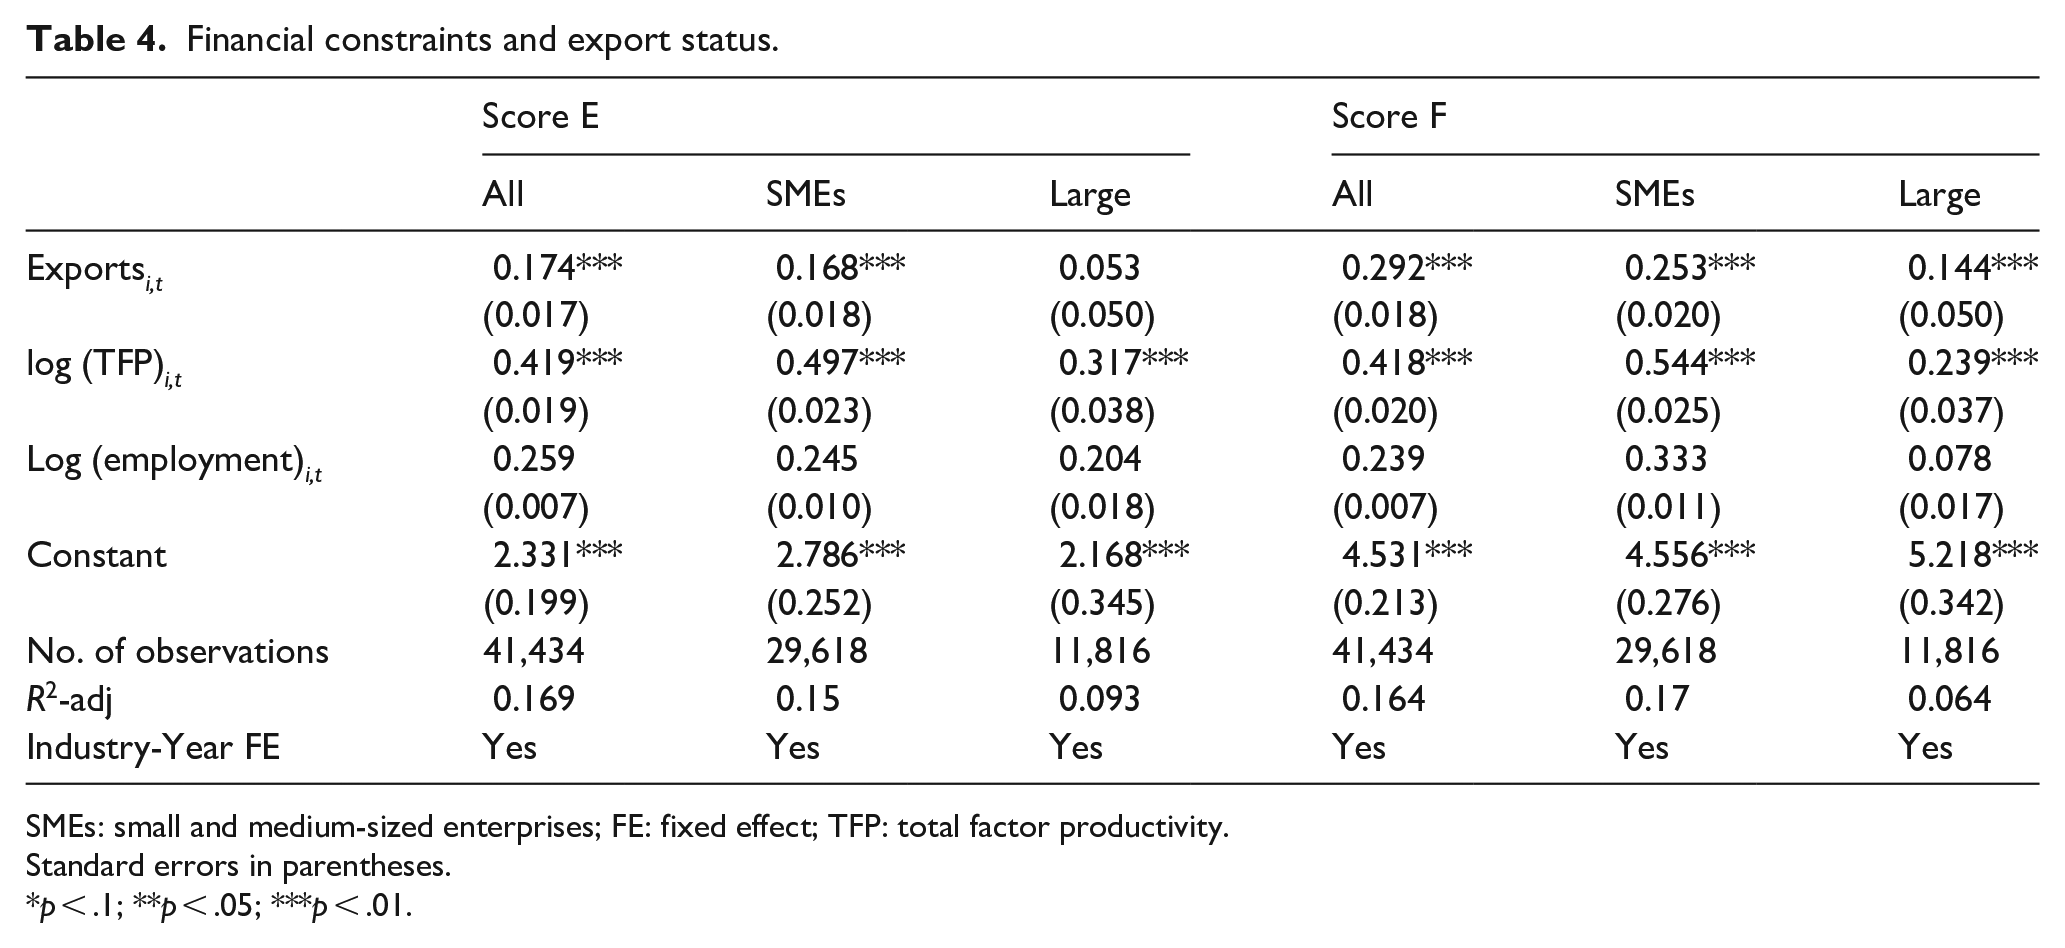
In the second piece of analysis on the correlation between financial health and export status, we estimate the following reduced-form equation proposed by Bellone et al. (2010)

where ScoreXit is either ScoreE or ScoreF; Exportit is a dummy variable taking value 1 if firm i exports in year t and zero otherwise; Zit is a vector of control variables including logs of total factor productivity (TFP, hereafter) 22 and employment, and a vector of industry-year dummies. 23
Regardless of whether we use as measure of financial constraints Score E or F, estimates in Table 4 suggest that exporting SMEs enjoy better financial health than non-exporting SMEs. Nevertheless, the results for large firms differ depending on the score taken as reference. Whereas results using Score F point out less astringent financial constraints for large exporters; when using Score E, we do not find significant differences between large exporters’ and large non-exporters’ financial health. 24
Financial constraints and export status.
SMEs: small and medium-sized enterprises; FE: fixed effect; TFP: total factor productivity.
Standard errors in parentheses.
p < .1;
p < .05;
p < .01.
Therefore, this second approach confirms that exporting SMEs enjoy better financial health than their non-exporting counterparts. For large firms, we also confirm no differences in financial health between exporters and non-exporters when proxying financial health using Score E. However, when using Score F, the reduced-form analysis suggests that large exporters enjoy better financial health. In spite of this difference in the regression analysis when using Score F, most of our analysis suggests no financial health differences between large exporters and large non-exporters.
Financial constraints and firms’ decisions of whether to export and export intensity
We start this section with the analysis of the impact of financial health on the firms’ decisions of whether to export or not. Then, we analyze for those firms that decide to export how financial health may affect their export intensity.
The decision to export and financial constraints
Empirical model
We consider that a firm decides to export in year t whenever the increase in gross operating profits associated with export plus the discounted expected future returns from being an exporter in t exceed sunk costs (Clerides et al., 1998; Roberts & Tybout, 1997). The rationale behind the consideration of sunk costs stems from the fact that firms entering foreign markets have to engage in a series of activities which are related only to exporting, such as market research, setting up a new distribution network, negotiating with potential new partners, and modifying existing product ranges (Love & Ganotakis, 2013). All of these involve sunk costs, which are irreversible investments if the firm quits exporting. The presence of these sunk costs related to exporting implies that firms’ current export choices depend on past export choices. To capture this state dependence, our model of the likelihood of exporting will be framed in terms of sunk costs (proxied by export status in t–1) and a reduced-form set of variables proxying for the payoffs of exporting and, thus, firms’ capabilities to push their expected profits above sunk entry costs. In this article, we pay special attention to the role of financial constraints proxied for Scores E and F (defined above) that summarizes various dimensions of firms’ internal and external financial constraints.
In practical terms, we estimate a dynamic discrete choice model of the decision to export, in which the decision of exporting in period t is conditioned on the previous vector of state variables for that year
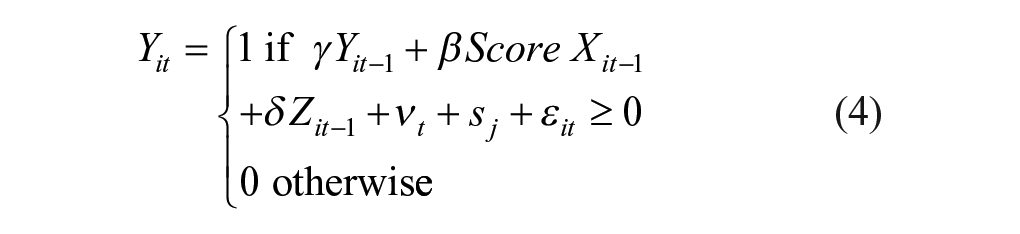
where γ identifies the sunk costs of exporting; Score X (for X = E, F) is the synthetic index controlling for both internal and external financial constraints; Zit is the vector of control variables (TFP, a set of firm size dummies, 25 foreign capital participation, whether the firm introduces process and product innovations and register patents, proportion of skilled labor and demand conditions) that may affect the firms’ expected returns from exporting; νt is a vector of year dummies; and sj is vector of industry dummies. Finally, there may be firm unobserved factors affecting firms’ expected returns from exporting such as product attributes, managerial skills, or international department personnel ability. For this reason, we assume that εit has two components, a permanent firm-specific effect (αi) and a transitory component (uit), then εit = αi + uit. Hence, we allow for two sources of serial correlation in εit. This is an important issue since, whether or not uit are independent across t, εit will be always serially correlated because of αi.
Furthermore, we control for correlated unobserved firms’ heterogeneity using the fixed effects approach developed by Blundell et al. (1999, 2002). Following their approach, the pre-sample means of the dependent variable (Ypre) are sufficient statistics for the unobserved fixed effects (αi). Thus, to control for this heterogeneity, we add the pre-sample mean of the dependent variable (“initial conditions” variable) as an additional explanatory variable in period t in equation (4). As we use as pre-sample period 1992–1994 and some of the explanatory variables in equation (4) are lagged one period, we carry out estimation for the period 1995–2014. With this criterion, our estimation sample consists of 20,183 observations corresponding to 2,600 firms.
Estimation results
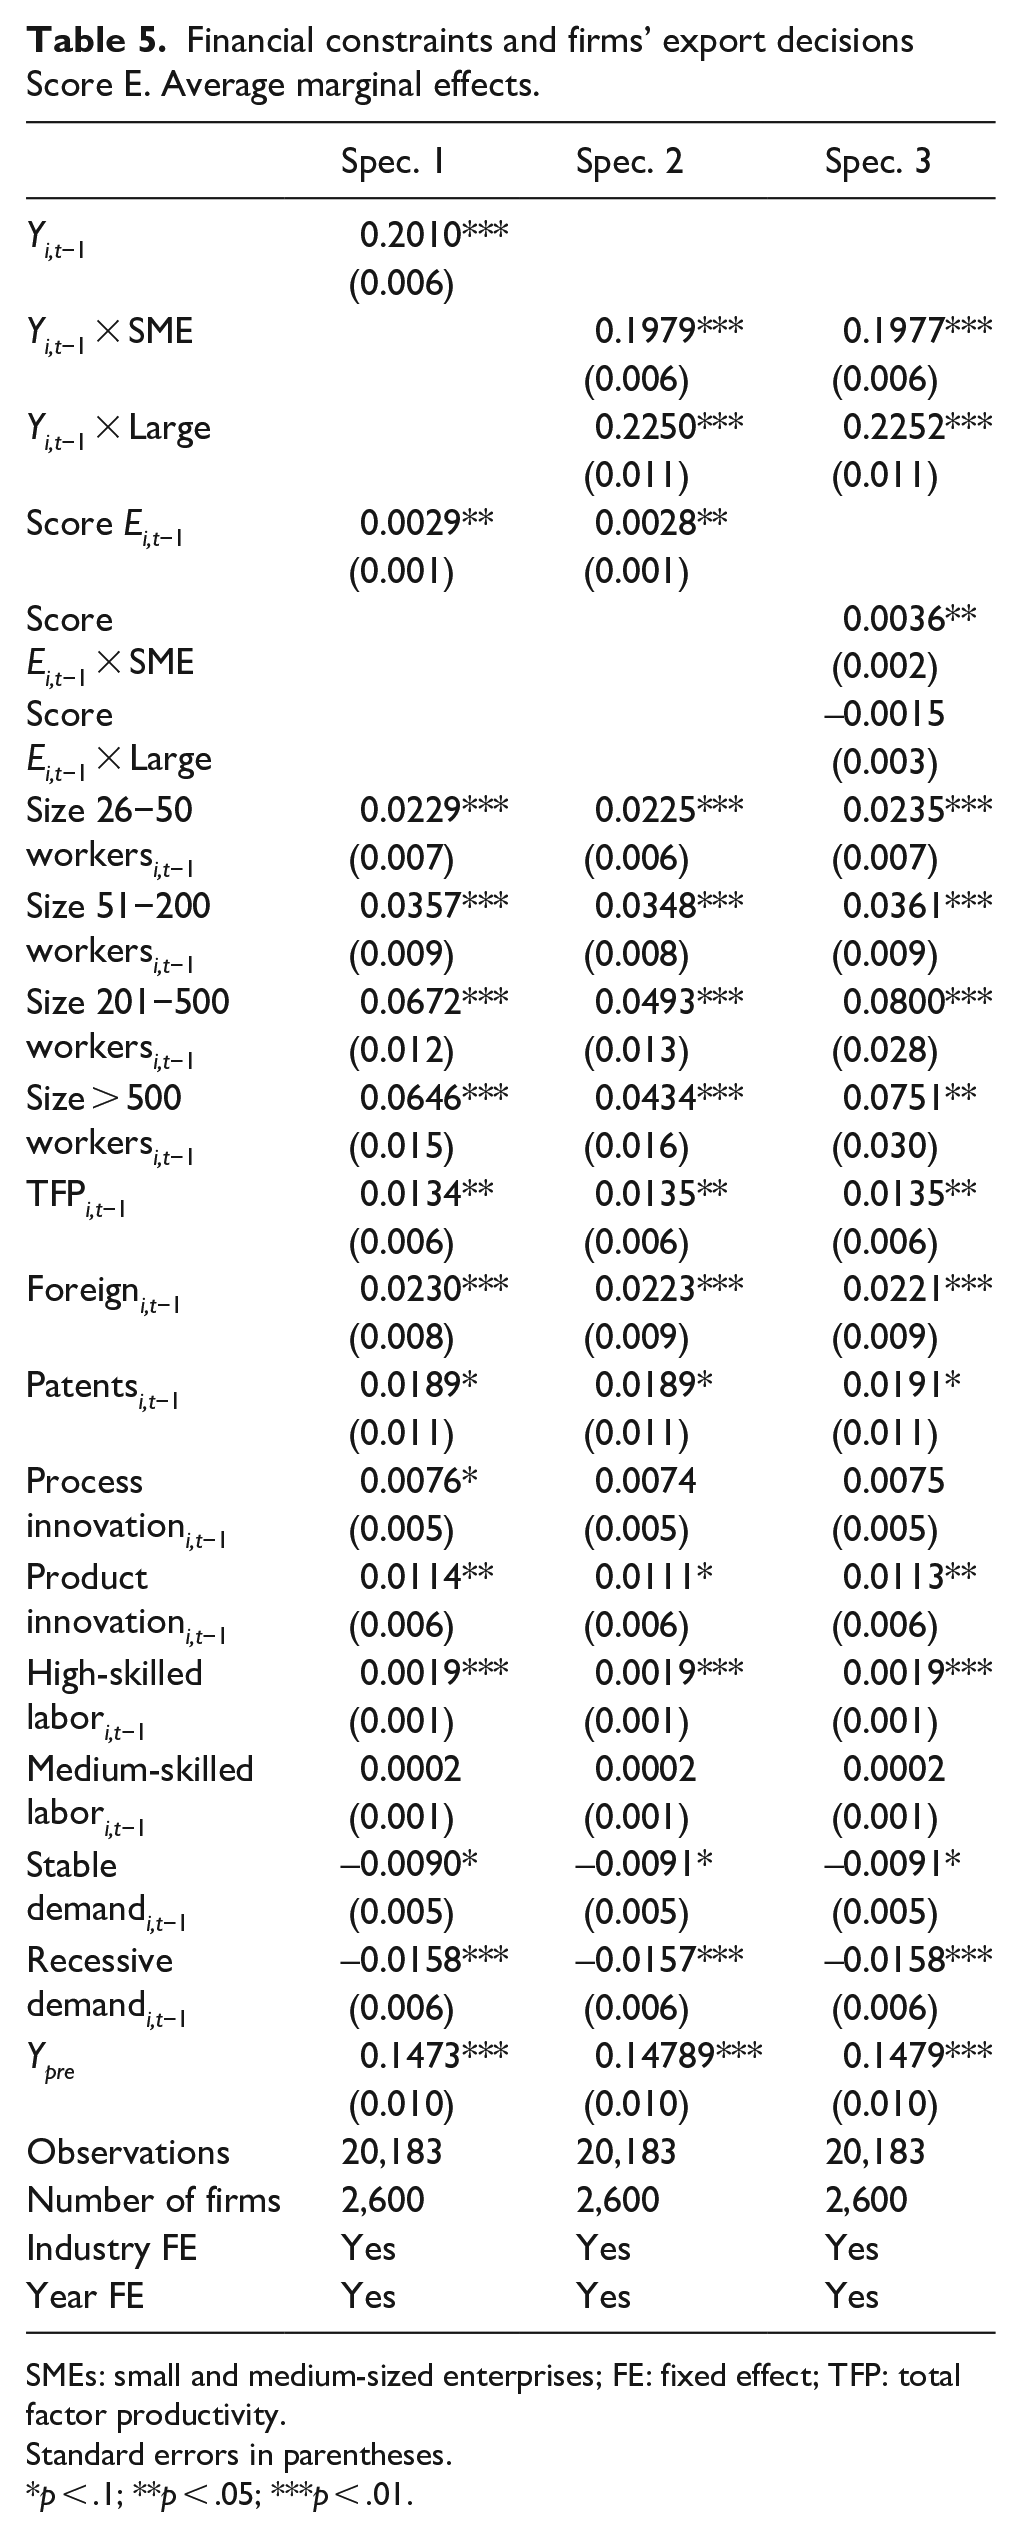
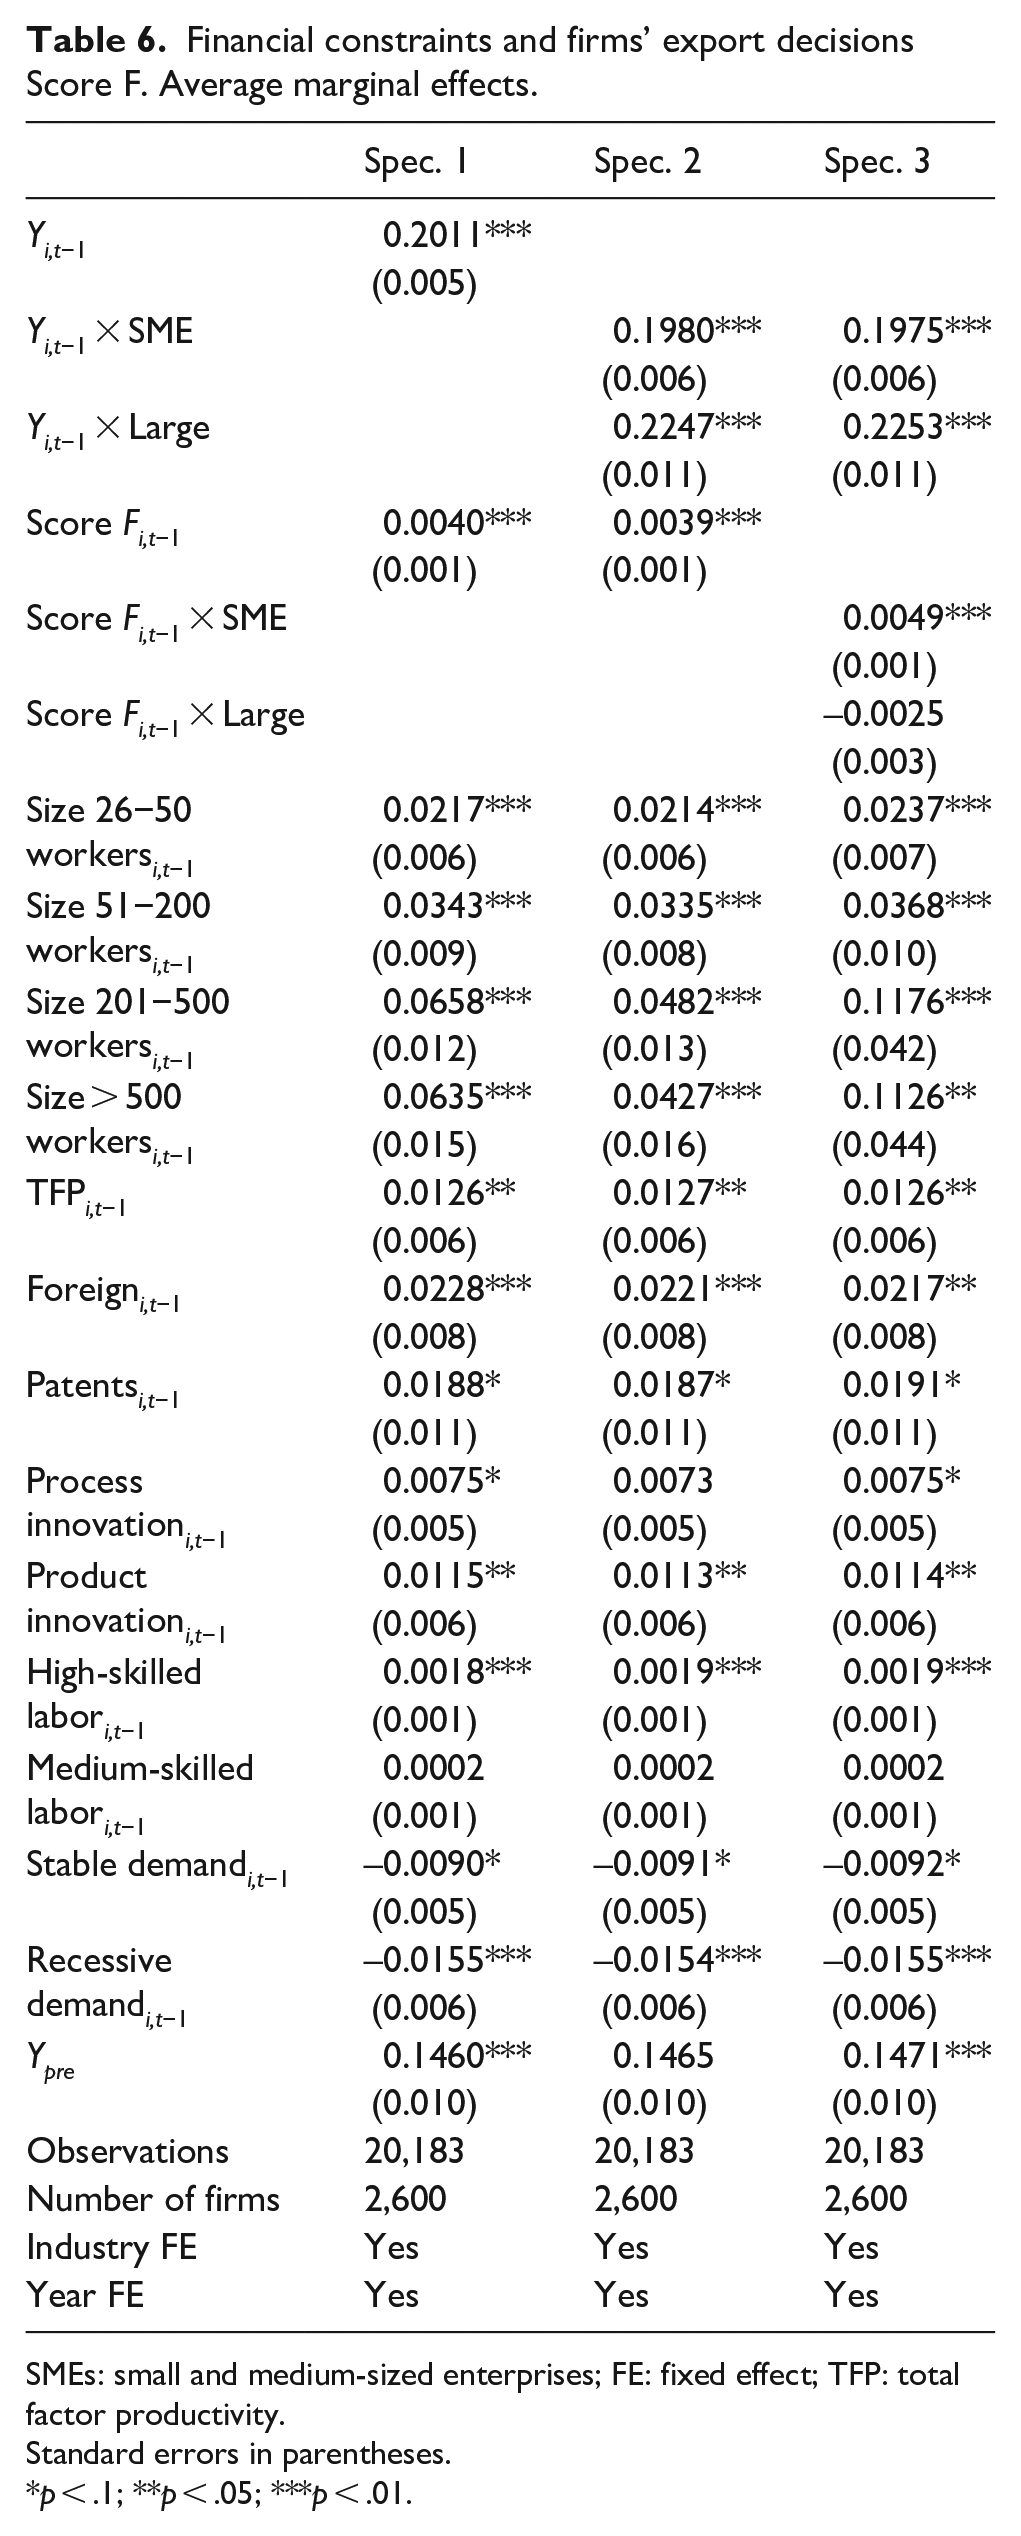
We estimate three different dynamic probit specifications for each of the two financial scores that sequentially embody additional characteristics in estimation. We aim to analyze both the role of financial constraints for the whole sample of firms and for the subgroups of SMEs and large firms. Results of estimations are shown in Tables 5 and 6, respectively. 26
Financial constraints and firms’ export decisions Score E. Average marginal effects.
SMEs: small and medium-sized enterprises; FE: fixed effect; TFP: total factor productivity.
Standard errors in parentheses.
p < .1;
p < .05;
p < .01.
Financial constraints and firms’ export decisions Score F. Average marginal effects.
SMEs: small and medium-sized enterprises; FE: fixed effect; TFP: total factor productivity.
Standard errors in parentheses.
p < .1;
p < .05;
p < .01.
In specification 1, we consider no differences in the effects of financial constraints and sunk costs for SMEs and large firms. The estimated average marginal effects both for Score E and Score F suggest that less financially constrained firms are more likely to export (the average marginal effects for Scores E and F are 0.0029 and 0.0040, respectively). Hence, an improvement in firm’s financial health given by one-point increase on the Score E (F) would increase the probability to export by 0.3 percentage points (0.4 percentage points). Furthermore, the positive and significant average marginal effect of Yi,t-1 confirms the importance of sunk costs as a determinant of firms’ export decision: exporting in period t–1 increases probability of exporting in t by 20 percentage points.
In specification 2, we allow the sunk cost effect to differ between SMEs and large firms but we still consider no differences in the effects of financial constraints between SMEs and large firms. With this aim, we introduce in estimations two additional variables resulting from crossing Yi,t–1 with a size group dummy (that distinguishes between firms with between 10 and 200 workers—SMEs—and firms with more than 200 workers—large firms). Namely, these two variables are Yi,t−1 × SME and Yi,t−1 × Large. Both in the estimations using Score E and F, the average marginal effects corresponding to the sunk cost effect for SMEs and large firms (Yi,t−1 × SME and Yi,t−1 × Large) are positive and significant (and quite similar in size regardless of the score used) confirming the importance of state dependence to explain firms’ export decisions. Furthermore, the sunk cost average marginal effect (0.225) corresponding to large firms is significantly higher than that corresponding to SMEs (0.198). 27 Thus, we can say that for large firms (SMEs) exporting in t–1 raises the probability of exporting in t by 22.5 (19.8) percentage points. Very likely, the higher sunk cost average marginal effect for large firms is related to the fact that large firms export at a larger scale, have their own international department, establish their own distribution networks, and so on (Bernard et al., 2009; Damijan et al., 2011; Eaton et al., 2007). As for the average marginal effects of the financial scores, they remain positive and significant and quite similar in size in comparison to specification 1 (average marginal effects for Scores E and F are 0.0028 and 0.0039, respectively). Therefore, they confirm that an improvement in financial health associated with one-point increase in Score E and Score F would increase the probability to export by 0.28 and 0.39 percentage points, respectively. Hence, less constrained firms are more likely to export.
Finally, in specification 3 we allow both sunk cost effects and the effects of financial constraints to differ between large firms and SMEs. Therefore, we incorporate to the variables in specification 2 the interactions between the financial score variables and the size group dummy (ScoreXi,t−1 × SME and ScoreXi,t−1 × Large for X = E, F). Interestingly, our estimation results, both when using Scores E and F, suggest that the intensity of financial constraints is relevant only for the export decisions of SMEs but not for that of large firms (in the estimations using Score E and Score F, the average marginal effect of ScoreEi,t−1 × SME and ScoreFi,t−1 × SME are 0.0036 and 0.0049, respectively). Thus, for SMEs, a one-point increase in financial health measured by Scores E and F would increase the probability of exporting by 0.36 and 0.49 percentage points, respectively. The estimates corresponding to the sunk cost effects confirm those obtained in specification 2, sunk costs of exporting are larger for large firms than for SMEs.
The estimates of our control variables are quite robust to the three specifications estimated. First, the role of persistence in exporting suggested by the positive and significant estimates of the lagged export decision variables (in the three specification) is reinforced by the positive and highly significant effect of the pre-sample means (capturing their permanent effect through firms’ individual effect). Second, we confirm that previously more productive firms self-select into exporting. A 10% increase in TFP increases the probability of exporting by 0.13 percentage points. 28 This increase in the probability of exporting is substantially smaller than that associated with one-point increase in Score E or F for SMEs (0.36 and 0.49 percentage points). Third, our results suggest the existence of a non-linear effect of firms’ size in the probability of exporting: the effect of firms’ size on exporting reaches a plateau with 200 workers, as we do not find significant differences among firms with more than 200 workers (the average marginal effects of Size 201−500 workersi,t−1 and Size > 500 workersi,t−1 are not significantly different in any estimation). Thus, using specification 3 and always taking as a reference firms employing less than 26 workers, for firms employing between 26 and 50 workers the probability of exporting is about 2.3 percentage points higher; for firms employing between 51 and 200 workers the probability of exporting is about 3.6 percentage points higher; and for firms employing more 200 workers the probability of exporting is about 7.5 percentage points higher in the estimation using Score E and 11 percentage points higher in the estimation using Score F. Fourth, being foreign participated increases the probability of exporting by 2 percentage points. Fifth, we confirm the importance of being innovative to participate in export markets. Thus, registering new patents, introducing process and product innovations raise the probability of exporting by 1.9, 0.75, and 1.1 percentage points, respectively. Sixth, facing a stable or a recessive demand would reduce the probability to export by about 0.9 and 1.6 percentage points, respectively (in comparison to firms that declare facing an expansive demand—omitted category). Finally, increasing the share of skilled workers has a very small but positive effect on the probability of exporting. Hence, a 10% increase in the share of high-skilled workers increases the probability of exporting by 0.02 percentage points. 29
All in all, after using two different scores to proxy for financial constraints, controlling for a rich vector of relevant firms’ characteristics, the dynamic nature of firms’ export decisions and firms’ fixed effects, we are quite confident in our results suggesting that financial constraints are a relevant determinant of SMEs export decisions. The fact that financial constraints do not seem to be a significant determinant of large firms’ export decisions suggests that the significant effect observed in the analysis for the whole sample of firms is driven by results for SMEs.
Export intensity and financial constraints
Empirical model
To analyze how firms’ financial health affects firms’ export intensity (defined as export over total sales), we estimate the following dynamic reduced-form equation

where EIit is the export intensity of firm i in period t. Our dynamic specification includes EIit–1 to capture persistence in firms’ export intensity. Score X (for X = E, F) is our financial health index; Zit-1 is a vector of control variables that may affect firms’ export intensity (including the same variables that in equation (4)); νt is a vector of year dummies and sj is a vector of industry dummies. Furthermore, there may exist unobserved factors affecting firms’ export intensity. For this reason, we assume that eit has two components, a firm-specific component ait and a transitory component (ηit), then eit = ai + ηit.
In the estimation of equation (5), we tackle two econometric issues. The first one is related to the fact that modeling export intensity requires to consider the possibility that exporters are not a random subset of all firms, but may have characteristics that are also linked to how intense their export activity is. We tackle this problem using a two-stage sample section procedure (Heckman, 1979). The first stage consists in calculating the Heckman’s lambda (λit) from the estimation of the export participation equation (equation (4)). 30 In the second stage, we include this term as an additional regressor in the estimation of equation (5). A significant estimate for λit in equation (5) would suggest the need of including it in the export intensity equation to avoid a sample selection bias. As an exclusion restriction, we work with pre-sample export experience and, thus, we do not include in the export intensity equation the pre-sample mean of the export decision (variable included in the estimation of equation (4)). As explained above in the estimation of equation (5), we account for possible dynamics effects including the first lag of export intensity. 31
The second econometric issue is related to the treatment of firms’ unobserved heterogeneity. Unobserved individual effects (ai) are correlated with regressors since by construction they are correlated to lagged export intensity (included as explanatory variable to capture export intensity persistence). As in our dynamic model of the decision of exporting (equation (4)), we control for correlated unobserved firms’ heterogeneity using the fixed effects approach proposed by Blundell et al. (1999, 2002). Following their approach, the pre-sample mean of the dependent variable (EIpre) are sufficient statistics for the unobserved firm effects (ai). Therefore, to control for unobserved heterogeneity, we add the pre-sample mean of the dependent variable as an additional explanatory variable in period t in the estimation of equation (5). Such as in the estimation of equation (4), we use as pre-sample period 1992–1994 and as some explanatory variables are lagged one period, we perform estimation for the period 1995–2014. Since estimation of equation (5) is restricted to the firms that declare positive exports, our estimation sample consists of 13,243 observations corresponding to 1,885 firms.
Estimation results
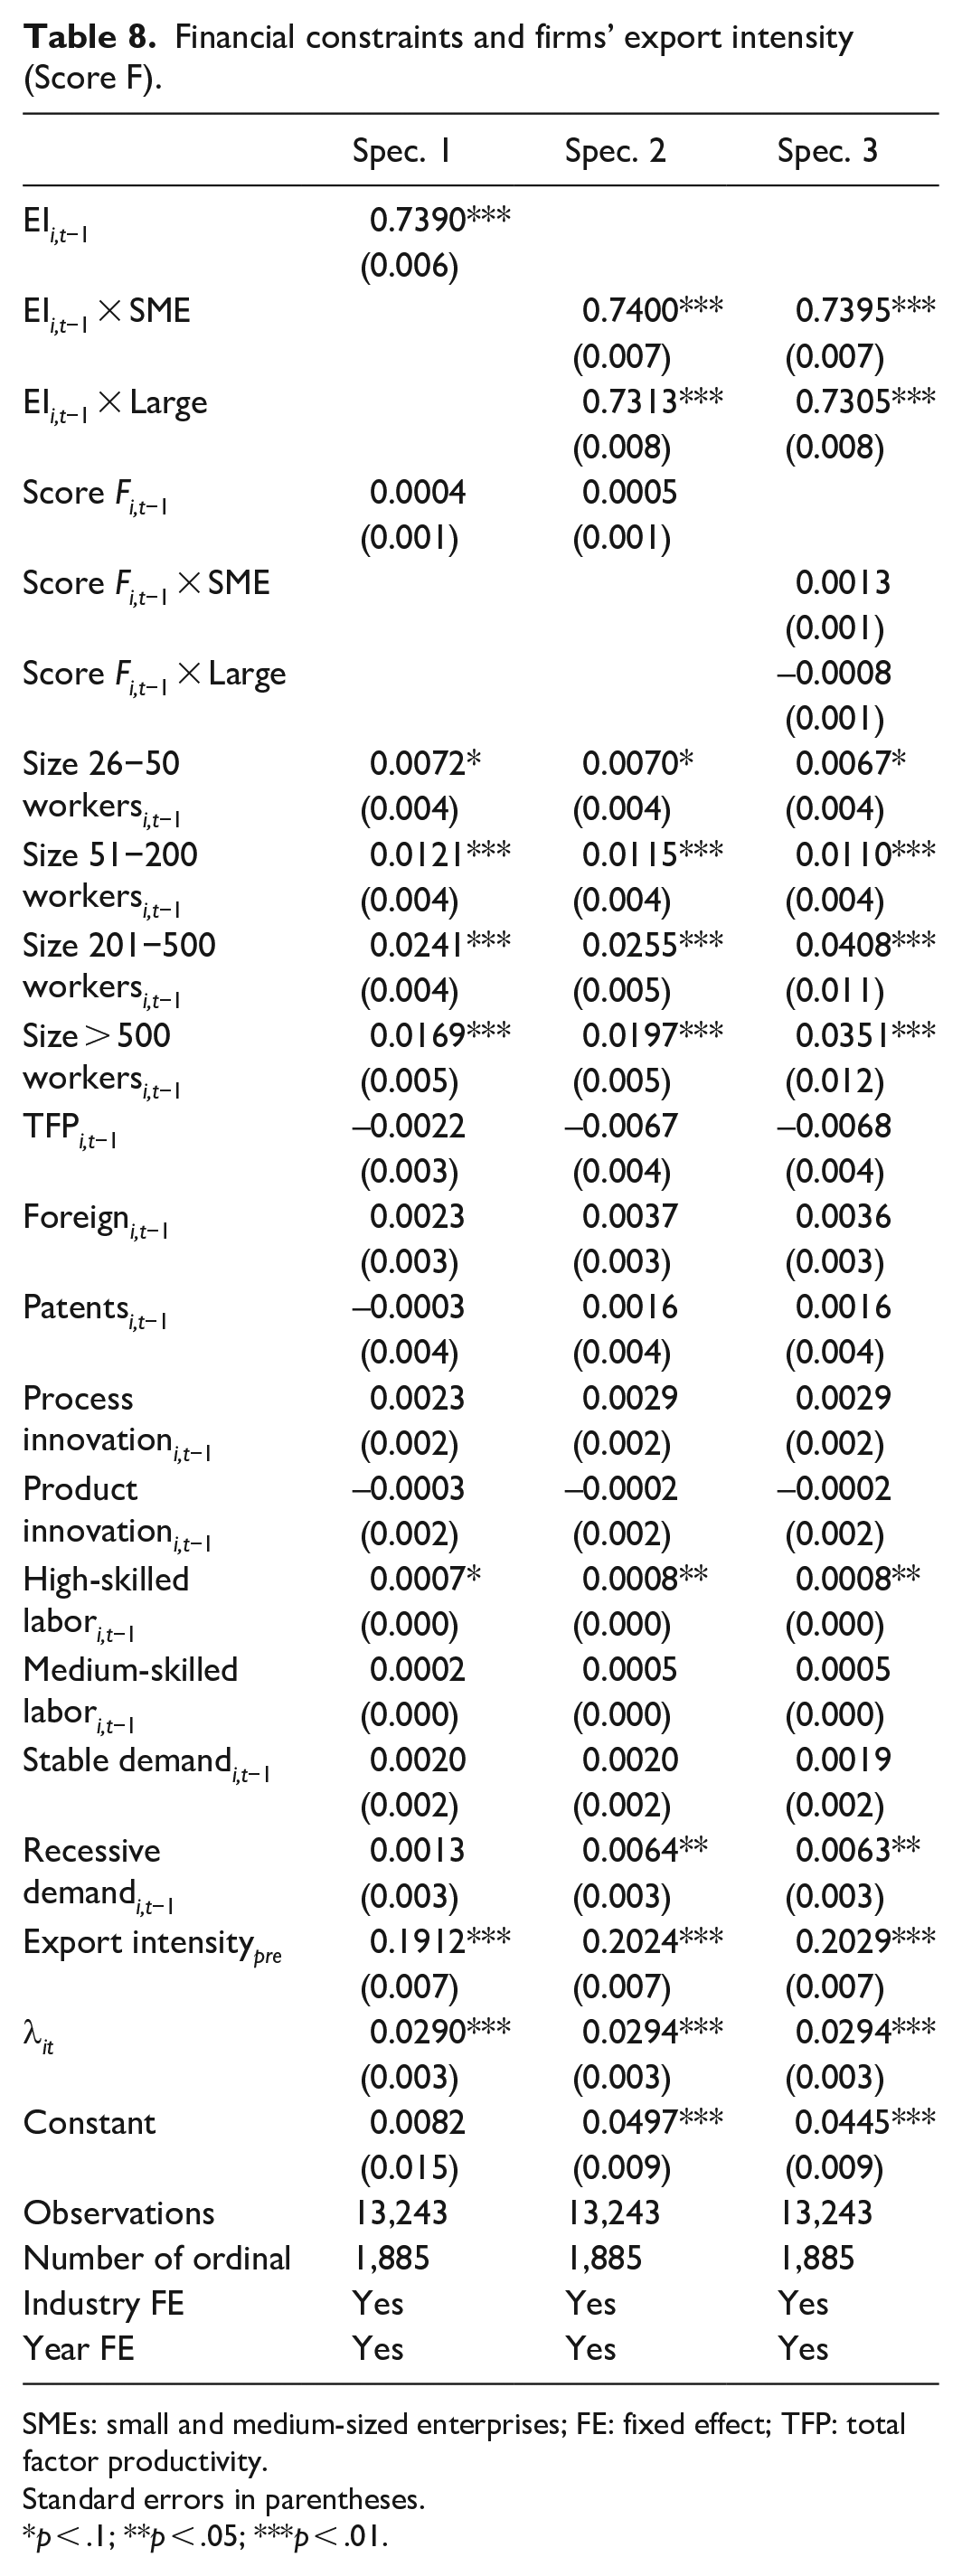
We show the estimates of equation (5) using Score E and Score F in Tables 7 and 8, respectively. 32 We estimate three different specifications of the export intensity equation (5) which correspond to the three specifications estimated for equation (4). In specification 1, we do not allow for differences in the effects of financial constraints and past export intensity for large firms and SMEs. In specification 2, we allow the effect of lagged export intensity to differ between large firms and SMEs, but not that of financial scores. Finally, in specification 3 we allow both the effect of lagged export intensity and financial health to differ between large firms and SMEs.
Financial constraints and firms’ export intensity (Score E).

SMEs: small and medium-sized enterprises; FE: fixed effect; TFP: total factor productivity.
Standard errors in parentheses.
p < .1;
p < .05;
p < .01.
Financial constraints and firms’ export intensity (Score F).
SMEs: small and medium-sized enterprises; FE: fixed effect; TFP: total factor productivity.
Standard errors in parentheses.
p < .1;
p < .05;
p < .01.
Regardless of the financial score used, a common result to all specification is that the estimate corresponding to the Heckman’s lambda is positive and significant. One can infer two implications from this result: first, the fact that the Heckman’s lambda is significant suggests the need of including it in the export intensity equation to avoid a sample selection bias; and, second, the positive sign suggests that the unobservables affecting firms’ likelihood of exporting are positively correlated with their export intensity.
As for the effects of financial health on export intensity, in specifications 1 and 2, the estimates both for Scores E and F are non-significant suggesting that when considering a unique effect for large firms and SMEs, financial health does not affect export intensity. Estimates of specification 3, in which we allow for different effects of financial constraints for large firms and SMEs, qualify this result. It is possible to observe in Table 7 that while the estimate of Score E for SMEs is positive and significant, for large firms it is non-significant. These estimates could be considered as evidence suggesting that financial health affects positively export intensity of SMEs but not that of large firms. Nevertheless, the fact that the estimates for Score F (see Table 8) are neither significant for large firms nor for SMEs casts some doubts on the existence of a possible positive effect of financial health on export intensity for SMEs but not for large firms. 33
The positive and significant estimates for lagged export intensity, in all specifications and regardless of whether we use Score E or Score F to proxy financial health, indicate that there exists a high degree of persistence (state dependence) in the evolution of export intensity. Furthermore, in specification 2 and 3, in which we allow the effect of lagged export intensity to differ between large firms and SMEs, the estimates corresponding to large firms and SMEs are not significantly different at any conventional level. 34
The estimates of our control variables are quite robust in the three specifications considered. First, the role of persistence in export intensity pointed out by the positive and significant estimate of lagged export intensity is confirmed by the positive and significant estimate for the pre-sample mean of export intensity. Second, unlike in the estimates corresponding to the export decision equation (equation (4)), we do not find a significant effect of productivity in export intensity. Third, our estimates confirm the existence of a non-linear effect of firm size on export intensity: export intensity of firms between 26 and 200 worker is higher than that of firms with less than 26 workers (the coefficients of Size 26–50 workersit–1 and Size 51–200 workersit–1 are not significantly different in most estimations); and, the highest export intensity corresponds to firms with more than 200 workers (the coefficients of Size 201–500 workersit–1 and Size > 500 workersit–1 are not significantly different in most estimations). Fourth, export intensity is higher for firms employing a higher percentage of high-skilled workers. Finally, the positive and significant estimated coefficient for the Recessive demand dummy (in Specification 2 and 3) suggest that firms facing bad demand conditions in its main market, that in most cases is the domestic market, are very likely reorienting sales toward international markets. 35
Summing up, our results suggest that, as observed when analyzing firms’ export decision, financial constraints are not significant determinants of large firms’ export intensity. Results on SMEs are not conclusive, while when using Score E financial restrictions seem to matter for SMEs export intensity, when using Score F financial health does not seem to have a significant effect on SMEs export intensity.
The decision to start exporting and financial constraints
Empirical model
Whereas in the previous section we analyze the role of financial health in the firms’ decision to export in year t regardless of whether the firm was exporting or not in year t–1, the next two sections are devoted to analyze the role of firm’s financial health upon two specific features of the export process: namely, the decision to start exporting and export persistence. The aim is to detect possible differential effects of firm’s financial constraints in the two choices.
Analogously to the empirical model analyzing firms’ decision to export, we consider that a firm decides to start exporting in year t whenever the increase in gross operating profits associated with export plus the discounted expected future returns from being an exporter in t exceed sunk costs. Whereas in the empirical model analyzing firms’ export decision in t, the existence of exporters and non-exporters in t–1 allows the identification of the sunk costs parameters (causing state dependence), when analyzing the decision to start exporting in t all the firms in our sample are non-exporters in t–1, and this precludes the identification of the sunk costs parameter. Within this framework, our empirical model of the probability of starting to export is specified in terms of a reduced-form set of variables capturing the payoffs associated to export, and so firms’ capabilities to push their expected profits above sunk entry costs into exporting. Among these variables, we pay special attention to the scores used to proxy firms’ financial health.
A key issue in this kind of analysis is the definition of export starters. We classify as an export starter in year t a firm that did not export between t–3 and t–1 and exported continuously between t and t + 2. Similar to International Study Group on Exports and Productivity (ISGEP) (2008), we require an export starter to export in t + 1 and t + 2 to avoid the problem of occasional exporters (firms that export by chance and most of times without any intentionality). 36 Analogously, we classify as non-exporters in year t those firms that do not export any year between t–3 and t + 2.
In econometric terms, we estimate a probit model in which the decision to start exporting in period t is conditioned on the previous vector of state variables for that year
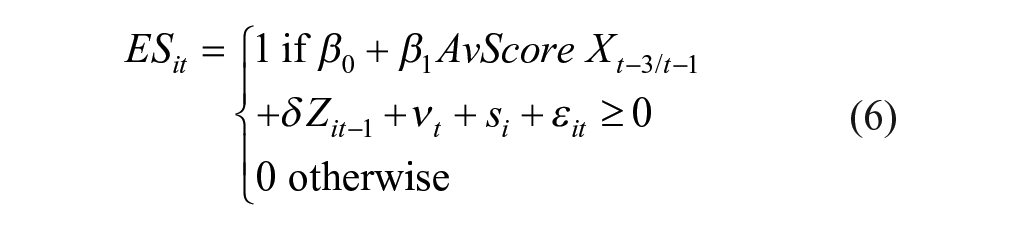
where the dependent variable ESit is dummy variable taking value 1 if the firm is an export starter in t (for t = 1995, . . ., 2012) and value 0 if the firm is a non-exporter in t. AvScoreXt−3/t−1 (for X = E, F) is the average value of Score X for the three previous years to the year in which the firm starts exporting; 37 and Zit is the vector of control variables (TFP, a set of firm size dummies, foreign capital participation, whether the firm introduces process and product innovations and register patents, proportion of skilled labor and demand conditions) that may affect firms’ expected returns from exporting; νt is a vector of entry cohort dummies and si is vector of industry dummies. εi is an error term with the standard properties in this type of models.
Table 9 shows the number of export starters for each entry cohort from 1995 to 2012. The total number of export starters is 238, 201 are SMEs and 37 are large firms. 38 The total number of observations in this analysis, that include the cohorts of export starters and non-exporters from 1995 to 2012, is 7,577.
Number of permanent export entrants by year.
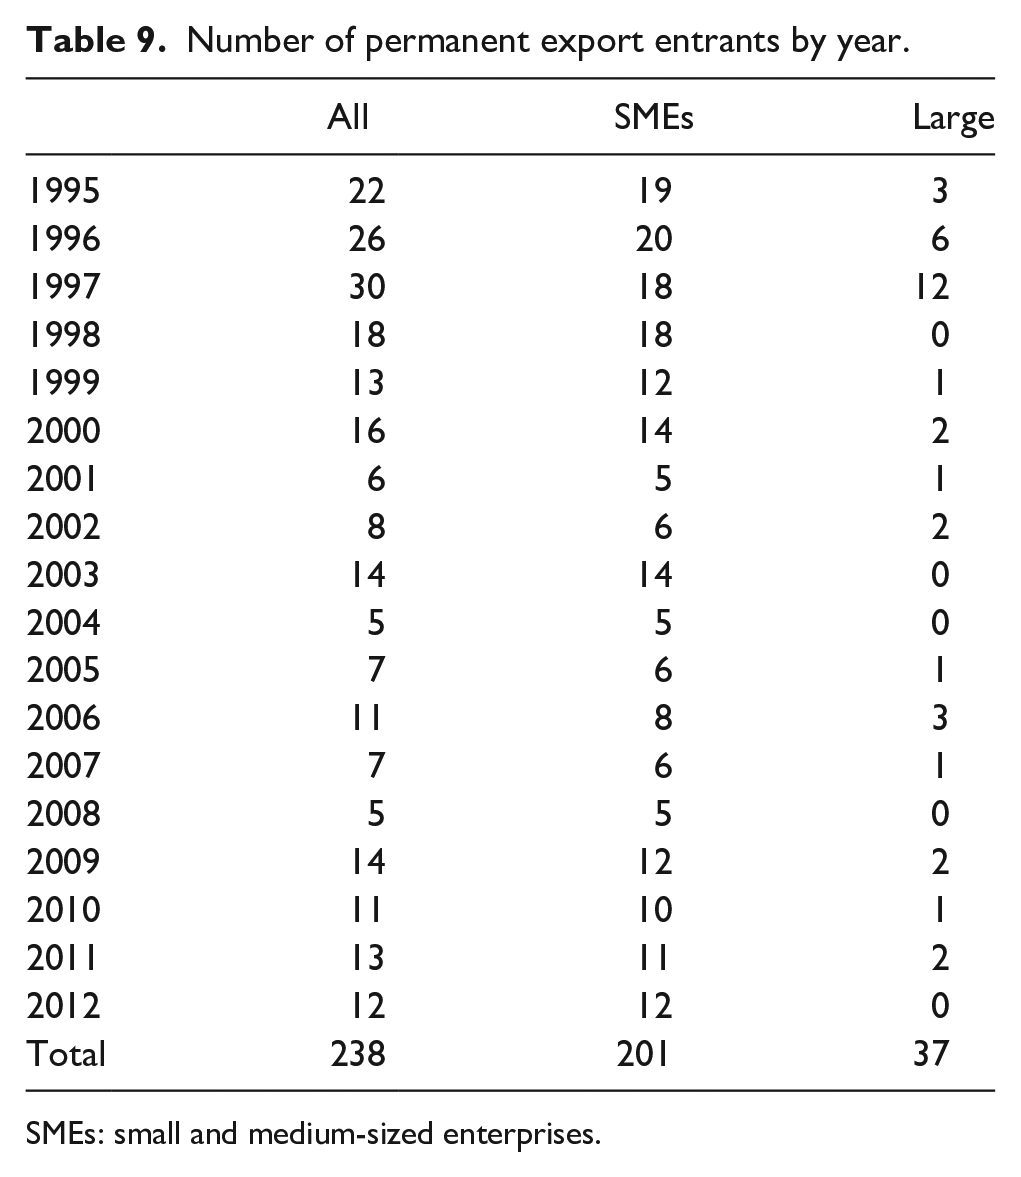
SMEs: small and medium-sized enterprises.
Estimation results
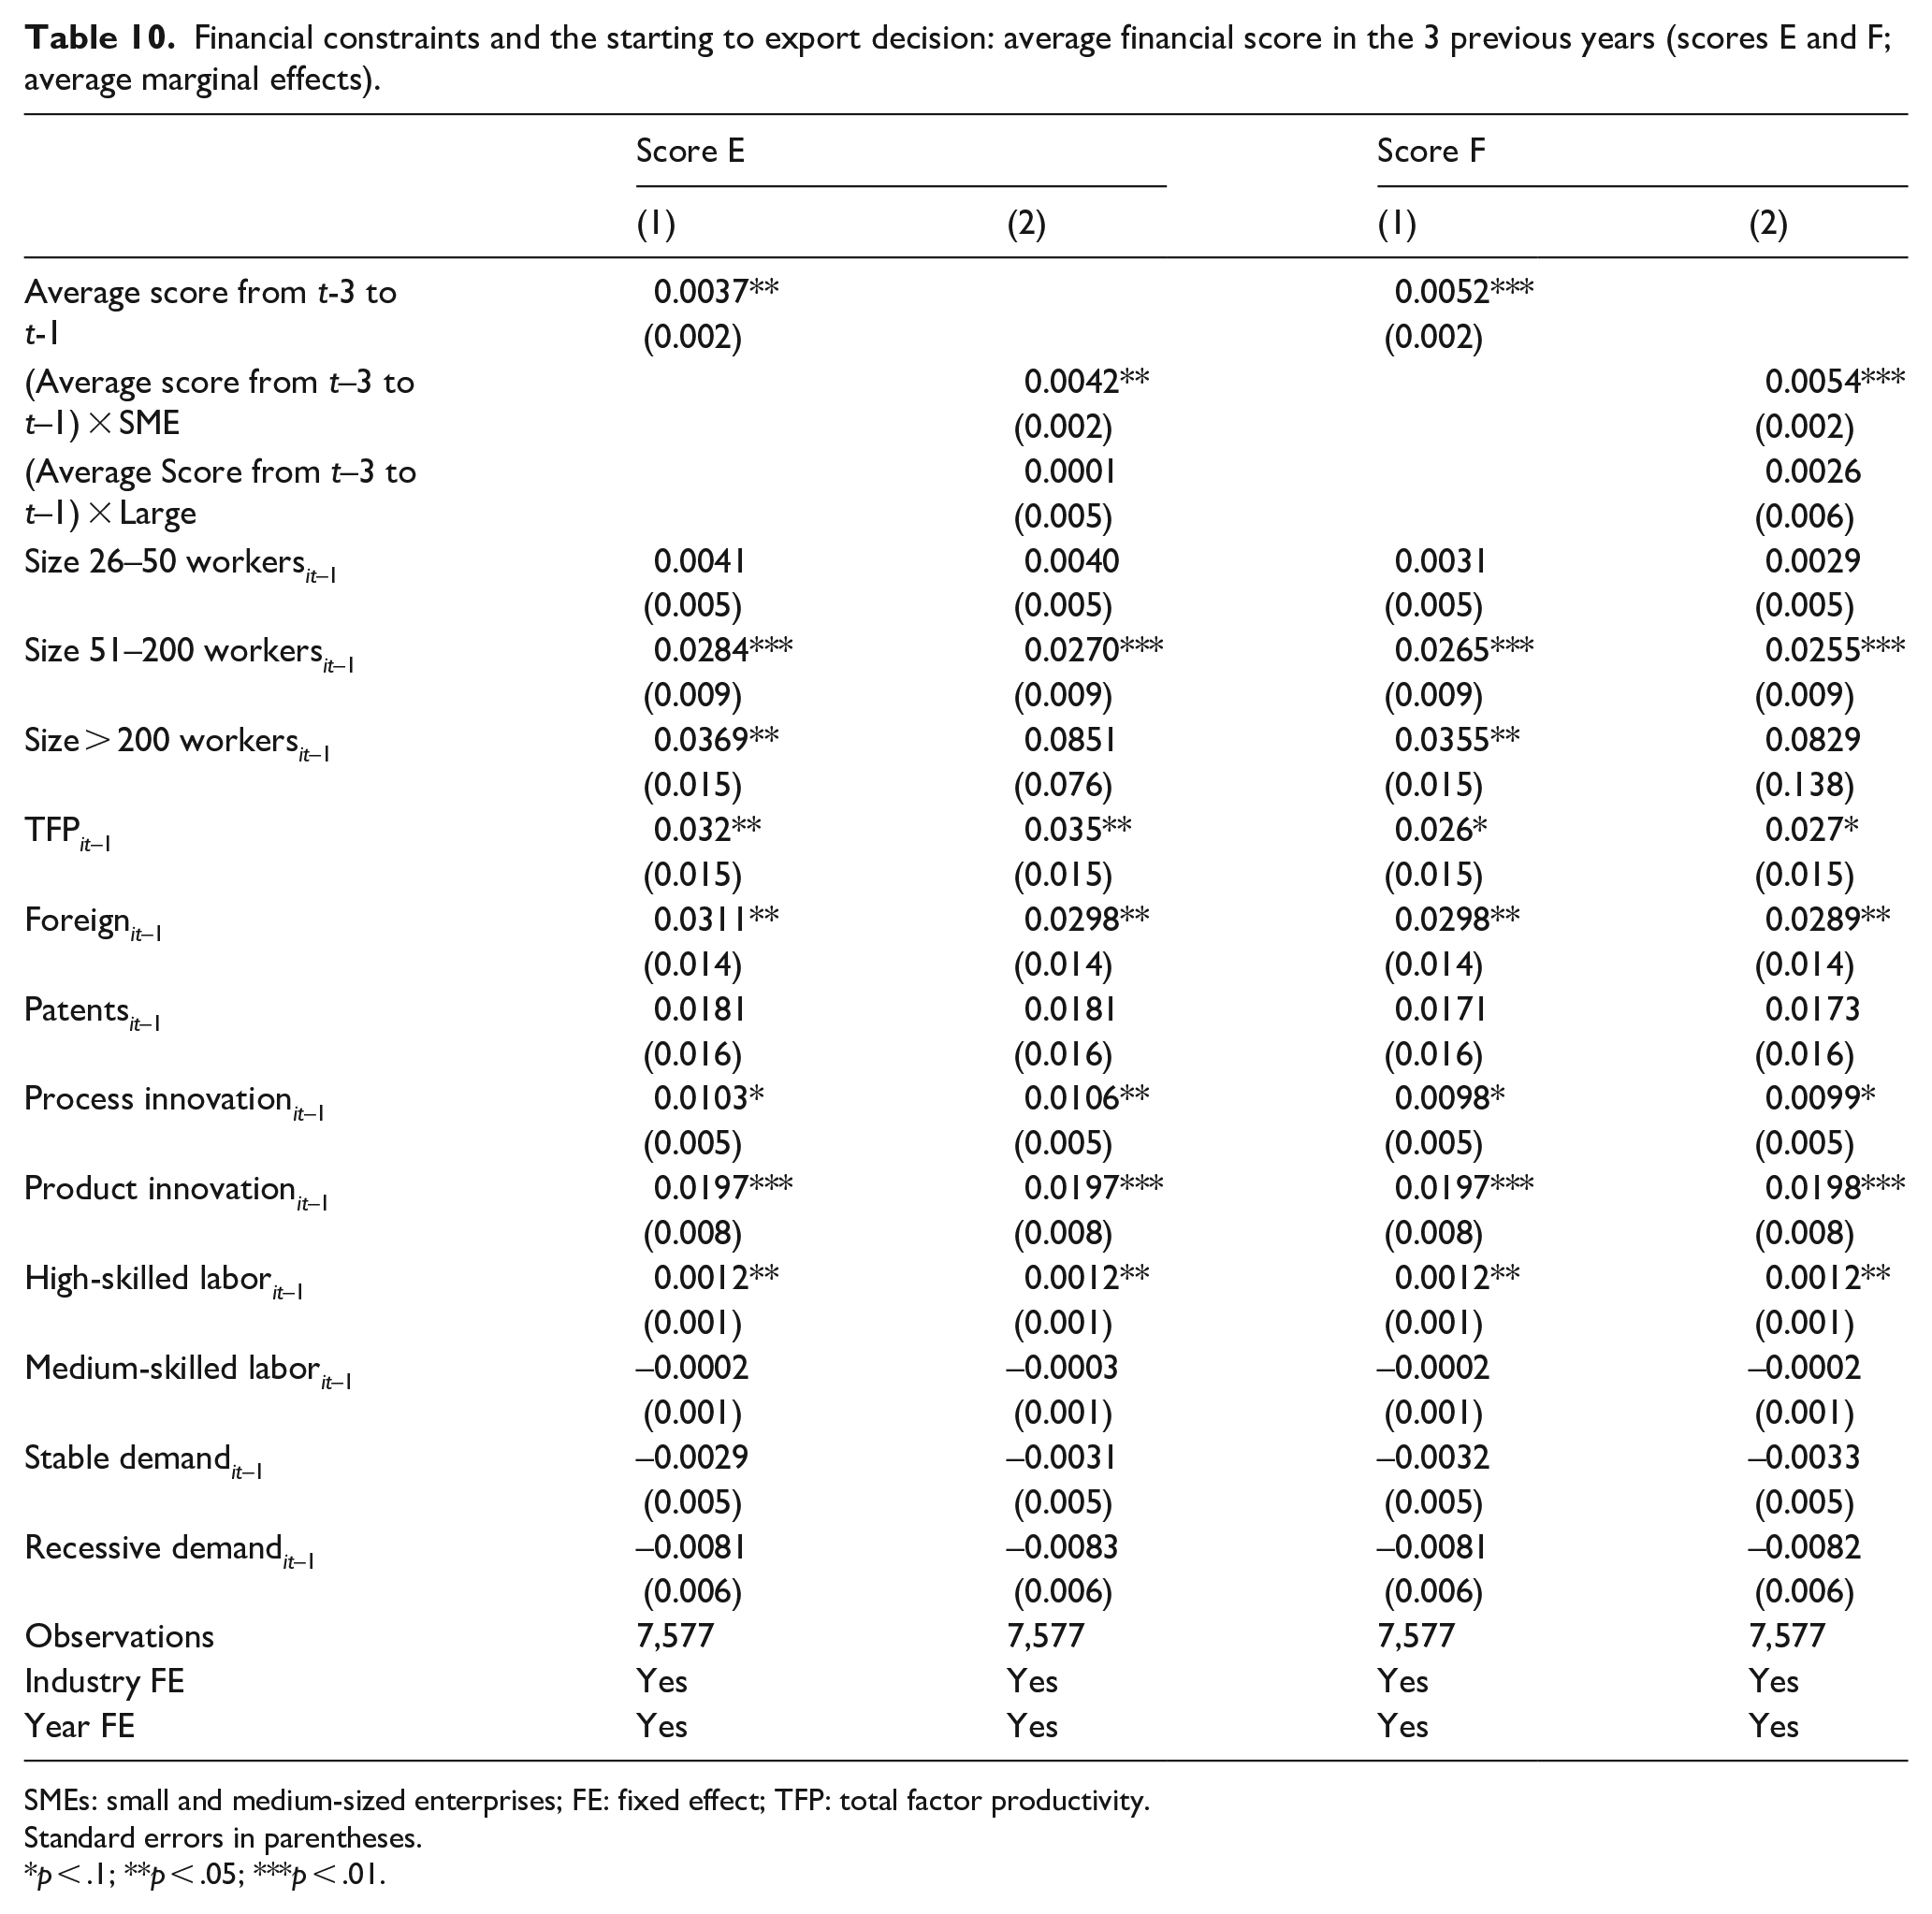
Table 10 presents the results of our estimations. Columns 1 and 3 (for Scores E and F, respectively) of this table show the estimation results when we consider that the effect of past financial health on the likelihood of starting to export is the same for large firms and SMEs. In Columns 2 and 4, we explore the possibility that the aforementioned effect might differ for large firms and SMEs. To explore this possibility, we widen our estimation equation to allow the past financial health variables to vary by firms’ size group. The results in Columns 1 and 3 suggest that for the full sample and regardless of the score used to measure financial constraints, firms with better past financial health are more likely to start exporting (the average marginal effects of Average Score from t–3 to t–1 both for Scores E and F are positive and significant). An upgrade in past financial health corresponding to one-point increase on Score E (F) would increase the probability of starting to export by 0.37 percentage points (0.52 percentage points). Estimation results in Columns 2 and 4 qualify these results. They suggest that past financial health is relevant to explain the decision of starting to export of SMEs, but it seems to be irrelevant for large firms. For SMEs a one-point increase in past financial health measured by Scores E and F would increase the probability of starting to export by 0.42 and 0.54 percentage points, respectively. Conversely, it would not have any effect in the probability of exporting for large firms (the average marginal effect corresponding to large firms is not significant). Therefore, the positive effect of past financial health in the probability of starting to export for the full sample is very likely explained by SMEs results.39,40
Financial constraints and the starting to export decision: average financial score in the 3 previous years (scores E and F; average marginal effects).
SMEs: small and medium-sized enterprises; FE: fixed effect; TFP: total factor productivity.
Standard errors in parentheses.
p < .1;
p < .05;
p < .01.
As regards the main results on our control variables, first, the positive and significant average marginal effect of the TFP variable confirms the widespread result of self-selection of the more productive firms into export markets (Melitz, 2003; Wagner, 2007, 2014a). Thus, a 10% increase in TFP raises by 0.26 to 0.32 percentage points the probability of starting to export (when using Scores F and E, respectively). This increase in the probability of starting to export is smaller than that provided for SMEs by one-point increase in Score E and Score F (0.42 points and 0.54 percentage points, respectively). Second, we confirm the importance of being innovative to participate in export markets, as having introduced process and product innovations in the past raises by 1 and 2 percentage points the probability to start exporting, respectively. Third, foreign capital participation raises the probability of starting to export by 3 percentage points. Fourth, the effect of size on the probability of starting to export gets diluted once we consider that the effect of past financial health might be different for SMEs and large firms. The only robust effect in all specifications is that for firms with a labor force between 51 and 200 workers, the probability of starting to exports is about 2.5–2.8 percentage points higher. 41 Finally, increasing the proportion of high-skilled workers has a very small effect on the probability of starting to export, that is, a 10% increase in the proportion of high-skilled labor raises the probability of starting to export 0.012 percentage points.
Consequently, our results suggest that measures addressed to alleviate the financial constraints faced by SMEs would contribute to ease their incorporation to international markets. Nevertheless, for large firms financial constraints does not seem to be an impediment to start exporting.
Financial constraints and export persistence
While in sections “Financial constraints and firms’ decisions of whether to export and export intensity” and “Financial constraints and export persistence” we analyze the role of financial health in the export decision and in the decision to start exporting, in this section we analyze the possible influence of firms’ financial constraints on export persistence. The importance of this analysis relies on the fact that if a country aims to be competitive in international markets is not enough with easing firms’ access to international market, it is also of crucial importance to ensure that these firms will persist in export markets. Therefore, it is as important to know how lowering the hedges that prevent incorporation to export market. It would help to design measures that could help to remove the impediments that prevent firms from persisting exporting.
Empirical model
We consider that a firm decides to continue exporting in year t whenever the increase in gross operating profits associated with export plus the discounted expected future returns from being an exporter in t exceed sunk costs. Both the fact that exporting involves sunk costs and the existence of a process of learning-by-exporting implies that firms’ current export choices depend on past export choices.
As already introduced in section “Financial constraints and firms’ decisions of whether to export and export intensity,” the presence of sunk costs associated with exporting is a driver of persistence in exporting because high sunk entry costs imply high exist costs where re-entry is possible (Bernard & Jensen, 2004; Esteve-Pérez et al., 2007). Furthermore, one should account for the fact that firms incur sunk costs not only the first year they start exporting. If firms are to continue exporting, they will have incurred each year outlays related to the adaptation of products to changing market conditions, changes in the marketing and distribution channel, and so on. Very likely, these outlays involve, at least partially, sunk cost. As accumulated sunk cost rise, re-entry is increasing costly and so firms are less likely to stop exporting. Learning-by-exporting is related to the fact that exporters may exhibit efficiency gains from economies of scale, knowledge from foreign customers, and from increased competition forcing them to become more efficient. Nevertheless, it is important to note that learning can play a role not only in terms of firm performance but also in terms of its persistence exporting. Timoshenko (2015) shows that exporting experience acquired by continuous exporters brings forth continuing exporting. The rationale behind this result is quite simple, experienced exporters have learned more from operating in foreign markets than less experienced exporters, and thus, the profitability obtained in a given market increases with the extent of exporting experience. Therefore, learning-by-exporting induces exporting persistence. 42 We expect that both the existence of sunk costs associated with exporting and learning-by-exporting will induce negative duration dependence, that is, we expect the probability that a firm quits exporting to decrease with the number of years of continuous exporting.
The best suited models to analyze persistence in exporting are the survival models. They allow to capture both the vintage effects associated with sunk costs and learning-by-exporting and the effects of other variables that might affect export profitability and so the probability of continuing exporting. The unit of observation in this study will be the firm export spell. We define an export spell as a period of uninterrupted engagement in exporting, that is, the number of consecutive years of exporting. A spell is considered as starting in year t if the firm did not export in year t–1 but exports in year t. Analogously, a spell is computed to end in year T when this is the first year in which the firm declares not exporting, after one or more consecutive years exporting. Thus, in this article, persistence in exporting is measured by the extent of continuous engagement in exporting, so that the length of an exporting spell captures persistence in exporting. In order to examine the role of firms’ financial constraints in the duration of exporting spells (spell survival), we undertake a multivariate analysis in which in addition to our financial constraints variable we include a vector of control variables affecting firms’ exporting profitability and, therefore, the likelihood of continuing exporting. In particular, we implement a discrete time proportional hazard model in which the duration of exports spells is treated as a discrete variable, not because it is intrinsically discrete but because data are available on a yearly basis (interval-censored data). Although the underlying transition process between exporting and not exporting may happen in a continuous way, we only observe these transitions annually. These estimation methods allow for a flexible specification of the baseline hazard and to control for firms’ exports spells unobserved heterogeneity, which help to identify the role of firms’ financial constraints in exports persistence.
Therefore, we estimate the discrete time representation of the following underlying continuous time proportional hazard function

where
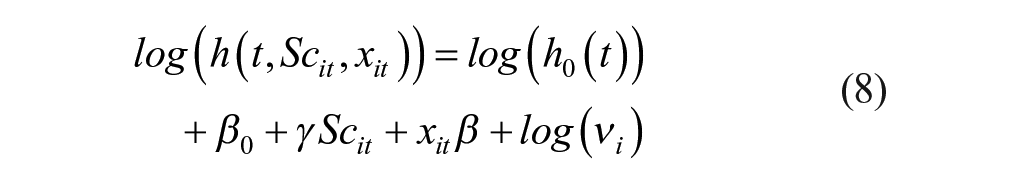
In equation (8), it is possible to observe that the baseline hazard
The dependent variable of the survival model that we use to analyze export persistence is not measured directly in terms of number of years of continuous exporting but consists of a binary variable taking value 1 for the survival period in which the firm exit from export markets and 0 as long as it remains exporting.
There are two important issues that should be considered when building this binary variable. First, one should consider the existence of right-censored exporting spells, that is, exporting spells that continue in operation the last year of our sample. For right-censored spells our binary dependent variable takes value 0 for all the survival years. Second, our data allow us to distinguish whether an export spell terminates because the firm stops exporting or as a result of firm failure. Treating those export spells that end as a result of firm failure as completed spells (and changing the value of our binary dependent variable to one the last survival year they are observed) would imply assuming that the underlying process driving export duration is the same than that driving firm survival. To avoid this problem, we will consider these spells as right-censored, what amount to explicitly acknowledging that the drivers of export persistence differ from those determining firm survival.
Data specificities and some descriptive statistics
There is a particular feature of the ESEE that makes this dataset especially suitable to analyze the role of financial constraints on firms’ persistence in exporting, using survival methods. It is that the survey allows identifying firms that export in a continuous way, quit exporting or stop answering during the follow-up period under analysis (1992–2014).
After cleansing the data, our working sample for the export persistence analysis consists of 23,673 observations corresponding to 3,826 exporting spells by 3,316 firms. Regarding SMEs, our working sample is composed of 13,651 observations, corresponding to 2,590 exporting spells by 2,238 firms. Out of these SMEs, 1,947 (87%) experience only one exporting spell. As for large firms, our working sample is 10,022 observations corresponding to 1,236 exporting spells by 1,078 firms. Out of these firms, 938 (87%) experience only one exporting spell.
In order to get a first hint of the relevance of financial health as a determinant of export persistence, we show in the four panels of Figure 1 the Kaplan–Meier estimates of the empirical survival functions of SMEs and large firms with different degrees of financial constraints. In particular, using as starting point our financial scores, we classify firms in three groups according to the tercile of the score distribution they belong to: first tercile, low financial health; second tercile, med financial health, and third tercile, high financial health. It is important to recall that our financial scores were built in such a way that larger values of the financial scores imply better financial health (and so softer financial constraints).
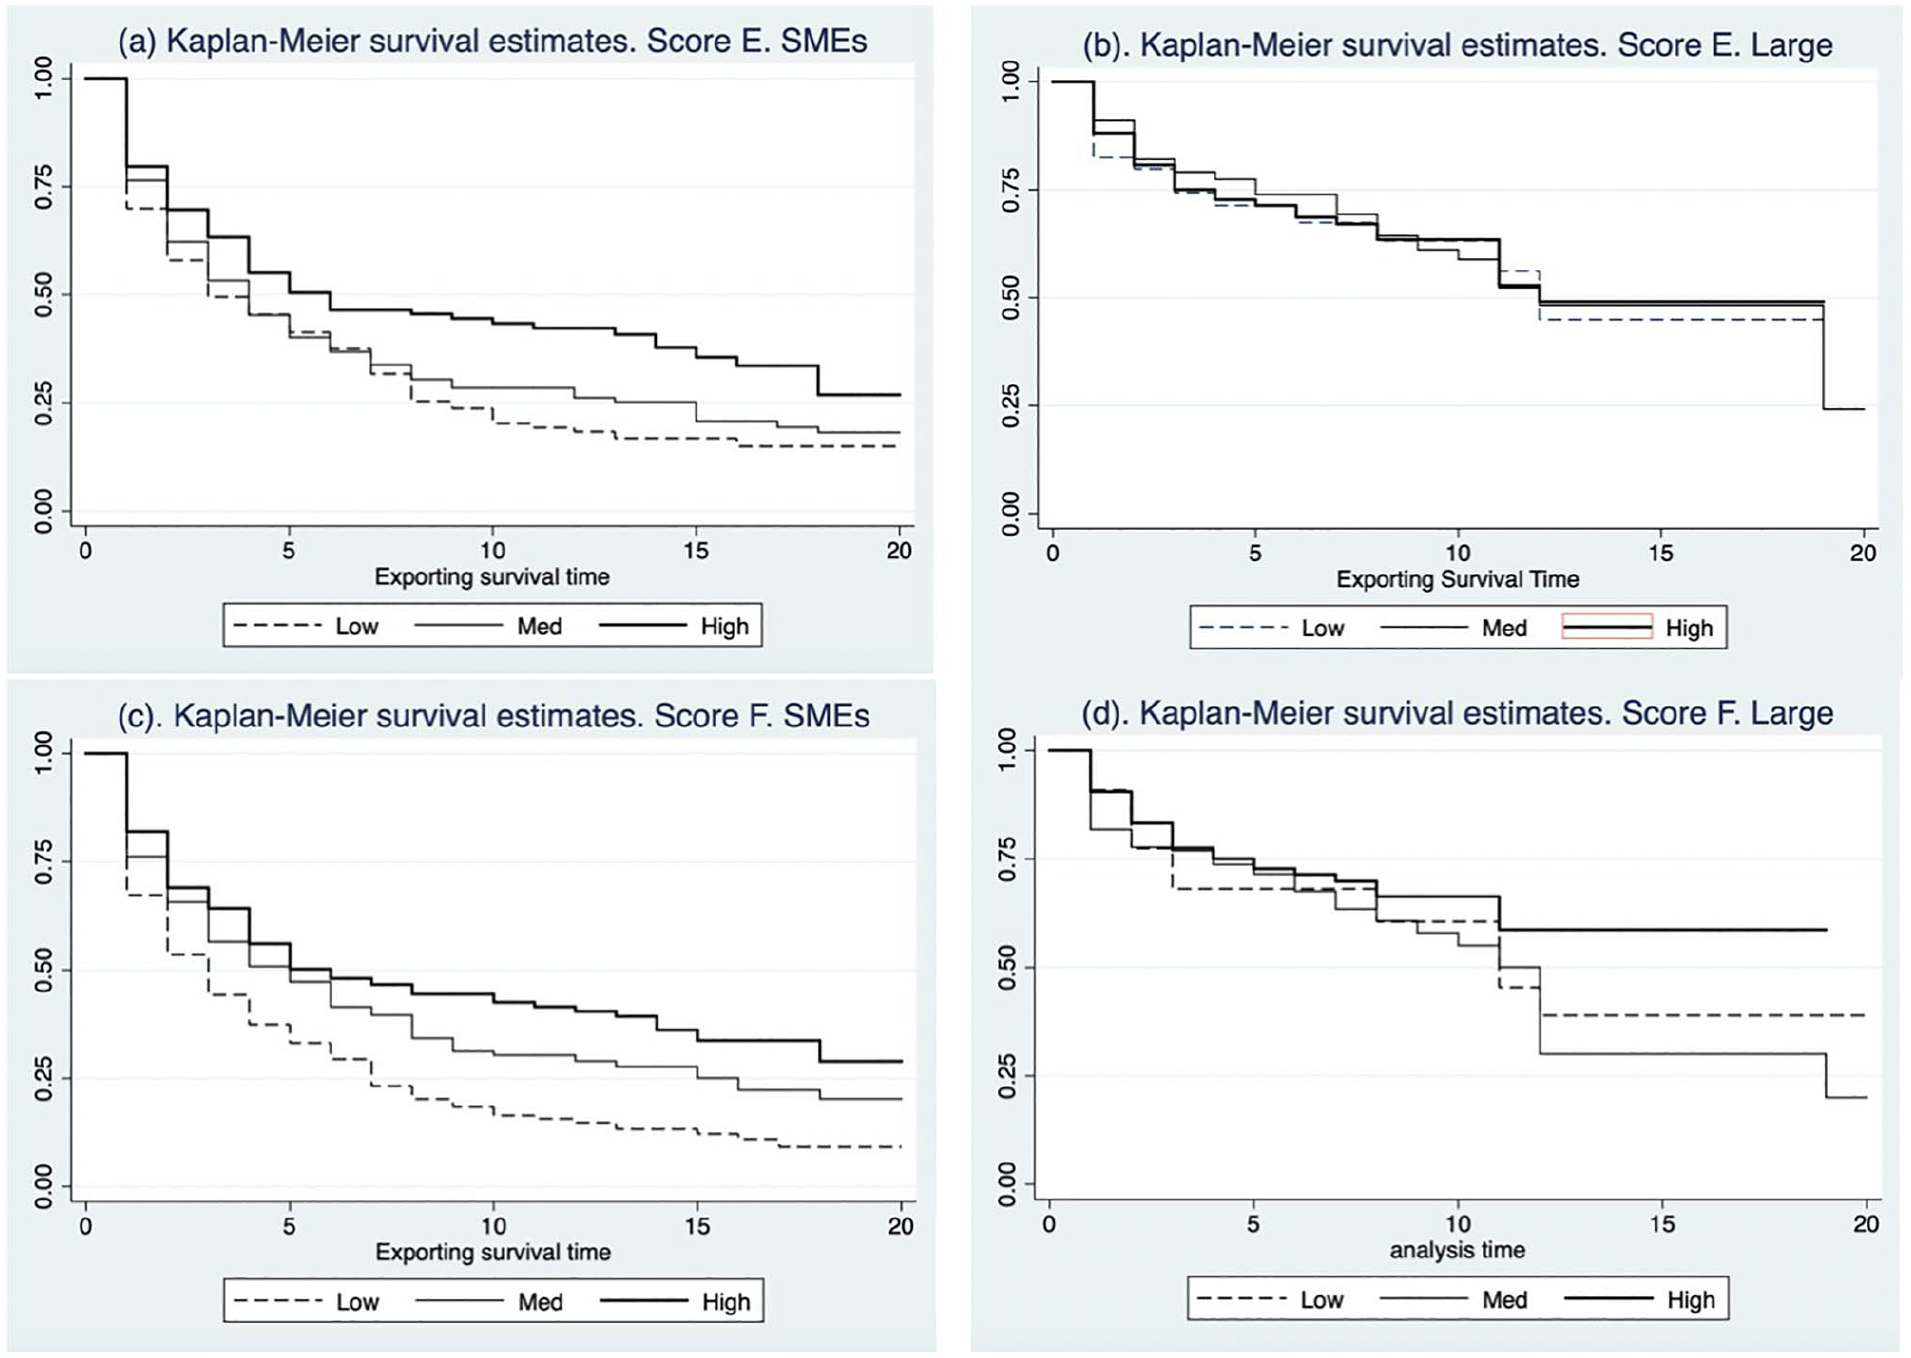
Kaplan–Meier empirical survival functions.
Figure 1 (panels (a) and (c)) shows that independently of whether we use Score E or Score F to measure financial constraints, the empirical survival function of the SMEs in the high group is for most of exporting survival time above that of SMEs in the med group, and this above the one corresponding to firms in the low group. This reveals much stronger persistence in exporting for less financially constrained SMEs. Thus, the median duration of exporting spells of firms classified in the low, med, and high groups are for the analysis using Score E (Score F) 3(3), 4(5), and 6(6) years, respectively. Furthermore, a log-rank test for equality of the survival functions rejects the null of equality of the survival functions at any conventional level of significance (for Score E χ2(2) = 14.55 with p-value = .001; for Score F χ2(2) = 33.04 with p-value = .000). The scenario depicted for large firms by panels (b) and (d) of Figure 1 is completely different, there is not a clear pattern about which group survival function is above the others. Thus, the log-rank tests of equality of survival functions do not reject the null either for score E or F (for the analysis using Score E the value of the χ2 statistic is 0.03 and the corresponding p-value = .983; for the analysis using Score F, the χ2 statistic is 2.36 and the corresponding p-value = .307). Therefore, the empirical survival functions (that do not account either for observed or unobserved heterogeneity) do not detect any difference between the export persistence of large firms that differ in their financial health.
Empirical results
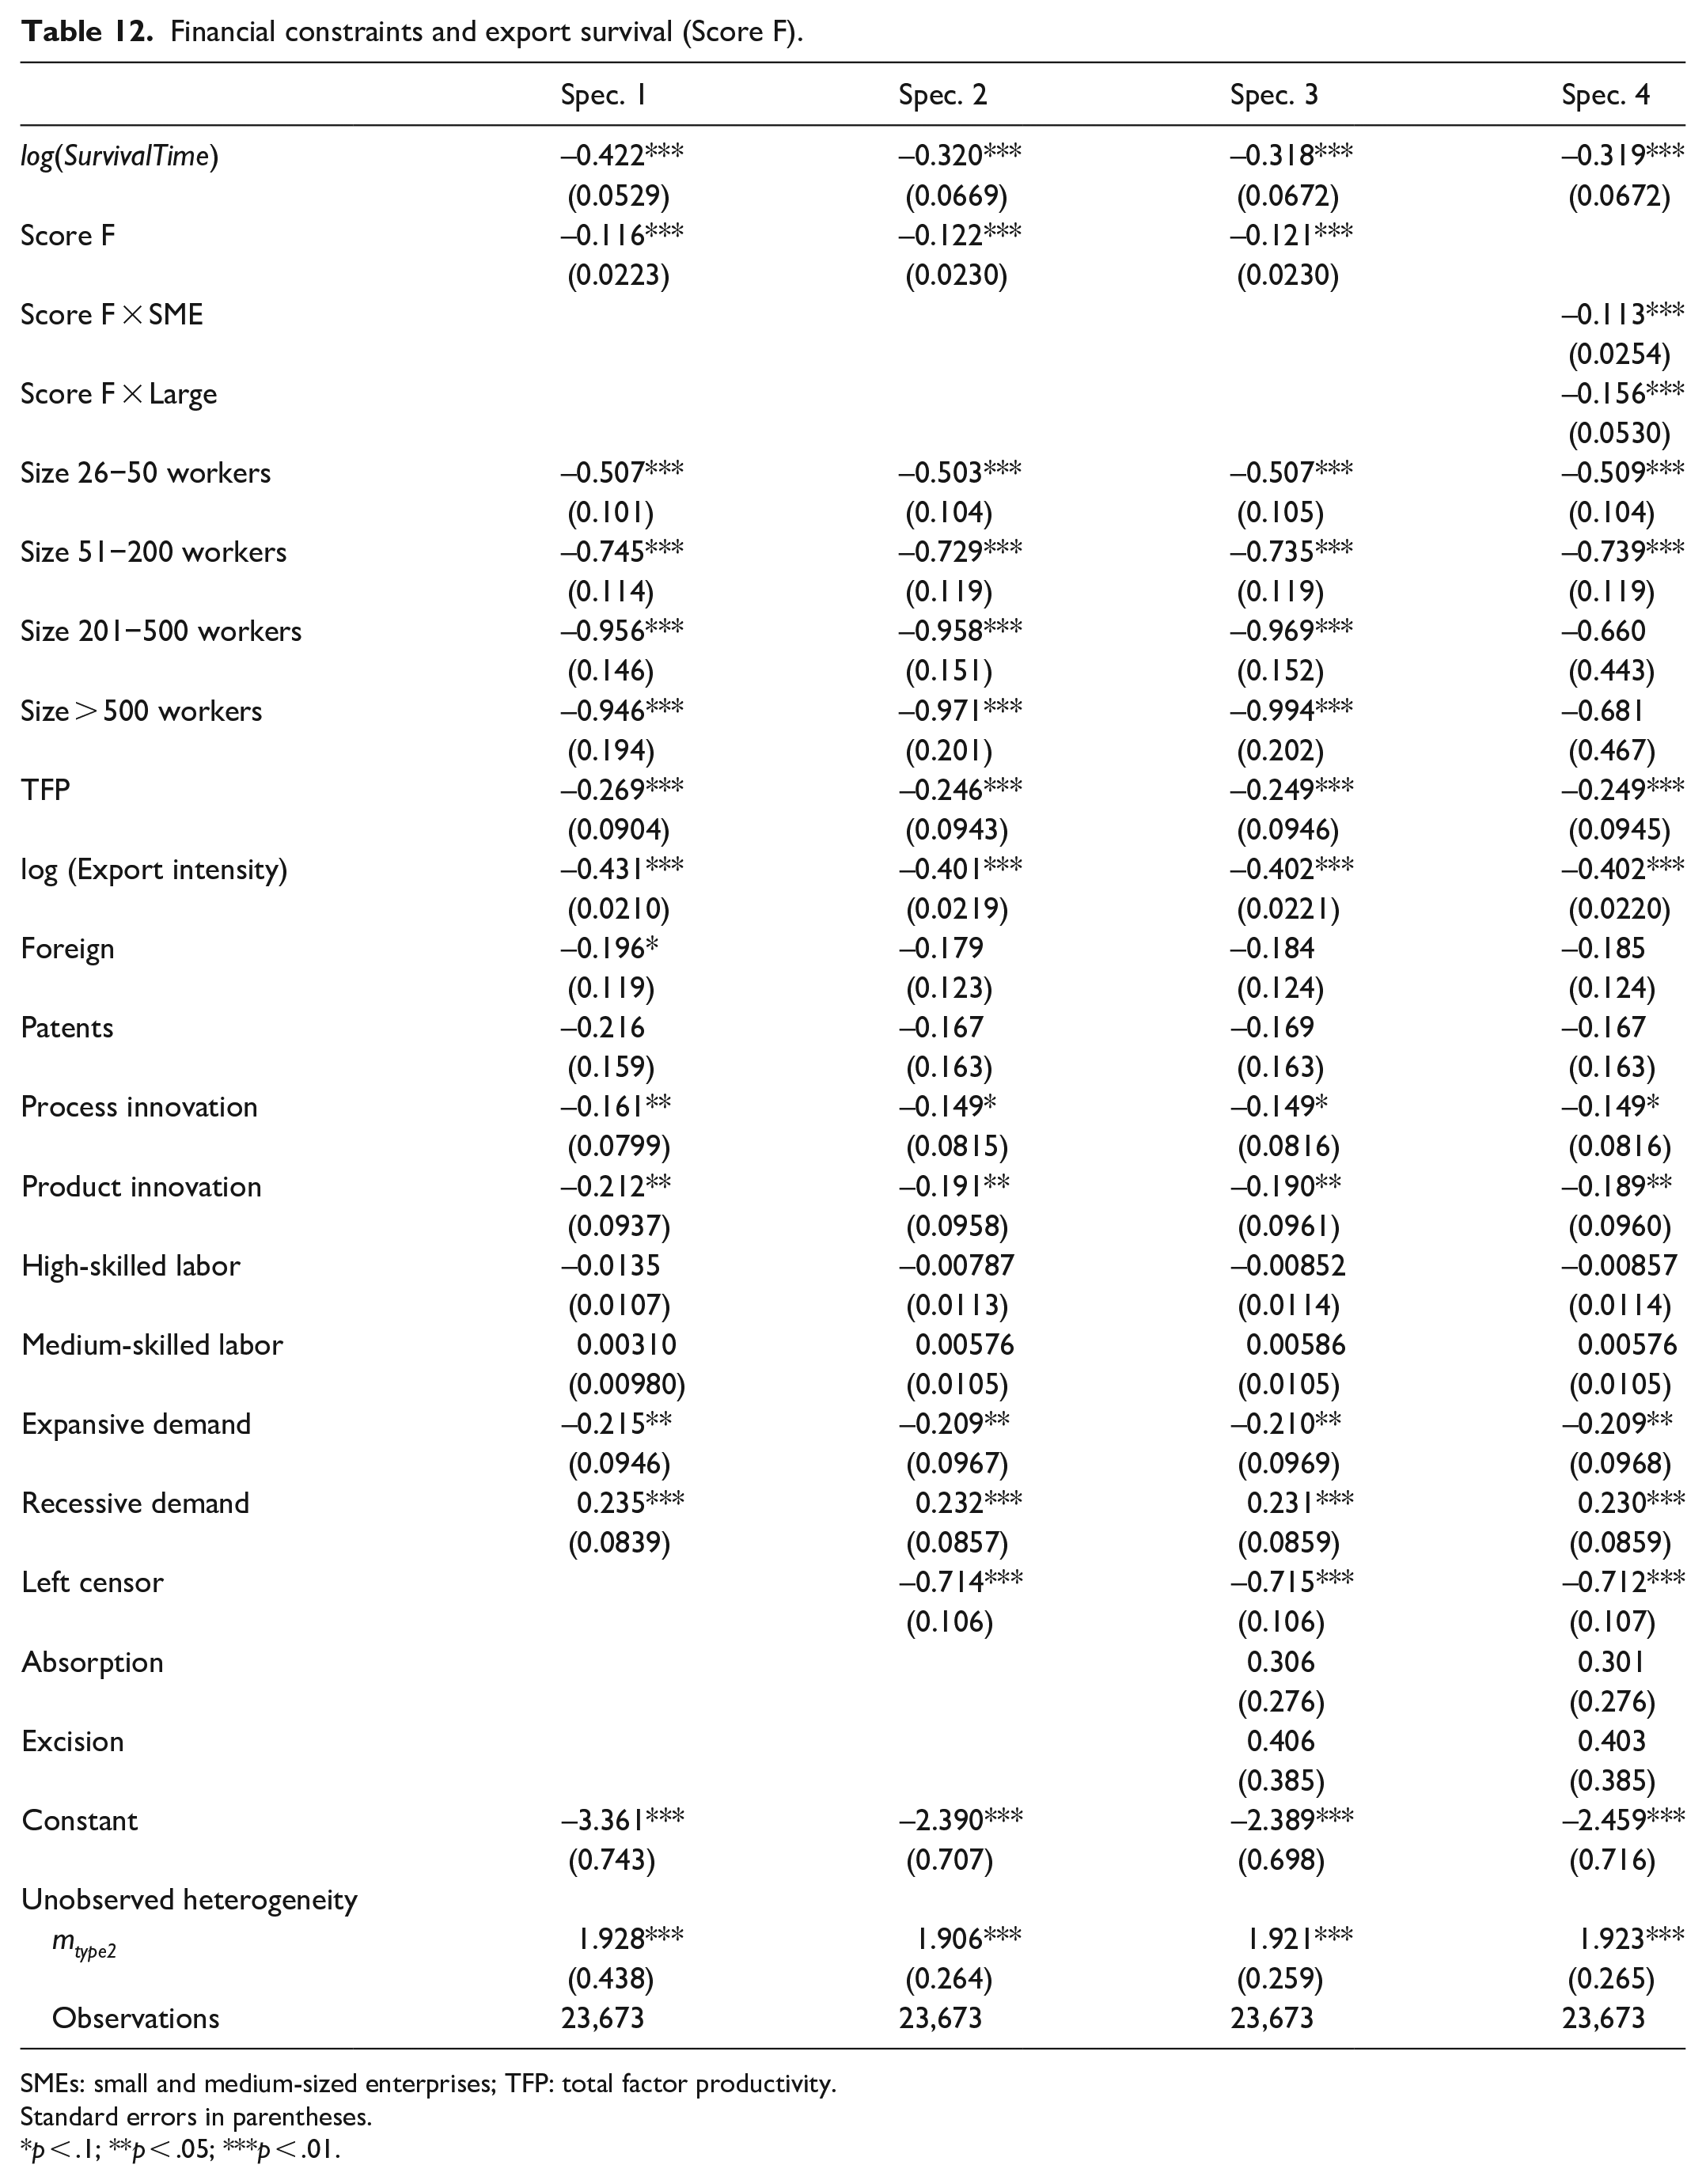
The next step is to discuss the results we obtain in the multivariate survival analysis. Tables 11 and 12 (for Scores E and F, respectively) show four different specifications of the discrete time proportional model in equation (7). 45 Estimated coefficients in these tables represent the effect of the covariates on the hazard of termination of the export spell. Negative coefficients should be interpreted as a decrease in the hazard (i.e., increase in the expected duration of the export spell). Conversely, positive coefficients should be interpreted as in increase in the hazard (i.e., a decrease in the expected duration of the spell). Special attention should be paid to the interpretation of the estimated coefficients corresponding to the financial scores. Recall that higher values of the scores imply better financial health (i.e., softer financial constraints). Therefore, if as expected the sign of the estimates for the financial scores is negative, one should infer that better financial health implies lower hazard of termination of the exporting spell, and so better survival prospects.
Financial constraints and export survival (Score E).

SMEs: small and medium-sized enterprises; TFP: total factor productivity.
Standard errors in parentheses.
p < .1;
p < .05;
p < .01.
Financial constraints and export survival (Score F).
SMEs: small and medium-sized enterprises; TFP: total factor productivity.
Standard errors in parentheses.
p < .1;
p < .05;
p < .01.
Both in Tables 11 (Score E) and 12 (Score F), we present four specifications. In specification (1), we do not control for either the existence of left-censored spells or for the possible influence of firms’ restructuring processes. In all our specifications, we use all the observed export spells without excluding left-censored ones, as this would imply to waste a considerable amount of information. With the purpose of controlling for left-censoring in spells we include in specifications (2) to (4) a left-censor dummy (taking value one for the left-censored spells). The difference between specifications (2) and (3) is that while in specification (3) we control for firms restructuring process (Absorption and Excision dummies) in specification (2) we do not include such controls. Finally, in specification (4) with the aim of testing whether the effects of financial constraints differ between large firms and SMEs, we widen our estimation equation to allow the financial health variables to vary by firms’ size group (this amounts to include an estimation the variables ScoreX × SME and ScoreX × Large). Comparison of specifications (1) and (2) of Tables 11 and 12 suggest that not controlling for the existence of left-censored spells produces a downward bias in the estimation of the duration dependence parameter (in absolute value, the estimated coefficients for log(Survival Time) are considerably smaller in specifications (2) and (3)). Notwithstanding, sign and size of our main variable of interest (the scores proxying for financial health) do not depend of whether we include a left-censored spells control. The consideration of the variables capturing firms’ restructuring processes does not affect either the estimates of the duration dependence parameter or those of the financial scores. Furthermore, the variables Absorption and Excision are always not significant at any conventional level.
Before proceeding to the discussion of rest of our results, it is important to note that in all specifications and regardless of whether we use Score E or Score F to measure firms’ financial health, the mass point associated with “type 2” (mtype2) is significant at conventional levels, suggesting the existence of unobserved heterogeneity such as across firms’ differences in managers’ abilities, and so the need of controlling for this in our estimations. 46
In all specifications the coefficient of the variable log(Survival time) is negative suggesting the existence of negative duration dependence, that is, the survival prospects of export spells increase with their length. Above, we already explained that we believe that this duration pattern is related both to sunk costs (Roberts & Tybout, 1997) and learning by exporting (Timoshenko, 2015). However, we are mainly concerned with the influence of firms’ financial health. The estimates for Scores E and F in specifications (2) and (3) of Tables 11 and 12 are negative and significant (and similar in size) suggesting that firms with better financial health enjoy longer exporting spells, that is, financial health is positively associated with export persistence. Furthermore, results in specification (4) that analyze whether the effect of financial constraints on export persistence differ between large firms and SMEs suggests: (1) that both for large firms and SMEs the hazard of termination of export spells is negatively related to firms’ financial health (the estimates corresponding to financial Scores E and F for both size groups are negative and significant) and (2) the effect of financial health on export persistence is not significantly different for large firms and SMEs (both when using Scores E and F to measure financial constraints a test of equality of the coefficients does not reject the null of equality with p-values .952 and .460 for Scores E and F, respectively).
As for main estimation results for some of the control variables, first, we observe that firms export intensity improves the survival prospect of export spells. This is very likely associated with the link between export intensity and learning intensity, and to the fact that for firms selling a large proportion of their production to international markets, it results difficult to substitute international for domestic market in the short run. Second, we find that more productive firms enjoy longer exporting spells. This is quite interesting as it suggests a productivity effect that goes beyond self-selection into exporting. Third, size seems to have a non-linear effect on the hazard of exporting spells, the positive effect of size reaches a plateau for firms of 200 workers. 47 Fourth, our estimates point out the importance of firms’ innovation activities on export survival: firms that introduce product and/or process innovations show longer export persistence. Finally, and interestingly, the persistence exporting is longer for firms that declare to face and expansive demand and shorter for firms declaring to face a recessive demand.
Concluding remarks
Our article sheds light on the relevance of financial constraints on firms’ exports decisions. First, on the basis of the methodology proposed by Musso and Schiavo (2008), we build a firm-year financial score aimed at mirroring the degree of financial constraints faced by firms when deciding whether exporting or not. In our scores, we widen the set of quantity variables proposed by Musso and Schiavo (2008) to build their financial score including a price variable. The rationale is that we firmly believe that not only the amount of funds to which the firm has access but also the cost (price) of these funds is an important determinant of firms’ export decisions.
With this new measure of firms’ financial constraints in hand, we start our empirical analysis exploring the role of financial constraints in the firm’s decision of whether or not to export and export intensity. More specifically, in a first step we estimate a dynamic discrete choice model of the decision to export in which we consider the role of sunk costs and other sources of observed and unobserved firms’ heterogeneity to properly identify the role of financial constraints. Second, for exporting firms, we estimate a dynamic model of export intensity in which we use first step estimations to calculate Heckman’s lambda and correct for sample selection.
Nevertheless, in the dynamic analysis of the decision of whether exporting or not, we are considering in each period t firms that start exporting in period t and firms that, already exporting in period t–1, continue exporting in period t. Therefore, in order to disentangle whether the role of financial constraints is different for export starters and firms that continue exporting, we perform two additional analyses. In the first one, we analyze the importance of financial constraints on the probability of firms starting to export; in the second one, using as framework survival models, we explore how financial constraints shape firms’ decisions of continuing exporting. To the best of our knowledge, this is the first article that analyzes the influence of firms’ financial health not only on firms’ export decisions but also its decomposition in firms’ decision to start exporting and firms’ decision of continuing exporting. Furthermore, we thoroughly analyze how firm size may condition the causal relationship between financial constraints and exporting decisions. Should our financial scores distribution is size dependent and large firms are less financially constrained than SMEs, our financial scores variables could result relevant in the export decisions of SMEs but not in that of large firms.
We have used for estimation a representative sample of the population of Spanish manufacturing firms for the period 1992–2014. The data set has been drawn from the ESEE, a survey sponsored by the Ministry of Industry and carried annually that provides broad information at the firm level.
Our findings highlight the importance of distinguishing between large firms and SMEs when analyzing the role of financial constraints in firms’ exporting decisions. First, our analysis of the dynamic decision of whether exporting or not uncovers that financial health (as measured by our financial constraints scores) is relevant only for the export decisions of SMEs but not for that of large firms. In the same line, financial constraints do not seem to be relevant in large firms’ export intensity. Nevertheless, the results on export intensity for SMEs are inconclusive and depend on the financial score used to measure financial health. Third, in our attempt to disentangle whether the impact of firms’ financial health differs when firms are deciding whether starting to export or continuing doing so, we also obtain different results for large firms and SMEs. Our results suggest that whereas SMEs with better financial health are more likely to start exporting, past financial health of large export starters does not seem to be an impediment that endangers their incorporation to international markets. However, firms’ financial health arises as a relevant determinant of export persistence of both SMEs and large firms. It is not surprising that SMEs financial health is a relevant determinant of their export persistence; nevertheless, it is somehow unexpected that large firms’ financial health affects their export persistence but not their export engagement decisions. A possible explanation is that large firms start exporting to closer (easier) locations and when they age exporting they enlarge their exporting portfolio to include more distant (difficult) locations that require higher investments to establish a distribution network or to adapt their product to fulfill more distant countries legislation and/or consumer tastes. Furthermore, it should be considered that exporting is a self-fueling process, in the sense that the probability of continuing exporting increases with the number of years of continuous export engagement.
All in all, our empirical analysis suggests that export promotion policy should be selective and in most of the cases addressed to relax the financial constraints of SMEs. But policy makers should not forget that to maintain a basis of continuously exporting SMEs, measures aimed to relax financial constraints should be addressed not only to ease incorporation to export markets but also to facilitate initial years’ survival in these markets, usually characterized by a higher degree of competition. Once SMEs have been able to survive exporting for some initial years, the self-fueling nature of exports may make unnecessary additional financial support. Notwithstanding, policy measures should not forget that even large firms may need some help to persist in international markets. The good news is that our findings suggest that exporting is in part a self-sustained process (once firms survive some initial years of high hazard of exit, the probability of export survival considerably increases) and therefore the policy measures suggested above are likely to affect not only current export decisions but also are likely to induce an effect in promoting future export engagement.
Footnotes
Appendix 1
Appendix 2
Appendix 3
Appendix 4
Declaration of conflicting interests
The author(s) declared no potential conflicts of interest with respect to the research, authorship, and/or publication of this article.
Funding
The author(s) disclosed receipt of the following financial support for the research, authorship, and/or publication of this article: The authors acknowledge financial support from the Spanish Ministerio de Economía, Industria y Competitividad and the Spanish Agencia Estatal de Investigación (reference number ECO2017-86793-R, cofinanced with FEDER funds, European Union). They also acknowledge financial support from Generalitat Valenciana (reference number PROMETEO/2019/095).