
Abstract
There is a lack of studies investigating the clinical benefits of prebiotic-supplemented infant formula. In this study, healthy infants that started, on medical recommendation, artificial feeding with one of 2 infant formulas containing 4 g/L of GOS/FOS (9:1) (IF4 group; n = 60) or 8 g/L of GOS/FOS (9:1) (IF8 group; n = 60) were followed for 30 days to the evaluation of growth and gastrointestinal symptoms. Exclusively breastfed infants (EBF; n = 60) were followed up as a reference. Both infant formulas supported adequate weight gain, however, IF4 formula promotes growth more similar to breastfed infants. There was no additional benefit of a dose higher than 4 g/L of GOS/FOS on gastrointestinal symptoms.
Background
Human milk is the gold standard for infant feeding, not only for satisfying the nutritional needs of infants but also for providing bioactive components and reducing the risk of diseases later in life.1-4 It is recommended that children be breastfed for up to 2 years and beyond. 1 When breastfeeding is not possible, infant formulas are the best alternative for infant feeding, since they are produced to resemble the composition of human milk and its properties.2,5 However, since they are produced mainly from cow’s milk, they need to be adapted and optimized because the composition of human and cow’s milk is significantly different.2,5
Human milk has lower amounts of protein, a higher whey to casein ratio, and a different amino acid composition, compared to cow’s milk.2,4,6 As a result of these differences, reducing the protein content, and increasing whey to casein ratio alone do not provide infant formula with an amino acid composition similar to human milk.5,6 Insulinogenic amino acids (leucine, isoleucine, valine, and threonine) are physiologic stimulators of insulin and insulin-like growth factor I (IGF-1) secretion, which may trigger accelerated growth and adipogenesis,7,8 and should also be adjusted.
Other components that differ significantly between human and cow’s milk are the oligosaccharides. Human milk contains 5 to 15 g/L of human milk oligosaccharides (HMOs), 9 which act as prebiotics, prevent pathogen growth and adhesion, reduce inflammatory responses, improve the mucosal barrier function, and may also be involved with infant cognitive development.10-15 On the other hand, cow’s milk contains only 0.03 to 0.06 g/L of oligosaccharides. 16 Synthetic and vegetable oligosaccharides, specially galactooligosaccharides (GOS) and fructooligosaccharides (FOS), respectively, and its combination (GOS/FOS) have been added to infant formulas to compensate the lack of oligosaccharides in cow’s milk and to provide a prebiotic effect. 17
The prebiotics GOS/FOS stimulate Bifidobacterium and Lactobacillus growth, increase fecal water content, and consequently improve gastrointestinal transit and comfort.17,18 Several studies with different amounts of GOS/FOS in infant formulas have demonstrated positive results.5,18-21 However, to our knowledge, there is only 1 study directly comparing the effects of 4 g and 8 g/L of GOS/FOS on stool characteristics, vomiting, regurgitation, and crying. 22 The authors reported a higher stool frequency and softer stools in infants consuming 8 g/L GOS/FOS than 4 g/L GOS/FOS, but no differences between the 2 formula groups on crying, regurgitation, and vomiting. 22
This study aimed to evaluate the effect of 2 infant formulas with different protein profiles and doses of prebiotics GOS/FOS (4 or 8 g/L) on infant growth, stool characteristics, gastrointestinal symptoms, and behavioral patterns.
Methods
Study Design
This was an observational, multicenter, prospective study of 2 parallel formula-fed infant groups recruited by pediatricians at private clinics in the Brazilian cities of São Paulo, Porto Alegre, and Recife between August 2019 and December 2019.
The 2 study formulas provided full nutritional support for infants from birth to 6 months of age, according to the Codex Alimentarius. 23 IF4 formula contained 67 kcal/100 mL, 1.8 g protein/100 kcal, whey to casein ratio of 70:30 with amino acids profile optimization (removal of the caseinoglycomacropeptide fraction, which is rich in threonine but poor in tryptophan, and an increase in the α-lactalbumin fraction which is rich in tryptophan (patent WO 01/11990 6 )) and 4 g/L of GOS/FOS (9:1). IF8 formula contained 66 kcal/100 mL and 1.8 g protein/100 kcal but had a whey to casein ratio of 60:40, without amino acids profile optimization and 8 g/L of GOS/FOS (9:1). Concentrations of all nutrients except the protein profile and GOS/FOS were similar in the 2 formulas. The detailed composition of the 2 studied formulas is presented in Supplemental Table S1. The parents or caregivers purchased IF4 and IF8 at local stores. Both are routine formulas with similar prices.
Study Population
Healthy, full-term (gestational age between 37 and 42 weeks), singleton infants with birth weight ≥2500 g were enrolled in the study between 15 and 40 days of age. Infants whose pediatrician and parents decided to use one of the study formulas, independently and before inclusion, were followed-up as they started consuming the infant formula. Also, infants on exclusive breastfeeding were followed-up as a reference group. There was no intervention from the investigators regarding the discontinuation of breastfeeding, type of feeding choice nor brand of the formula used. The pediatricians were free and used their own criteria to decide which formula to prescribe and the study did not provide any incentives for prescribing formula or a specific brand of formula. Pediatricians involved in the study had at least 5 years of experience in clinical practice.
The reasons reported by the pediatricians for the prescription of formula were as follows: infant’s low weight gain (46%); mother’s difficulty on breastfeeding (30%); hypogalactia (6%); maternal use of medication incompatible with breastfeeding (5%); mother’s insecurity (4%); infant’s difficulty (4%); twin infants (4%); and infant’s constipation (1%). It is important to note, however, that these data are only descriptive since it was not the objective of this study to analyze the reasons for formula prescription.
Infants were then categorized into 3 groups, according to the type of feeding: (a) exclusive breastfeeding (EBF; n = 60); (b) exclusive formula feeding using an infant formula with 4 g/L of GOS/FOS (IF4; n = 60) and (c) exclusive formula feeding using an infant formula with 8 g/L of GOS/FOS (IF8; n = 60). Formula feeding was started at baseline (V1). At the final visit (V2), the pediatricians asked the type of feeding and which formula was used since V1 to assure the infants remained on the prescribed formula.
Exclusion criteria were mixed feeding (breastfeeding + formula) during follow-up, congenital illness or malformation that could affect normal growth, any chronic illness, cow’s milk protein allergy (diagnosed or suspected), and the use of other formula different from the prescribed during follow-up.
Study Visits
Infants completed a baseline visit (V1) between 15 and 40 days of age and a follow-up visit at 28 ± 5 days after V1 (V2). Data collection was performed at both visits. At the baseline visit, demographic information, infant characteristics, and birth data were collected. At each visit, the pediatricians obtained anthropometric measurements (weight, length, and head circumference), performed clinical examinations, and interviewed the parents/legal guardians using a structured questionnaire. Infants were examined by the same pediatrician at V1 and V2.
Structured Questionnaire
Gastrointestinal symptoms, stool characteristics and behavioral patterns were assessed based on parental report of the day before the visit through an interview by the pediatrician using a structured questionnaire. The questionnaire was based on a previously used form, 22 and provided information on stool frequency (number of stools per day), stool consistency (rating from 1 to 5: 1 = liquid; 2 = soft; 3 = loose; 4 = firm; 5 = hard), flatulence (rating from 0 to 3: 0 = absent; 1 = moderate; 2 = intense; 3 = very intense), colic (rating from 0 to 3: 0 = absent; 1 = moderate; 2 = intense; 3 = very intense), crying (frequency, duration, and intensity), regurgitation (rating from 0 to 3: 0 = absent; 1 = 1 episode/day; 2 = 2 episodes/day; 3 ≥ 3 episodes/day), occurrence of straining/difficulty passing stools, and sleep quality (rating from 1 to 5: 1 = very good; 2 = good; 3 = adequate; 4 = bad; 5 = very bad) (see Appendix 1).
Outcome Measures
The primary outcome was daily weight gain (g/day) between the study visits (calculated as the difference in infant weight (g) between V2 and V1, divided by the number of days between those 2 visits). Secondary outcomes included weight, length, body mass index (BMI), head circumference, and z scores for weight-for-age, height-for-age, BMI-for-age, and head circumference-for-age. Stool characteristics (frequency and consistency), gastrointestinal symptoms (flatulence, colic, regurgitation, and straining/difficulty passing stools), and behavioral patterns (crying and sleep quality) were also evaluated as secondary outcomes.
Statistical Analyses
Sample size was based on previous studies designed to detect a difference of ≥3 g/day in weight gain at 5% significance and 80% power.19,24 Descriptive statistics and statistical tests were performed with the use of the software XLSTAT, version 19.01, and Sigma Plot, version 12.0. Growth indicators were expressed as z scores relative to the growth standards of the WHO for breastfed children. 25 Mean (±SD) or medians with interquartile ranges (IQR: 25th and 75th percentiles) were used according to the distribution of each variable. Kruskal-Wallis and Tukey tests were used for statistical comparison of non-parametric quantitative data, while Analysis of Variance (ANOVA) and Holm-Sidak method were employed to compare parametric quantitative data. Qualitative variables were reported in proportions and compared by chi-squared test or z test with a 95% confidence interval. Differences were considered statistically significant when P < .05.
Ethical Considerations
The study was performed following the Declaration of Helsinki and the Ethics Committee of Universidade Nove de Julho approved the study (protocol No. 3.505.710). Parents or legal guardians signed informed consent before enrollment.
Results
A total of 180 infants were included in the study, of which 60 were from Porto Alegre, 60 from Recife, and 60 from São Paulo (with 20 infants from each group—IF4; IF8 and EBF—in each city). Infant’s characteristics and anthropometrics at birth were comparable among groups, except for the mode of delivery, where a significantly higher proportion of C-section was observed in the IF8 group compared to the EBF group (Table 1).
Infant’s Characteristics and Birth Data.

Values are reported as median (p25-p75) unless otherwise noted.
IF4 g/L GOS/FOS group.
IF8 g/L GOS/FOS group.
Exclusively breastfed infants.
Kruskal-Wallis test.
Z test.
Mean ± standard deviation.
One way ANOVA.
Growth
Table 2 shows the infant’s anthropometry and growth indicators at V1 (baseline) and V2 (1 month after V1). At V2, IF8 group presented a significantly higher BMI and weight-for-length and BMI-for-age z scores than the IF4 and the EBF group (Figure 1A and B), even after correction for the mode of delivery (see Supplemental Table S2).
Infant’s Anthropometry and Growth Indicators at Visit 1 (Baseline) and Visit 2.

Values are reported as median (p25-p75) unless otherwise noted.
IF 4 g/L GOS/FOS.
IF 8 g/L GOS/FOS.
Exclusively breastfed infants (reference group).
Kruskal-Wallis test.
Mean ± standard deviation.
One way ANOVA.
Holm-Sidak method.
Weight gain at V1 = (weight at V1 − weight at birth)/days of age.
Weight gain at V2 = (weight at V2 − weight at V1)/number of days between V1 and V2.
Tukey test.
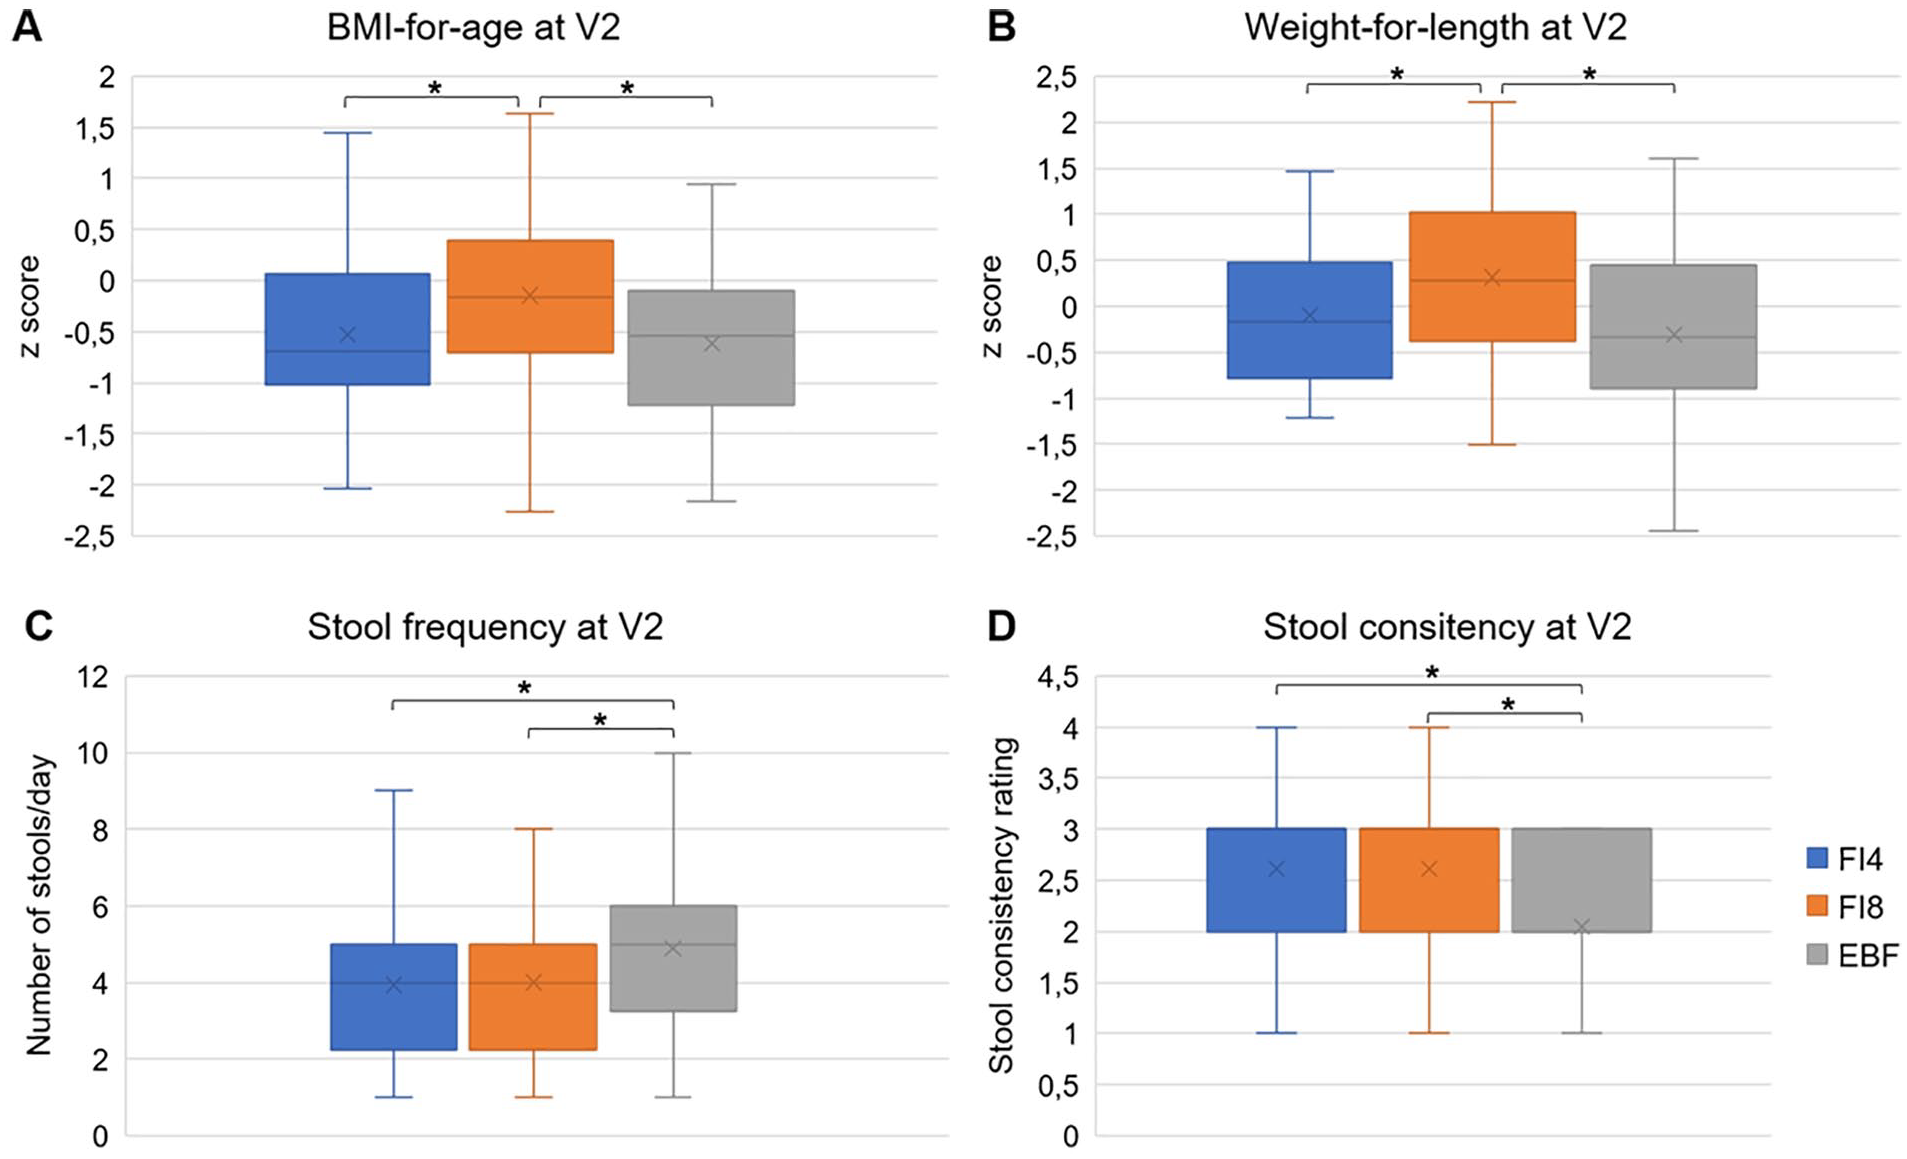
BMI-for-age (A), weight-for-length (B), stool frequency (C), and stool consistency (D) in all groups at V2. Stool consistency rating from 1 (liquid) to 5 (hard). Asterisks indicate statistical significance at P < .05. Whiskers indicate the minimum and maximum values, except outliers.
Gastrointestinal Symptoms
Table 3 shows the prevalence and proportions of gastrointestinal symptoms and comparisons between groups at V1 and V2.
Prevalence and Proportions of Gastrointestinal Symptoms in the Groups at V1 and V2.

IF 4 g/L GOS/FOS.
IF 8 g/L GOS/FOS.
Exclusively breastfed infants (reference group).
One way ANOVA.
Holm-Sidak method.
Kruskal-Wallis test.
Tukey test.
Stool consistency rating from 1 (liquid) to 5 (hard).
Z-test with 95% confidence.
No significant changes in the prevalence of colic and the proportions of intense/very intense colic were observed between V1 and V2 for any study group, except for the IF8 group, which presented a significant reduction in the proportion of intense/very intense colic (P < .05; Z-test with 95% confidence).
Despite a significant reduction (P < .001) occurred in stool frequency between V1 and V2 for the EBF group, it remained higher than both formula groups at V2 (Figure 1C). IF8 presented a significant reduction (P = .002) in stool frequency between V1 and V2, while no difference was observed in IF4 for this period (P = .180).
Comparisons of median (p25-p75) stool consistency ratings showed that the EBF group had significantly softer stools (P < .001) than both formula groups at V1 and V2 (Figure 1D). Median (p25-p75) stool consistency ratings increased significantly between the study visits for IF4 (P = .032), IF8 (P < .001) and EBF group (P = .002).
Behavioral Patterns
No significant changes occurred between the study visits regarding crying parameters for any group, although the prevalence of crying episodes at V2 was lower in EBF (P < .05) because the EBF group had a decrease in crying from V1 to V2, but the other groups did not. A significant reduction (P < .05) was observed in the proportion of bad/very bad sleep between V1 and V2 in both formula groups so that sleep quality differences at V1 between EBF and both formula groups were no longer observed at V2. No differences were observed between both formula groups regarding sleep quality at any study visit. Supplemental Table S3 presents complete results on the infant’s behavioral patterns at V1 and V2 and the comparisons between the groups.
Discussion
The quality and amount of protein consumed in early life influences metabolic programing, possibly affecting weight gain and obesity development.26-28 A possible explanation for the differences observed in growth indicators between IF4 and IF8 is the differential protein profile of IF4, which is obtained through a process to reduce the amount of insulinogenic amino acids (patent WO 01/11990). 6 Briefly, the process consists of removing the caseinoglycomacropeptide fraction, which is rich in threonine but poor in tryptophan, and increasing the proportion of the α-lactalbumin fraction, which is rich in tryptophan. 6 The resulting amino acid profile and quantities after the process are similar and within the range observed in breast milk.6,29 Insulinogenic amino acids (leucine, isoleucine, valine, and threonine) are physiologic stimulators of insulin and insulin-like growth factor I (IGF-1) secretion, which may trigger accelerated growth and adipogenesis.7,8 However, despite the statistically significant differences, growth indicators were adequate according to the WHO 30 standards for all groups.
The effects of GOS/FOS addition to infant formula on stool frequency are varied in literature, with some studies reporting positive effect,19,21,22 while others report no difference relative to a control formula without GOS/FOS.20,31 In our study, stool frequency did not differ between the formula groups, indicating that 4 or 8 g/L of GOS/FOS produces the same effect. Differently, the only previous study comparing stool characteristics from 1-month-old infants consuming infant formula with 4 or 8 g/L GOS/FOS, reported a higher stool frequency in the group consuming the 8 than 4 g/L GOS/FOS and control (maltodextrin as a placebo) groups. 22 Another study, with 0 to 3 months old infants, reported a higher stool frequency with the use of infant formula with 4 g/L GOS/FOS compared to a control formula without added prebiotics (1.9 [1.2-2.1] vs 1.6 [1.1-1.9] episodes/day; P = .03). 19 The infants from our study using infant formula with 4 g/L GOS/FOS presented an even higher stool frequency (4.00 [2.25-5.00] episodes/day) than reported by those authors. 19 As previously reported, 20 in our study, EBF infants presented a higher stool frequency than infants consuming 4 or 8 g/L GOS/FOS. At baseline, stool frequency was lower and stool consistency was higher in the infants who were prescribed the infant formulas (IF4 and IF8 groups) than in those who would maintain exclusive breastfeeding (EBF group). However, median stool frequency was adequate in all groups at both time points (≥3 stools/day considered normal for newborns). 32 While the IF4 group maintained the stool frequency of when breastfed, the IF8 group had a significantly reduced stool frequency after 1 month, differing from what was reported by Moro et al (2002), who reported an increase in stool frequency after 28 days of use of infant formula with 8 g/L GOS/FOS.
Softer stools and a higher stool frequency observed in EBF infants were expected since human milk contains an elevated amount (5-15 g/L) of non-digestible carbohydrates (HMOs), which modulate the infant gut microbiota and promote gastrointestinal health. 9 As prebiotics, GOS/FOS have been added to infant formula with some evidence of improvement on gastrointestinal transit and comfort, especially stool softening.18,33 Our results show that there is no difference in stool consistency when using 4 or 8 g/L of GOS/FOS. A previous study reported lower stool consistency scores in both dosages when compared to the control group; however, it was even softer in 8 g/L compared to 4 g/L group (2.25 [2.00-2.75] vs 3.00 [2.50–4.00]; P < .01). 22 Another study demonstrated softer stools in infants consuming 4 g/L GOS/FOS relative to a control without prebiotics (stool consistency score 3.0 [2.0-3.5] vs 3.1 [2.5-3.5]; P = .026). 19 Other studies have reported softer stools 20 as well as no effect on stool consistency 31 when using 8 g/L GOS/FOS relative to control without prebiotics.
As previously reported, 22 we did not observe differences between the 2 formula groups on crying, regurgitation, and vomiting. Other studies comparing only an infant formula with 8 g/L GOS/FOS and a control without prebiotics did not find differences in flatulence, crying, regurgitation, and vomit.20,31 There are no previous comparisons between infant formulas with 4 or 8 g/L GOS/FOS regarding the performance of flatulence, colic, and sleep quality. Here we report no differences between the formula groups regarding infant colic and flatulence and that both formulas improved sleep quality during study duration.
Our study has some limitations. Since C-section impacts the infant gut microbiota, which in turn can influence weight/fat gain and the development of gastrointestinal symptoms, the higher proportion of C-sections observed in the IF8 group compared to the EBF group could be considered a limitation. However, BMI, weight-for-length, and BMI-for-age z scores remained significantly higher in the IF8 group after correction for the type of delivery (Supplemental Table S2), which indicates that the differences in growth were not caused by C-section. We did not evaluate the effect of each formula on the infant microbiome, which would be helpful. Furthermore, the outcome measure of weight gain after 30 days of formula consumption might not predict the weight trajectory over the long term and future studies should follow the infants during the first year of life. Another limitation of the study is that the 2 infant formulas differed not only in GOS/FOS concentration but also in protein composition. However, the influence of the protein profile on gastrointestinal symptoms has been reported regarding only partially hydrolyzed protein. 34 Since both infant formulas from this study had intact protein, this impact would be minimal. Lastly, all infants got the benefits of colostrum since they were exclusively breastfed prior to their inclusion in the study. Outside this study, infants who consume these formulas from birth miss the benefits from colostrum and may have different outcomes.
Conclusions
Breastfeeding is the gold standard for infant feeding and nutrition during the first 6 months of life and for up to 2 years and beyond, in addition to the complementary feeding.35-38 When breastfeeding is not an option, infant formulas are the best alternative for infant feeding. In this study, consumption of an infant formula containing 4 g/L of GOS/FOS promoted adequate weight gain in infants, providing growth indicators similar to those of exclusively breastfed infants. Although within WHO standards, consumption of regular infant formula with 8 g/L GOS/FOS was associated with a higher BMI and weight-for-length and BMI-for-age z scores. Since the consumption of infant formula with 4 or 8 g/L of GOS/FOS promoted the same effects on the infant’s gastrointestinal symptoms and behavioral patterns, our results indicate that there is no additional benefit on using a higher dose than 4 g/L of GOS/FOS.
Supplemental Material
sj-pdf-1-gph-10.1177_2333794X211044115 – Supplemental material for The Effect of Infant Formulas With 4 or 8 g/L GOS/FOS on Growth, Gastrointestinal Symptoms, and Behavioral Patterns: A Prospective Cohort Study
Supplemental material, sj-pdf-1-gph-10.1177_2333794X211044115 for The Effect of Infant Formulas With 4 or 8 g/L GOS/FOS on Growth, Gastrointestinal Symptoms, and Behavioral Patterns: A Prospective Cohort Study by Karina Merini Tonon, Thaís Moreno Tomé, Elaine Martins Bento Mosquera, Natália Pratis Perina and Tamara Lazarini in Global Pediatric Health
Footnotes
Appendix
Questionnaire for Gastrointestinal Symptoms, Stool Characteristics and Behavioral Patterns.

| Subject number: | Birth date: | ____/____/_______ | |||
| Sex: | () female | () male | |||
| Birth data: | Weight: _________ g | Length: ________cm | Head circumference: _________cm | ||
| Gestational age: | ______ weeks and ______days | ||||
| Mode of delivery: | () vaginal | () scheduled c-section | () unscheduled c-section | ||
|
|
|||||
|
|
|||||
| Date: ____/____/_______ | |||||
| Weight: _________ g | Length: ________cm | Head circumference: _________cm | |||
| Feeding: | () exclusive breastfeeding | () breast milk + formula | () exclusive formula feeding | ||
| Prescription: | () exclusive breastfeeding | () breast milk + formula | () exclusive formula feeding | ||
| Reason for prescription: | |||||
| Sleep quality: | () very good | () good | () adequate | () bad | () very bad |
| Flatulence: | () absent | () moderate | () adequate | () intense | () very intense |
| Straining/difficulty passing stools: | () absent | () present | |||
| Number of stools per day: ___________ | |||||
| Stool consistency: | () liquid | () soft | () loose | () firm | () hard |
| Regurgitation: | () absent | () 1 episode/day | () 2 episodes/day | () 3 episodes/day | () ≥ 4 episodes/day |
| Colic: | () absent | () light | () moderate | () intense | () very intense |
| Crying: | |||||
| Crying intensity | () absent | () light | () moderate | () intense | () very intense |
| Crying duration (hours/day): | () absent | () 1-2 hours | () >2-3 hours | () >3-4 hours | () >4 hours |
| Crying episodes: | () absent | () 1×/day | () 2×/day | () 2×/day | () >4×/day |
|
|
|||||
| Date: ____/____/______ (* from 28 to 33 days after initial visit—V1) | |||||
| Weight: _________ g/ | Length: ________cm | Head circumference: _________cm | |||
| Feeding: | () exclusive breastfeeding | () breast milk + formula | () exclusive formula feeding | ||
| If formula feeding: | () IF4 | () IF8 | () other | ||
| Sleep quality: | () very good | () good | () adequate | () bad | () very bad |
| Flatulence: | () absent | () moderate | () adequate | () intense | () very intense |
| Straining/difficulty passing stools: | () absent | () present | |||
| Number of stools per day: ___________ | |||||
| Stool consistency: | () liquid | () soft | () loose | () firm | () hard |
| Regurgitation: | () absent | () 1 episode/day | () 2 episodes/day | () 3 episodes/day | () ≥4 episodes/day |
| Colic: | () absent | () light | () moderate | () intense | () very intense |
| Crying: | |||||
| Crying intensity | () absent | () light | () moderate | () intense | () very intense |
| Crying duration (hours/day): | () absent | () 1-2 hours | () >2-3 hours | () >3-4 hours | () >4 hours |
| Crying episodes: | () absent | () 1×/day | () 2×/day | () 2×/day | () >4×/day |
Author Contributions
KMT designed the study, analyzed, and interpreted data, and wrote the manuscript draft. TMT designed the study, interpreted data, and wrote the manuscript draft. EMBM designed the study, interpreted data, reviewed the work with a critical view for important intellectual content. NPP reviewed the work with a critical view of important intellectual content. TL designed the study and reviewed the work with a critical view of important intellectual content. All authors approved the version to be published.
Declaration of Conflicting Interests
The author(s) declared the following potential conflicts of interest with respect to the research, authorship, and/or publication of this article: KMT received fees for scientific consulting from Nestlé Brazil LTDA., TMT, EMBM, NPP, and TL are current employees of Nestlé Brazil LTDA.
Funding
The author(s) disclosed receipt of the following financial support for the research, authorship, and/or publication of this article: This study was designed and completely funded by Nestlé Brazil LTDA.
Supplemental Material
Supplemental material for this article is available online.
References
Supplementary Material
Please find the following supplemental material available below.
For Open Access articles published under a Creative Commons License, all supplemental material carries the same license as the article it is associated with.
For non-Open Access articles published, all supplemental material carries a non-exclusive license, and permission requests for re-use of supplemental material or any part of supplemental material shall be sent directly to the copyright owner as specified in the copyright notice associated with the article.