
Abstract
This descriptive study examines the prevalence of obesity-related cardiometabolic (CM) risk factors using CM laboratory metrics, in 3 to 19 year olds presenting to a rural American Academy of Pediatrics stage 3 multidisciplinary weight management clinic based on gender, age ranges, and obesity classes. From 2009 to 2016, 382 children (body mass index ≥85th percentile) enrolled. Multiple logistic regression determined the effects of age, gender, or obesity class on CM risk factors. Odds of elevated insulin were more significant in 15 to 19 year olds than in 3 to 5 year olds, or in 6 to 11 year olds. Obesity class III had higher odds than class II, class I, and overweight in having elevated insulin; twice likely than class II for having low high-density lipoprotein; and twice as likely than class I for high triglycerides. Adolescents and obesity class III categories have significant CM risk but the burden in younger and less severe obesity cohorts cannot be underestimated.
Keywords
Overweight and obesity affect approximately 32% of US youth aged 2 to 19 years. 1 Overweight and obesity are associated with the concurrent rise in certain obesity-related cardiometabolic (CM) comorbidities such as prediabetes, diabetes, hyperlipidemia, hypercholesterolemia, along with some psychosocial conditions, predisposing children and adolescents to obesity-related morbidity and mortality in adulthood. 2 Successful treatment of obesity or overweight in childhood and adolescence is central to prevention or mitigation of CM disease risk. With 22.8% of preschool children, 34.2% of 6 to 11 year olds, and 34.5% of adolescents 12 to 19 years of age currently affected by overweight and obesity, it is of critical importance to study the prevalence of CM risk in children of all ages. 1
The rates of CM comorbidities in the pediatric population with obesity have been previously documented3-5; however, there is wide variance in the reported prevalence rates of each CM or endocrine risk factor studied based on gender, age group, or the method of obesity classification. For example, impaired glucose tolerance in several studies is reported in 7% to 25% of children and adolescents with obesity6-8; hence, further study within obesity categories is warranted. In the Bogalusa Heart Study, 60% of children in the overweight category had at least 1 risk factor and 25% had 2 or more CM risk factors. 4 Despite the reported high overall rates, few studies have examined the prevalence in pediatric subgroups who are overweight or have less severe classes of obesity.
Understanding the prevalence, distribution, and magnitude of CM risk in subpopulations is a critical strategy that may assist in developing targeted approaches to weight management and CM comorbidity prevention and treatment. Rates of pediatric CM comorbidities in a national sample, 5 in school-aged children, and among children with obesity are reported 8 ; however, literature focusing on CM comorbidities in children referred to rural weight management clinics is limited. Within this subpopulation, statistics on preschool-aged children and children falling into overweight and severe obesity categories are further scarce.5,9
The purpose of this descriptive study is to examine the prevalence of obesity-related CM risk factors using CM laboratory metrics in 3 to 19 year olds presenting to a rural American Academy of Pediatrics (AAP) stage 3 multidisciplinary weight management clinic based on gender, age ranges, and obesity classes.
Methods
Data and Study Population
Our clinic, situated in rural Maine, is a multidisciplinary weight management clinic that meets both the US Preventive Services Task Force (USPSTF) 10 Grade B rating for intensity and the AAP Stage 3 criteria 11 for a comprehensive multidisciplinary intervention. Conducted with institutional review board’s approval, all children and families referred to our pediatric weight management clinic were invited to participate in the program’s ongoing research study. Data from 382 consented or assented patients enrolled between November 2009 and March 2016 are included in this cross-sectional analysis of obesity-related CM comorbidities.
Demographic information on participants was obtained from a baseline survey. Anthropometric measures (height, weight, and waist circumference) were obtained at the first visit by physical examination. CM risk factor data were collected from laboratory data in the electronic medical record. Participants without documented body mass index (BMI) or any CM risk factor data were excluded from analyses. Given different sample sizes for screening, final participants included in the analyses varied by outcome variable.
Obesity Classification
Children with age- and gender-specific BMI ≥85th percentile were eligible to participate. Weight status is based on Centers for Disease Control and Prevention (CDC) growth chart percentiles, with overweight classified as BMI ≥85th to <95th percentile and obesity ≥95th percentile. Enrolled children were further classified using American Heart Association criteria as obesity Class I (≥95th percentile to <120% of the 95th percentile); obesity Class II (≥120% to <140% of the 95th percentile) or a BMI ≥35 to ≤39, whichever was lower; or obesity Class III (≥140% of the 95th percentile) or BMI ≥40, whichever was lower.1,12-15
Cardiometabolic Risk Factors
Criteria for determining whether a child was at high risk for 1 of the 7 obesity-related CM risk factors examined in this study were based on the guidelines recommended by several organizations. Fasting (defined by no calorie intake for 8 hours) glucose and hemoglobin A1c (HbA1c) cutoff points were derived from the American Diabetic Association guidelines 16 ; insulin normative levels from Brar et al 17 ; and total cholesterol (TC), low-density lipoprotein (LDL), high-density lipoprotein (HDL), and triglyceride (TG) cutoff criteria were obtained from the National Heart, Lung, and Blood Institute guidelines 18 (Table 1). Criteria for vitamin D levels were obtained from the Endocrine Society guidelines. 19
Criteria Used for Assessing Cardiometabolic Risk for the Current Study.
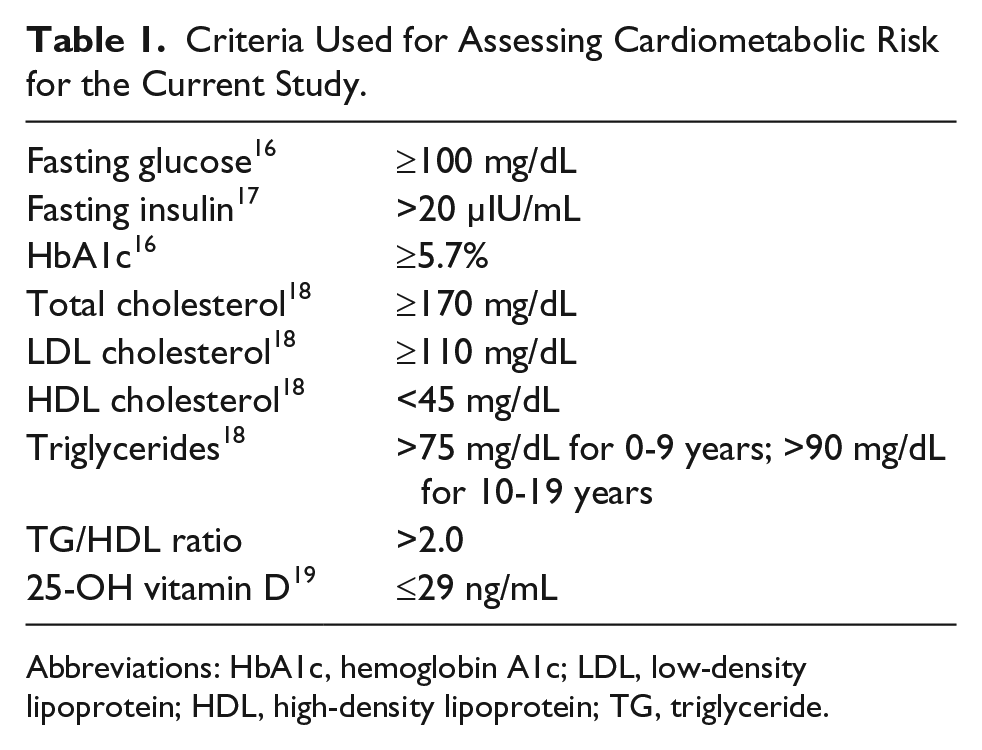
Abbreviations: HbA1c, hemoglobin A1c; LDL, low-density lipoprotein; HDL, high-density lipoprotein; TG, triglyceride.
Statistical Analyses
Descriptive statistics were calculated for the overall sample. Means and standard deviations (SD) for continuous variables and proportions for categorical variables are presented. To determine the screening rate for each CM factor collected, the numerator included the total number of children with laboratory values while the denominator included the total number of children in the study. Unadjusted prevalence of each CM risk factor was estimated by including total children at risk in the numerator and total children screened in the denominator. Bivariate analyses were conducted to test if there exists any association between gender, age categories, or obesity class and each CM risk factor using multiple χ2 tests. To determine if there were statistically significant differences between different categories of obesity class on mean levels of CM risk factors, a Kruskal-Wallis H test was used. Logistic regression was used to examine if obesity class was associated with any CM risk factors that were significant in the bivariate analyses after controlling for age and gender. All tests were conducted at the P < .05 significance level in SPSS v.21. 20
Results
Descriptive Statistics
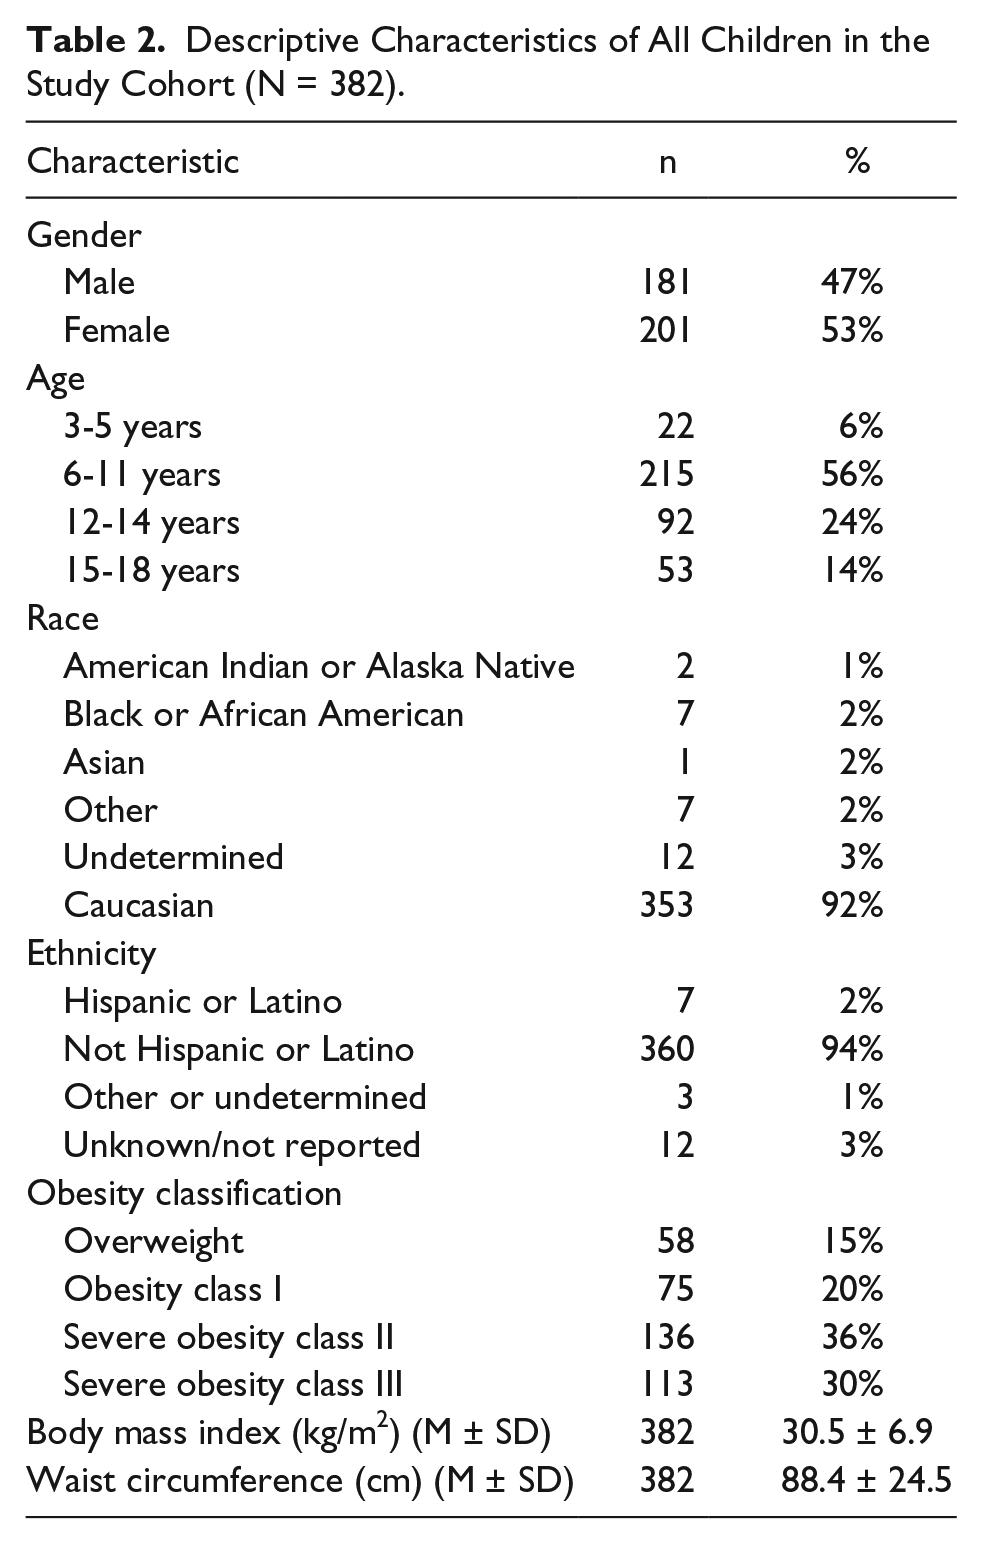
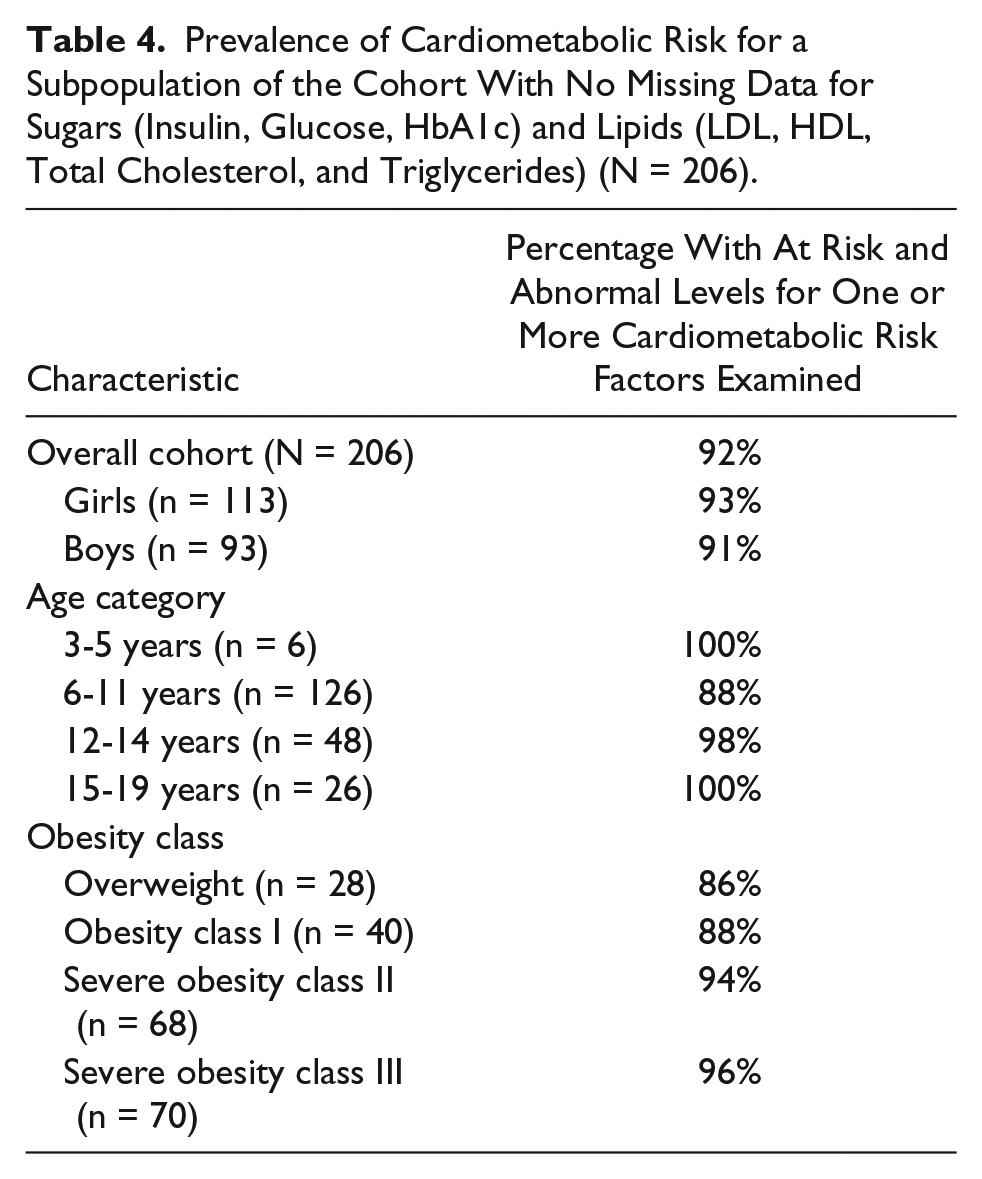
Overall, 382 children between the ages of 3 to 19 years with BMI ≥85th percentile were enrolled from September 2009 until March 2016. Forty-seven percent of the study cohort included boys and 53% were girls. The mean age of all participants was 11 ± 3.2 years. The study sample was 92% white and 94% did not identify as ethnically Hispanic or Latino. Children with severe obesity (Classes II and III) represented 66% of the study cohort (n = 249). Further descriptive characteristics of the study cohort are presented in Table 2. The CM profile and the proportion of children with high risk and abnormal values for each CM risk factor are presented in Table 3. Screening for at least one CM risk factor was completed in 88% (n = 337) of the study cohort. Of those screened for at least one glucose, insulin, or lipid level (n = 206), 92% presented with at risk or abnormal levels for at least one CM risk factor. Table 4 shows the proportion of participants at risk of abnormal levels for at least 1 of the 7 examined CM risk factors. Tables 5 and 6 further delineate fasting insulin and fasting triglycerides, respectively, using specific age ranges. Proportions of children and adolescents with high risk or abnormal levels of CM risk factors by gender, age, and obesity class are presented in Figures 1, 2, and 3, respectively.
Descriptive Characteristics of All Children in the Study Cohort (N = 382).
Cardiometabolic Profile of the Study Cohort (N = 382).
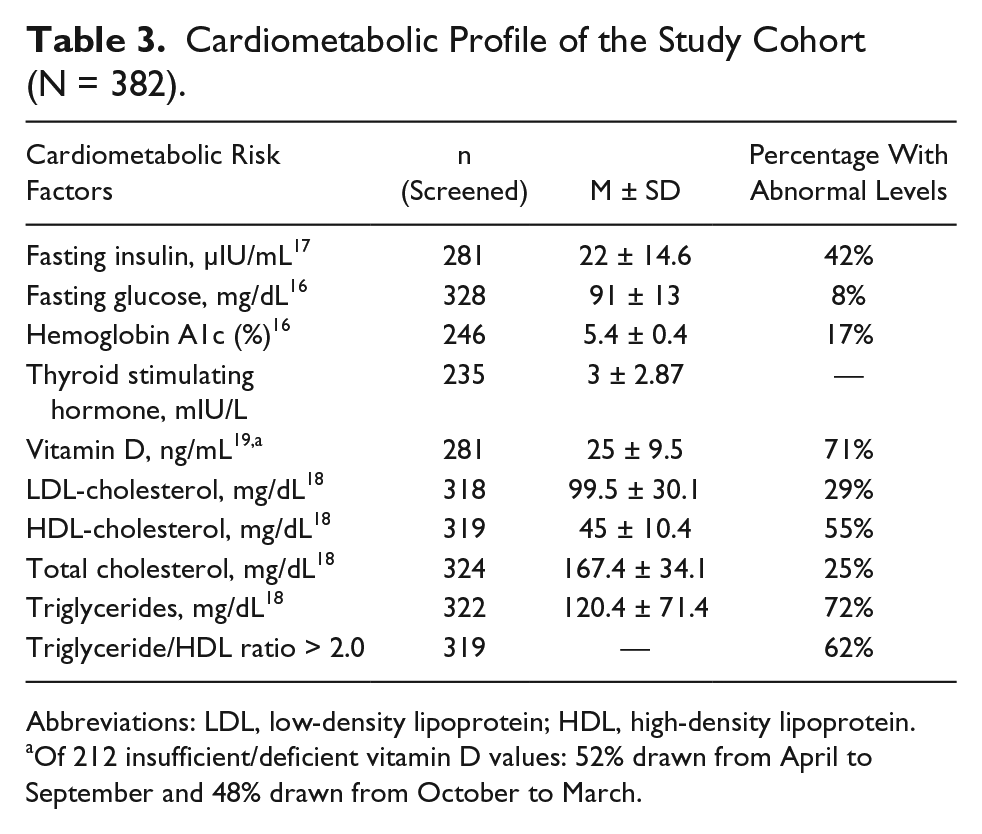
Abbreviations: LDL, low-density lipoprotein; HDL, high-density lipoprotein.
Of 212 insufficient/deficient vitamin D values: 52% drawn from April to September and 48% drawn from October to March.
Prevalence of Cardiometabolic Risk for a Subpopulation of the Cohort With No Missing Data for Sugars (Insulin, Glucose, HbA1c) and Lipids (LDL, HDL, Total Cholesterol, and Triglycerides) (N = 206).
Fasting Insulin Levels Using Specific Age Ranges a .

Adapted by Nationwide Children’s Hospital, Columbus, OH, from Expert Committee Recommendations Summary Report 2007.
Fasting Triglyceride Levels Using Specific Age Ranges a .
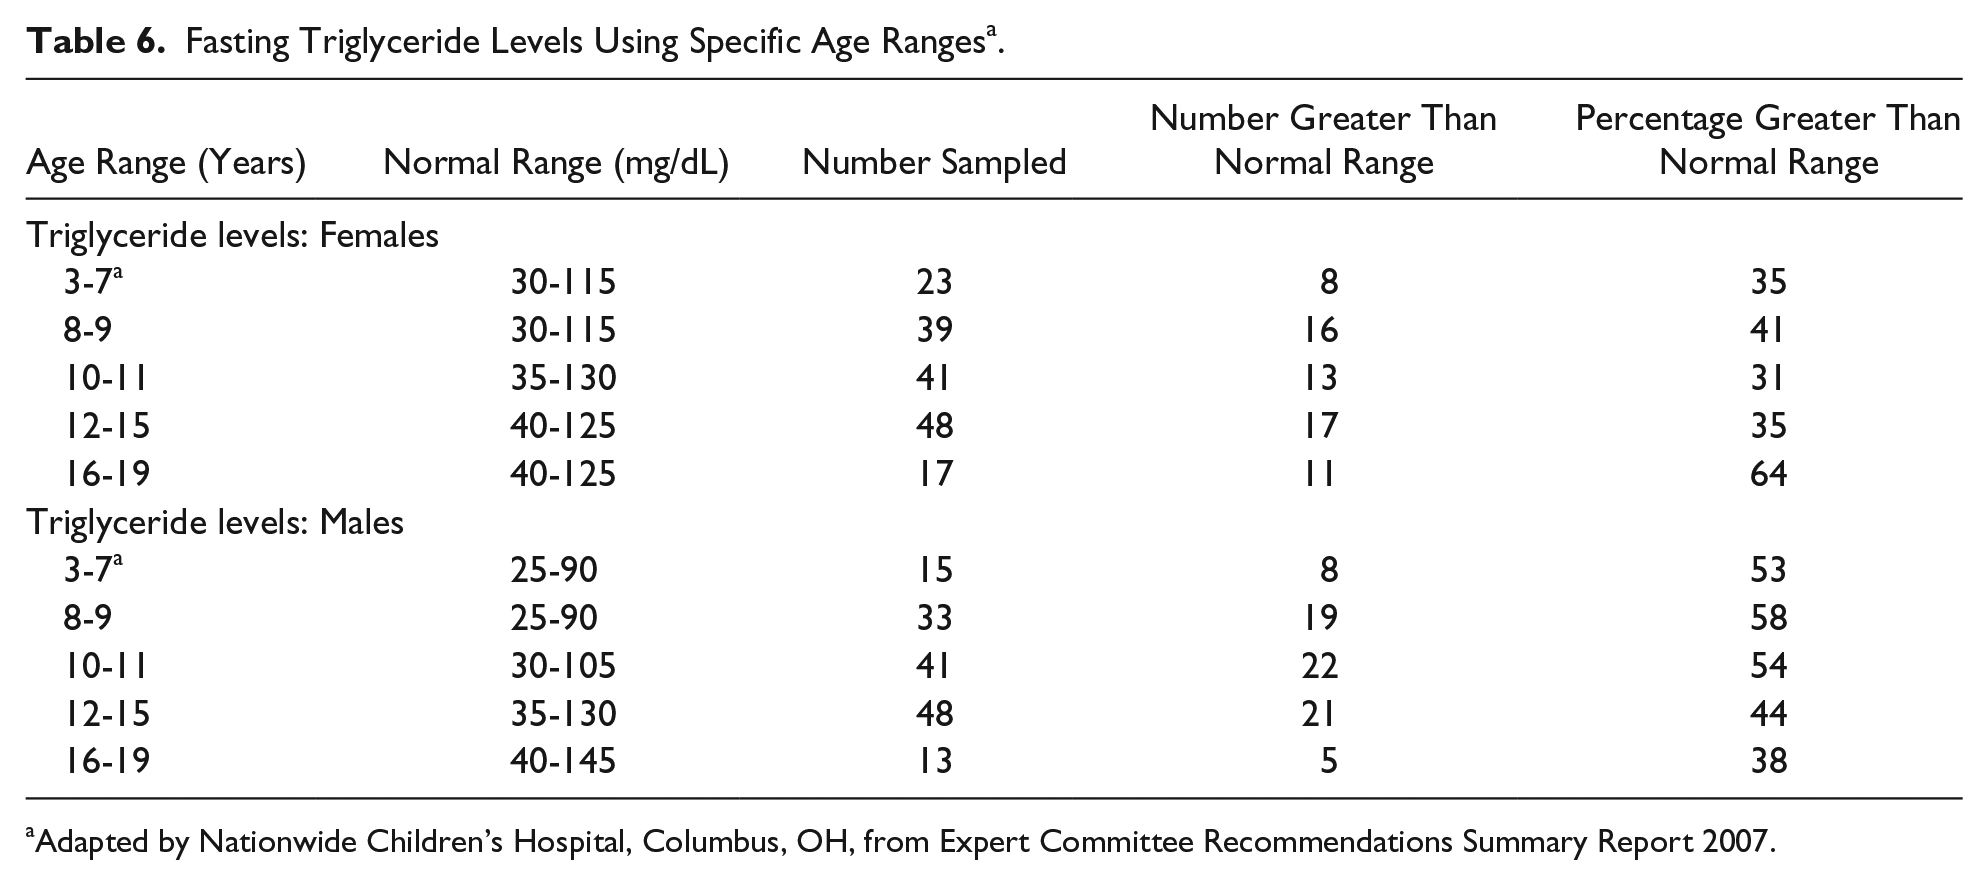
Adapted by Nationwide Children’s Hospital, Columbus, OH, from Expert Committee Recommendations Summary Report 2007.
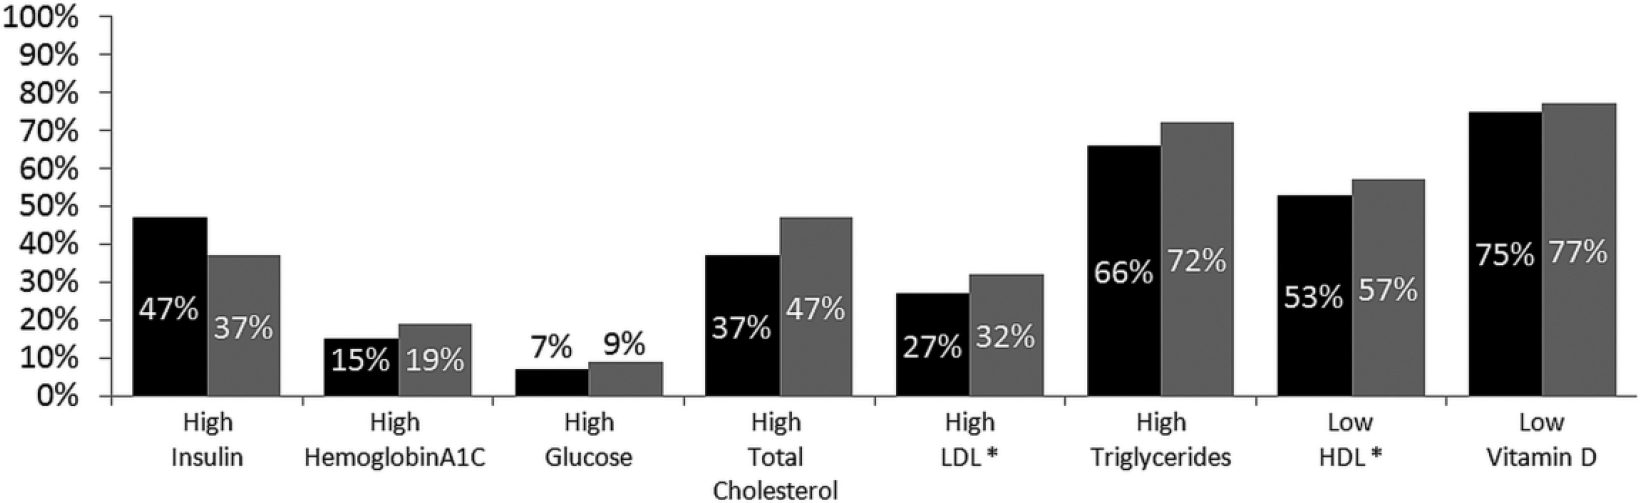
Proportions representing children with abnormal or at-risk values for each cardiometabolic risk factor stratified by gender.

Proportions representing children with abnormal values for each cardiometabolic risk factor stratified by age category.

Proportions representing children with abnormal values for each cardiometabolic risk factor stratified by obesity class at baseline.
Bivariate Analyses
Gender
The proportion of boys with high risk or abnormal levels was higher than the proportion of girls for all CM risk factors measured except fasting insulin; however, the differences were not statistically significant (Figure 1). Mean levels for each CM risk factor were also worse in boys than in girls but differences were not significant (data not shown).
Age Category
Children between the ages of 6 and 14 years represented 80% of the current study cohort. Although the sample sizes were different for each age category, our results indicate the presence of CM risk in all age groups in the children referred to the weight management clinic. The proportion of children with high risk or abnormal levels of fasting insulin and triglycerides increased with age but was not statistically significant (Figure 2). Additional information on the association between age and CM risk is presented in Figure 2.
Obesity Class
Proportions of treatment seeking children with abnormal fasting insulin increased with increase in obesity severity, as shown in Figure 3. All obesity classes showed at least 20% of children or adolescents with high risk or abnormal levels per comorbidity tested, with the exception of impaired fasting glucose and HbA1c (Figure 3). However, there was no statistically significant difference among the proportions of children with abnormal levels across obesity classes (data not shown).
Logistic Regression
The results from the binary logistic regression models are shown in Table 7 for each outcome variable. Gender, age, and obesity class were independently associated with high risk or abnormal insulin levels in our sample. Girls had greater odds of abnormal insulin levels (odds ratio [OR] = 2.0, 95% confidence interval [CI] = 1.16-3.4), while boys had greater odds of presenting with elevated total cholesterol (OR = 1.72, 95% CI = 1.08-2.7) at the time of enrollment into the weight management clinic. Adolescents between the ages of 15 and 19 years had greater odds of presenting with elevated insulin compared to 3 to 5 year olds (OR = 21.73, 95% CI = 2.31-200); however, 9% of the 3 to 5 years olds in our sample presented with elevated insulin (Figure 2), and with combined elevated insulin (OR = 3.07, 95% CI = 1.4-6.75), LDL (OR = 2.64, 95% CI = 1.29-5.43) and triglycerides (OR = 2.33, 95% CI = 1.02-5.34) when compared with 6 to 11 year olds. Fifteen to 19 year olds also had 3 times greater odds of high LDL compared to children aged 12 to 14 years (OR = 3.71, 95% CI = 1.6-8.62). Obesity class III had higher odds than class II (OR = 2.16, 95% CI = 1.12-4.18), class I (OR = 2.49, 95% CI = 1.14-5.4), and overweight (OR = 3.8, 95% CI = 1.4-6.75) in having high insulin; twice likely than class II for having low HDL (OR = 2.02, 95% CI = 1.13-3.63); and twice likely than class I in having high triglyceride (OR = 2.59, 95% CI = 1.27-5.29). Results for logistic regression models of all CM comorbidities tested are presented in Table 7.
Adjusted Odds Ratios (95% Confidence Intervals) for Cardiometabolic Risk Factors Among Children and Adolescents Enrolled in the Study Cohort.
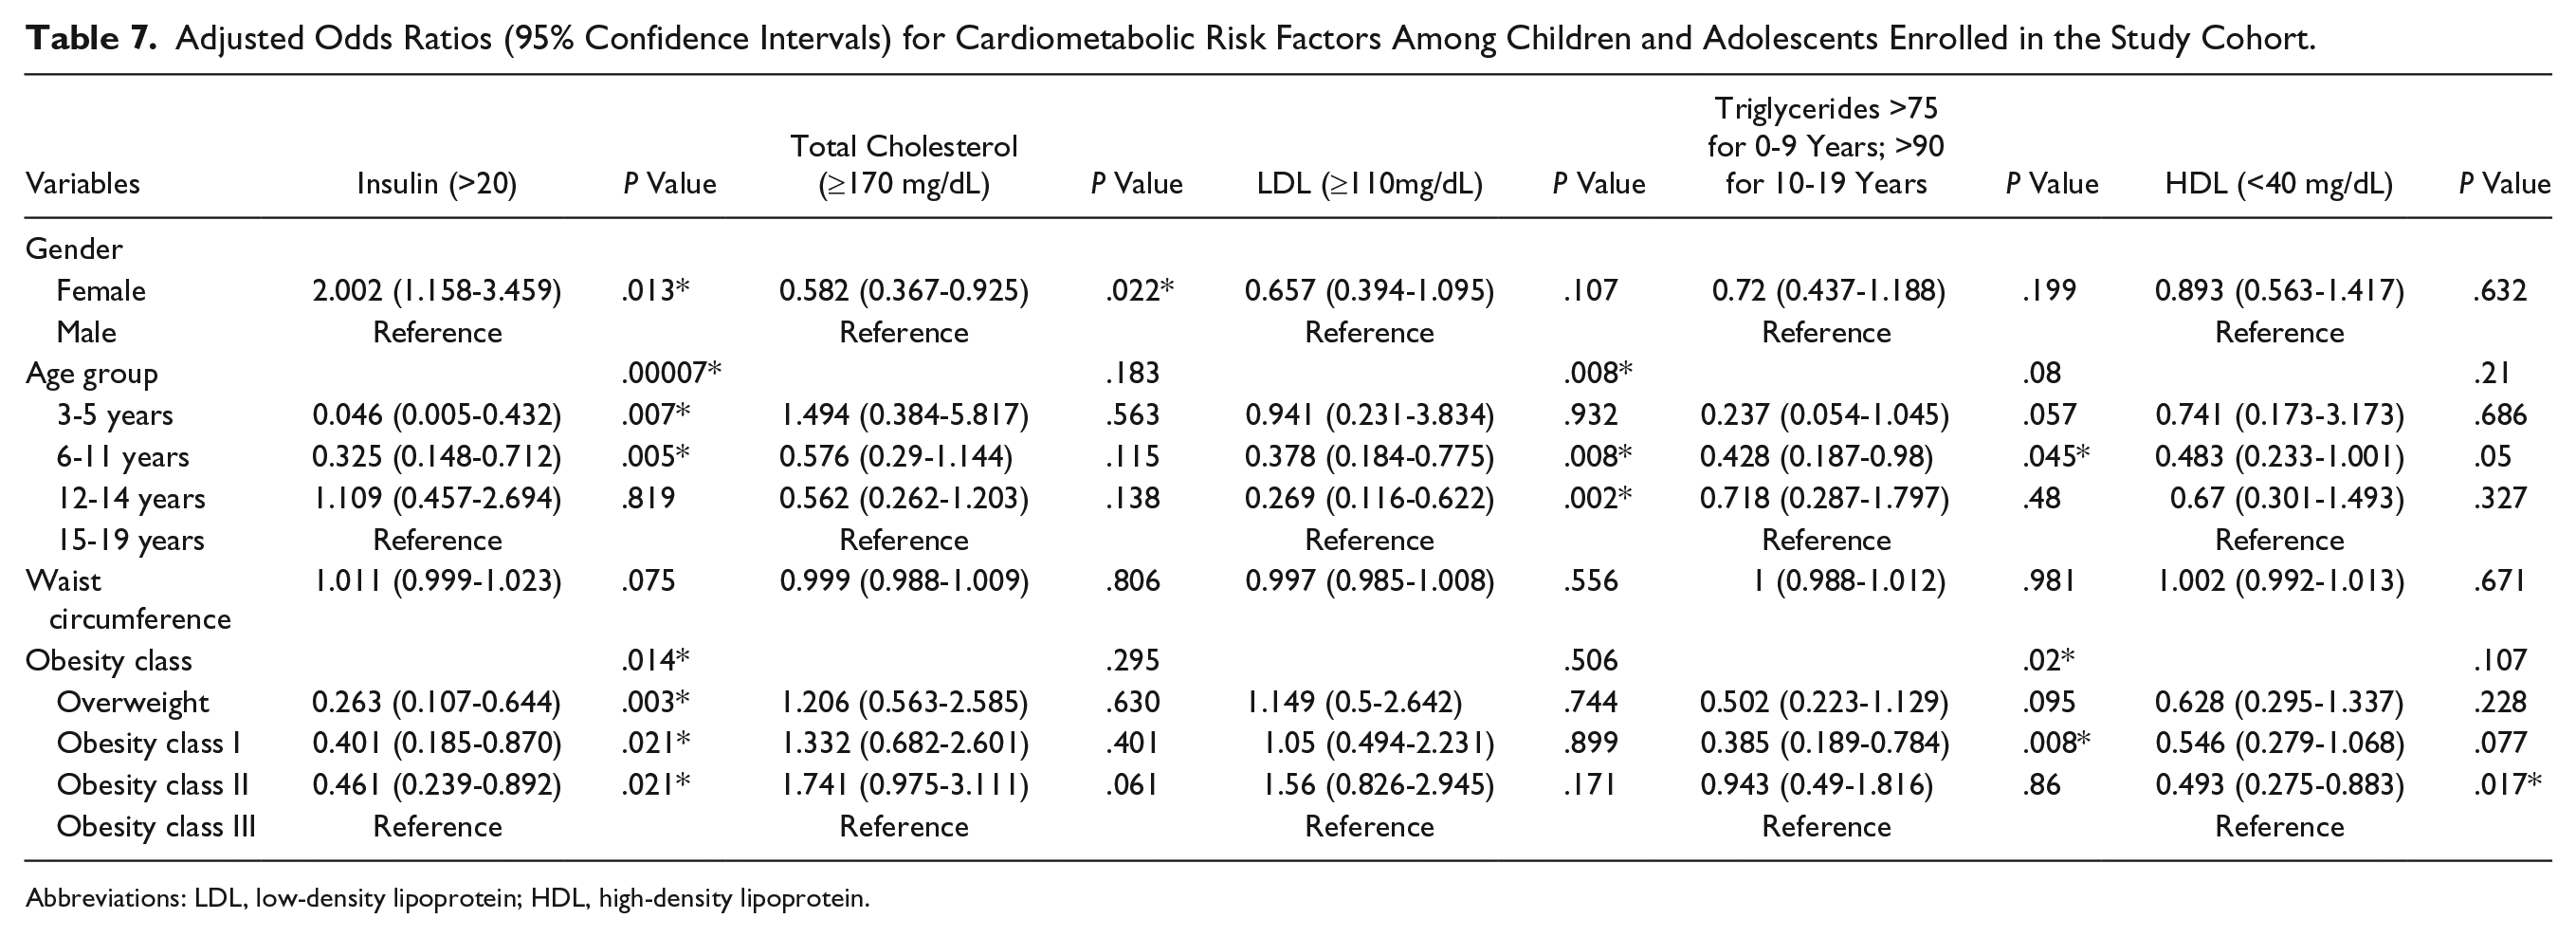
Abbreviations: LDL, low-density lipoprotein; HDL, high-density lipoprotein.
Discussion
While adolescents and obesity class III categories have significant CM risk, the burden in younger and less severe obesity cohorts cannot be underestimated. In this descriptive study, we examined the prevalence of obesity-related CM risk factors using CM laboratory metrics in 3 to 19 year olds referred to a rural pediatric multidisciplinary weight management program by gender, age, and obesity class. To our knowledge, this is the first study reporting CM risk prevalence in rural United States that includes preschool-aged children.
Gender
The relationship between gender and obesity CM risk factors is mixed in the literature.2,4,21,22 Contrary to our findings, Li et al found boys more likely to have low HDL and high fasting glucose and girls were more likely to have higher total cholesterol levels. 5 Calcaterra et al found the prevalence of female gender grew as obesity severity increased, 3 but this was not evident in our data. Skinner et al examined CM risk variables using National Health and Nutrition Examination Survey (NHANES) data from 1999 to 2012, finding elevated levels of triglycerides and HbA1c in males with severe obesity, 9 which was similar to our study. Characteristics of youth enrolled in the Pediatric Obesity Weight Evaluation Registry (POWER), a cohort of pediatric multidisciplinary weight management programs in the United States, were described by obesity class and gender. 23 At presentation to a weight management program, more males were in obesity class III than other obesity classes. 23 These studies contrast other reports that did not find an association between gender or obesity with CM risk factors.2,4 When combining obesity class II and class III categories, 64% of boys and 64% of girls in our cohort were in this severe obesity group. More males than females presented with high risk or abnormal levels of all CM comorbidities studied with the exception of fasting insulin where the proportions were 47% (girls) and 37% (boys), respectively (Figure 1).
Normal-weight children exhibit transient insulin resistance during puberty. 24 Insulin resistance increases at onset of puberty, peaking at mid puberty, and returns to near prepubertal levels at the end of puberty. 25 Pilia et al studied insulin resistance in children with obesity across puberty; they concluded that in their cohort, insulin resistance exists in prepubertal ages, elevates during puberty, and does not return to prepubertal levels postpuberty. 26 Tobisch et al also found a pattern of dyslipidemia and insulin resistance in prepubertal children. 27 Our data, when broken down by age range, supports these data. A limitation of our data is that Tanner scores were not used; our data are arranged by age (Table 5).
Pinhas-Hamiel et al examined changes in lipid profiles at different stages of puberty in children with obesity. 28 In their data, triglyceride levels remained elevated across age and pubertal stages; similar trends were found in both boys and girls. Our data (Table 6) reflect these observations; over 30% of girls and 45% of boys in our cohort had abnormal triglycerides throughout the pubertal period.
Age
Li et al examined the relationship between weight status and demographics with CM risk factors in youth using NHANES data. 5 They found differences in risk by age group; older (12-19 year olds) youth were more likely to have low HDL than their younger counterparts (6-11 years old). A similar trend was found in our data; 60% in the older age group (12-19 years) had low HDL as compared to 50% in the 6 to 11 years age groups (Figure 2).
A retrospective study by Jasik et al assessed youth in the POWER cohort, examining the relationship between obesity class and age. 23 They found younger patients (3-5 years, n = 452) were more likely to present with obesity class III than older youth (47% vs 38%, respectively). In our data, 35% of our youngest children (age 3-5 years; n = 22) presented with obesity class III with 26% among 6 to 11 years, 37% among 12 to 14 years, and 28% among 15 to 19 years. Sixty-five percent of children 3 to 5 years presented with severe obesity (obesity class II or class III); similar percentages of class II and class III were found for each of the older age groups.
Obesity Class
Prevalence of obesity-related CM comorbidities is elevated in youth with overweight, obesity, or severe obesity.3-5,9,22,23,29 Salvatore et al performed a retrospective review of 101 children seen at a pediatric weight management program with the aim of determining obesity-related CM comorbidities and relationships with obesity class. 29 While seeing a trend toward increasing prevalence of comorbidities with obesity class, these trends were not statistically significant. Calcaterra et al studied the prevalence of metabolic syndrome (characterized by at least 3 of 5 defined CM risk factors) and its association with degree of obesity in 191 Caucasian children and adolescents in Italy; data were compared to a control group. 3 Subjects exceeded the 97th percentile for age and sex and were classified with moderate or severe obesity using z scores of 2 to 2.5 or >2.5, respectively. Obesity metabolic risk factors increased with the degree of obesity. Li et al examined the relationship between and within weight status and metabolic risk factors, evaluating the odds ratio for increased metabolic risk with higher obesity class, which was positive. 5 Although the literature suggests that comorbidity prevalence tends to increase with obesity severity, our data show disease burden staggered in all classes, including overweight and obesity class I with exception of fasting insulin and HbA1c variables (Table 7; Figure 3).
Vitamin D (Serum 25(OH)D)
Using 2003 to 2006 NHANES pediatric data, Turer et al studied the prevalence of vitamin D insufficiency (21-29 ng/mL) and deficiency (≤20 ng/mL) among weight classes. 30 Using the categories of overweight, obese, and severely obese, their data found vitamin D deficiency was 29%, 34%, and 49%, respectively. Our data were similar in lower weight categories, but higher (67%) for severe obesity (obesity classes II and III combined).
In adults, vitamin D deficiency and insufficiency have been associated with adiposity, 31 cardiovascular disease, 32 and insulin resistance. 33 Some literature in youth shows a moderate, negative correlation between vitamin D deficiency and insulin resistance, some differing with pubertal stage.34,35 Others have found little correlation between these variables and have called for further research. 36
Ganji et al reexamined the assay-adjusted 25(OH)D pediatric data from NHANES 2001 to 2006 searching for associations between vitamin D deficiency and CM risk factors. 37 While causality was not able to be determined, the authors concluded that children with vitamin D deficiency are at increased risk of several CM risk factors, in particular, metabolic syndrome and insulin resistance.
Overall
Friedemann et al, using systematic review and meta-analysis design, described the association and magnitude between obesity category, gender, and CM risk factors in school-aged children. 21 They conclude that children with overweight and obesity have increased risk compared to normal-weight children but that the exact age at which these risks begin needs to be established. Current USPSTF guidelines suggest screening children for these risk factors at age 6 years 10 ; the AAP’s Institute for Healthy Weight advises that some resources suggest screening at 2 years of age, based on the patient’s health risk 38 ; this statement is based on the original AAP Expert Committee guidelines, 11 which recommend testing fasting lipids for children over the 85th percentile of weight.
Cardiometabolic risk is present in each gender, age group, and obesity class in our study. In the youngest group (3-5 year olds; n = 22), 48% have elevated lipids with 29% insulin resistant. Data in 6 to 11 year olds in our cohort (n = 214) show 33% are insulin resistant, with abnormal triglycerides, HDL, and total cholesterol at 64%, 50%, and 40%, respectively. Our data support that children aged 3 years and older in overweight and obesity weight categories who are referred for treatment should be assessed for CM risk factors.
Limitations
Our study has several limitations. Prospective data include all youth presenting to our clinic since inception November 2009 through March 2016. Early program completeness of CM laboratory values was hindered as not all children were screened for all CM risk factors in this study. Laboratory testing of the children was at the discretion of the attending physician, often taking into account reimbursement and family preference; in later years of the study, laboratory testing consistent with national standards became our standard protocol. Data represent only a convenience sample of children and youth referred to our rural clinic and are not representative of all children with overweight and obesity in the region. We did not use a control group to compare children of normal weight to those of elevated weight. However, the goal of our study was to examine the variance in CM risk within obesity categories. Demographically, our cohort was 92% Caucasian and 94% non-Hispanic, which represents our state’s ethnicity but limits national generalizability. Analyses have certain limitations due to missing data and unequal sample sizes. However, missing values were at random and did not seem to contribute to over or underrepresentation of any categories or groups.
Conclusion
Children with BMI ≥85th percentile of CDC growth charts in each gender, age group (including 3-5 year olds), and obesity weight class present with significant CM disease burden, particularly hyperinsulinemia, hypertriglyceridemia, and elevated triglyceride/HDL ratio as well as vitamin D deficiency. Ninety-two percent of children screened for CM risk factors, excluding vitamin D, had one or more abnormal levels for the CM risk factors examined. Our data highlight the existing abnormal laboratory data and disease burden in pediatric patients with obesity presenting to a rural AAP Stage 3 pediatric weight management clinic. Providers caring for children with a BMI ≥85th percentile of CDC growth charts should consider laboratory assessment for specific obesity-related CM risk factors with a goal of early medical obesity management and referral to higher intensity interventions as outlined by the USPSTF guidelines.
Author Contributions
VO: Contributed to conception and design; contributed to acquisition, analysis, and interpretation; drafted manuscript; critically revised manuscript; gave final approval; agrees to be accountable for all aspects of work ensuring integrity and accuracy.
NB: Contributed to conception and design; contributed to acquisition, analysis, and interpretation; drafted manuscript; critically revised manuscript; gave final approval; agrees to be accountable for all aspects of work ensuring integrity and accuracy.
SF: Contributed to conception and design; contributed to acquisition, analysis, and interpretation; drafted manuscript; critically revised manuscript; gave final approval; agrees to be accountable for all aspects of work ensuring integrity and accuracy.
BS: Contributed to conception and design; contributed to analysis and interpretation; critically revised manuscript; gave final approval; agrees to be accountable for all aspects of work ensuring integrity and accuracy.
JB: Contributed to conception and design; contributed to analysis and interpretation; critically revised manuscript; gave final approval; agrees to be accountable for all aspects of work ensuring integrity and accuracy.
SJ: Contributed to conception and design; contributed to acquisition, analysis, and interpretation; drafted manuscript; critically revised manuscript; gave final approval; agrees to be accountable for all aspects of work ensuring integrity and accuracy.
KH: Contributed to conception and design; contributed to analysis and interpretation; critically revised manuscript; gave final approval; agrees to be accountable for all aspects of work ensuring integrity and accuracy.
Footnotes
Acknowledgements
The authors wish to thank our colleagues Lauri Jacobs, RD, dietician; Diana Prescott, PhD, psychologist; Gail Tudor, PhD, biostatistician; and Ashton Ortiz and John Royal, BS, interns at the EMMC Clinical Research Center for their support and assistance.
Declaration of Conflicting Interests
The author(s) declared no potential conflicts of interest with respect to the research, authorship, and/or publication of this article.
Funding
The author(s) received no financial support for the research, authorship, and/or publication of this article.