
Abstract
Introduction
Epidemiologic evidences from the past decades suggest a strong association between low birth weight and some diseases in adult life (ie, obesity, hypertension, diabetes, and cardiovascular diseases). 1 Obesity and metabolic syndrome are strongly correlated with small for gestational age (SGA) status at birth and a rapid gain in weight during infancy and early childhood. 2 The risk of obesity and, later, of type 2 diabetes seems particularly high when there is catch-up growth early in postnatal life, a model of accelerated growth that is common in individuals born SGA.3-6 Independently of catch-up growth timing, the dynamic process is characterized by a deposition rate of fat disproportionately quickly in relation to the index of lean body mass. There are several causes for the birth of a child SGA, such as nutritional factors, placental factors (such as abnormal uterine-placental blood flow), and inherited genetic mutations.7-13
The Italian Setting of National Health Service
The Italian National Health Service is structured into geographical areas, defined as Local Health Authority (Azienda Sanitaria Locale). This Health Service System provides a pediatrician to each child from 0 to 14 years, as well as a general practitioner to adults. In this health system each Italian child has a programmed number of medical periodical visits, the pediatric checks called “Bilanci di salute.” These visits occur at 1, 2, 5, 12, 15, 24, 48, 60, 120, and 144 months. This particular setting allowed us to design a primary care–based study to identify the obesity outbreak age in SGA population using a longitudinal study.
Study Aims
The aim of this study was to establish the prevalence and the natural history during childhood of obesity and overweight in 400 children born SGA.
Setting
The setting was the Pediatric Primary Office of 8 pediatricians in the Naples area. The pediatricians group that took part in the study has been previously trained in standardized auxological surveying techniques during the formative years at the Pediatric Department “Federico II” of University in Naples.
Research Strategy and Case Definition
Data were collected and selected from our databases (Infantia software and Junior Bit software). Those data corresponded at the evaluations at the age of 24, 60, and 120 months. Collection of data had been carried out through identification “problems oriented” according to the International Statistical Classification of Diseases and Related Health Problems (ICD-9). 14 All patients were living in Naples province, in Regione Campania. Infants were defined as SGA if their birth weight was equal or below the sex-specific 3rd percentage for gestational age in the general Italian population and if they were between 37 and 39 weeks of gestational age; according to Bertino et al, 15 infants were defined as appropriate for gestational age (AGA) if their birth weight was over the sex-specific 3rd percentage for gestational age in the general Italian population. This definition of SGA children is from the Consensus Conference 2009 6 and is similar to −2 SD (standard deviations) from the mean. Four hundred children born SGA (208 males,192 females) and 6818 children born AGA (3316 males, 3502 females) were observed from birth up to the age of 10 years. In order to select representative samples of early, middle, and late childhood, we chose the checks that are performed at the age of 24, 60, and 120 months for which data were available regarding the measure of weight/height. We calculated body mass index (BMI) according to Centers for Disease Control and Prevention growth charts, 16 and percentage of overweight and obesity at different ages in our sample, both SGA and AGA, both transversely to the age filter (24, 60, and 120 months) and in a longitudinal study, to identify individuals who were beginning to be obese and remained such at various ages (24, 60, and 120 months). For overweight we have evaluated the BMI as BMI z-score 1.13 to 1.7. For obesity we have evaluated the BMI as BMI z-score >1.7. 17
Statistical Analysis
Statistical analysis was performed by the Studies FIMP using MED CAL 3000 18 and EpiData 3.0 19 software. We evaluated percentage, RR (relative risk), and ARR (adjusted relative risk) of obesity and overweight among SGA and AGA children.
Results
Transversal Evaluation
SGA girls, despite a trend to higher obesity prevalence to the age 2 and 5 years, compared to equal age AGA girls (respectively, 5.2% vs 3.6% [RR = 1.4 ] at 2 years and 28.7% vs 23.6% [RR = 1.2 ] at 5 years) without statistical significance (P = .2 and P = .1, respectively), only at the age of 10 years had significantly higher obesity prevalence (29.12% vs 12.7% [RR = 2.3, P < .000 ]). See Figure 1.

SGA versus AGA females’ obesity.
The risk of becoming obese at 10 years for SGA females is twice that for equal age AGA females. Although we can already see the trend toward higher prevalence of obesity at 2 and 5 years, at age 10 the risk of becoming obese is twice that for females born AGA.
At the age of 10, SGA females’ obesity prevalence is statistically higher than equal age AGA females’ prevalence (29.12% vs 9.1% [RR = 3.2, P < .0001]). Even for overweight at 10 years the prevalence among SGA-born females is significantly higher than that for the AGA-born females (see Figure 2).

SGA versus AGA females’ overweight.
Obesity prevalence in SGA males versus AGA males is significantly higher in all the age groups we studied. Males at age 2, 5, and 10 years (3.9% vs 1.6% [RR = 2.4, P = .01] at 2 years; 27.4% vs 20.6% [RR = 1.3, P = .01] at 5 years; and 28.4% vs 22.2% [RR = 1.3, P = .03] at 10 years). See Figure 3.
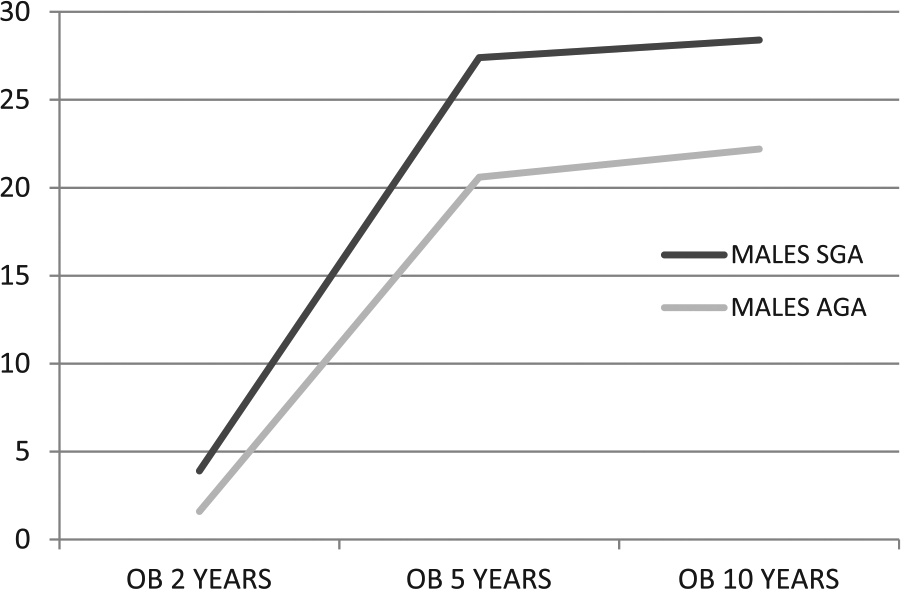
SGA versus AGA males’ obesity.
There is no significant difference in overweight prevalence at 2 and 5 years, while at 10 years SGA males’ overweight prevalence is higher than AGA males’ prevalence (42.8% vs 30.1% [RR = 1.3, P = .0001]). See Figure 4.

SGA versus AGA males’ overweight.
Finally, the ARR (for the variables age, sex, risk of being obese in adulthood) for SGA subjects of becoming obese is clearly significant (ARR = 1.4 [95% confidence interval (CI) = 1.3-1.6, P < .0001]), while the risk of being overweight is not significant (ARR = 1.1 [95% CI = 0.96-1.3, P = .1]).
Longitudinal Evaluation
Nine of 56 SGA females (16.1%) become obese at 2 years and are still obese at 10 years; among AGA females, 127/445 (28.5%) become obese at 2 years and they are still obese at 10 years; 46/56 (82.1%) SGA females become obese at 5 years and will remain so even at 10 years. Seven hundred of 827 (72.5%) AGA females become obese at 5 years but 191/700 (19.7%) of them at the age of 10 years will no longer be obese. One of 56 (1.8%) SGA females become even obese 10 years as opposed to age-matched AGA females (Table 1).
SGA/AGA Obesity and Overweight at 2, 5, and 10 Years.
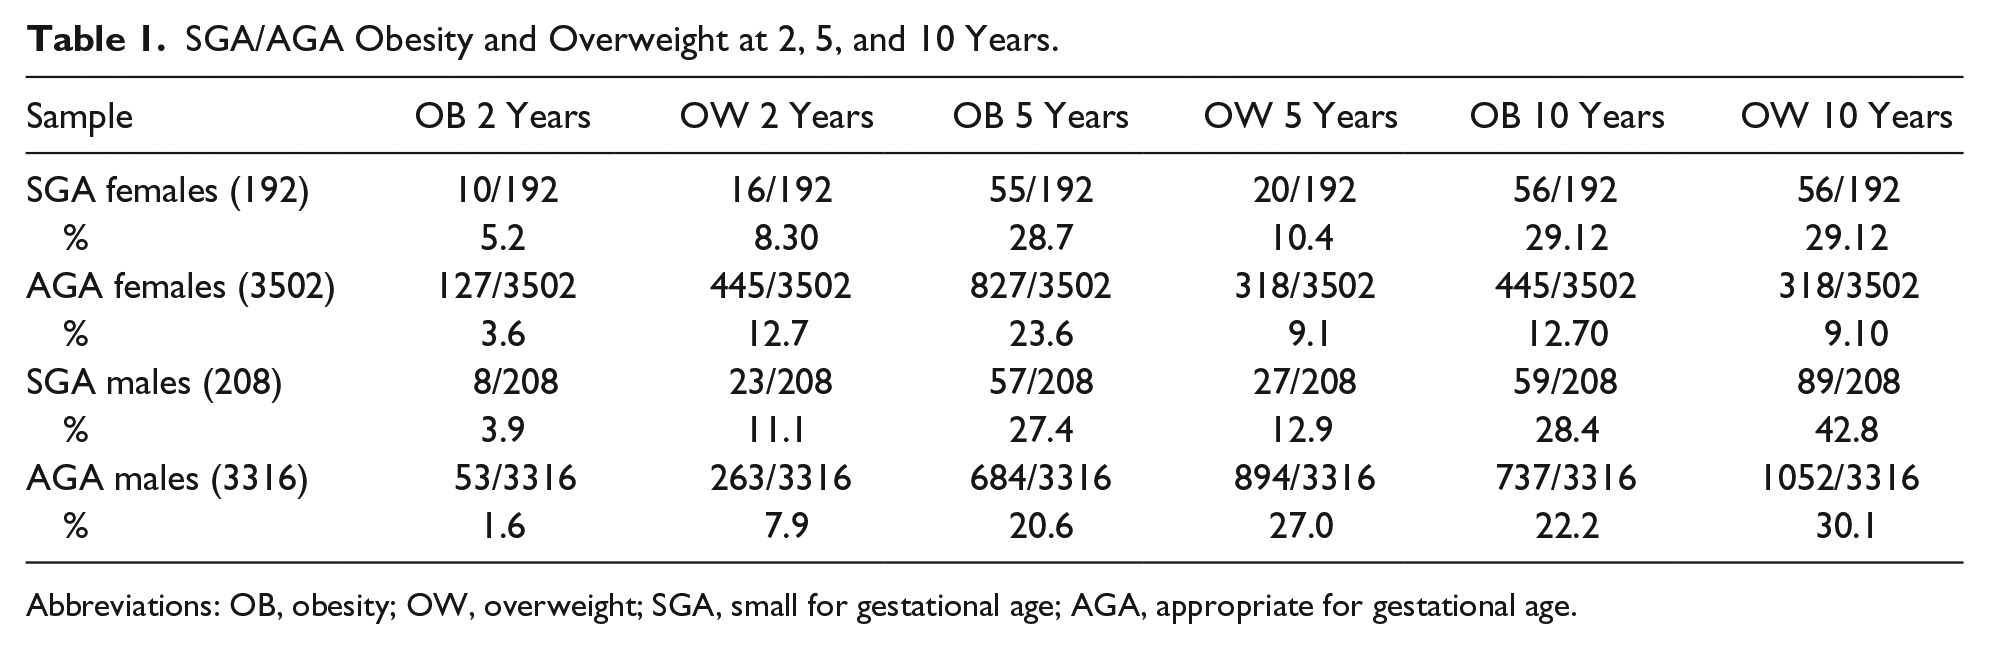
Abbreviations: OB, obesity; OW, overweight; SGA, small for gestational age; AGA, appropriate for gestational age.
In fact, in our evaluation, there were no AGA females who become obese at the age of 10 years; there is, instead, analyzing the data latch, a reduction of 40% among obese AGA females (827 to 5 years, 445 to 10 years). Two of 59 (3.3%) SGA males become obese at 2 years and remain so up to 10 years; 52/737 (7.1%) AGA males become obese at 2 years and remain so up to 10 years. Forty-three of 59 (72.9%) SGA males become obese at 5 years and remain obese up to 10; 615/737 (83.4%) AGA subjects become obese and remain so between 5 and 10 years. Fourteen of 59 (23.7%) SGA males become obese at 10 years while 70/737 (9.5%) of the same age AGA males become obese at 10 years. Ultimately SGA males begin to be obese at 2 years and gradually increase up to 10 years although they have the maximum peak at 5 years. The AGA males are more obese at 2 years, they remain as such at 5 years, but they have a decrease of their obesity at 10 years. At 2 years of age, prevalence of the obese SGA females was 16.1% compared to 28.5% of equal age AGA females. At the age of 5 years in SGA females obesity prevalence was 82.1% compared to 71.5% of equal age AGA females. At 10 years, SGA females undergo further prevalence increase of 1.8% while equal age AGA females have an obesity reduction of 40% compared to their percentage at 5 years (see Figure 5).

Trend BMI for SGA/AGA females, 2 to 10 years.
In male subjects, at 2 years of age the SGA obesity prevalence was 3.3% compared to 7.1% of equal age AGA children. At 5 years SGA males’ obesity increase to 72.9% and at 10 years there is a further increase to 23.7%. The same age AGA males have an obesity percentage at 5 years equal to 83.9% that is reduced to 9.5% at 10 years (see Figure 6).

Trend BMI for SGA/AGA males, 2 to 10 years.
Discussion
Our study, comparing SGA children with the AGA children of the province of Naples, confirms the need of alert that is stressed in the worldwide literature about the increasing risk of obesity in SGA-born subjects during childhood. The risk that an infant born SGA might become a child and, likely, an adolescent obese is greater than the child that weighted at birth more than 2.5 kg. Our data showed, in the transversal analysis, that SGA females are significantly more obese and overweight at the age of 10 years and that SGA males are more obese in all ages considered. For both SGA females and males there was no significant difference with AGA children in overweight prevalence. Because the Campania Region (Italy) is well-known for the problem of the strong increase of overweight and obesity in the last decade, 20 it is likely that the lack of significant difference in overweight between SGA and AGA children actually is due to the high incidence of AGA overweight. The longitudinal analysis highlights that SGA children are already obese at 2 years and remain so until the age of 10 years. In fact, while the AGA child loses excess weight at the age of 10 years, the SGA child continues to accumulate weight from 2 years until to 10 years.
Even this analysis hits the high overweight and obesity prevalence in AGA children at the age of 5 years. It would be interesting to evaluate the same data in regions where there was no similar increase in incidence of overweight and obesity. In the Pediatric Primary Care we observe a certain number of patients born SGA/IUGR, for whom, according to the literature, it would be useful to take a wide approach, allowing to identify patients with high catch-up growth, carefully monitor children’s weight during the years following the birth, and fully understand the importance of the altered tolerance to glucose, so as to prevent metabolic syndrome and cardiovascular diseases.21-23
Conclusions
SGA children, boys and girls, are more frequently obese, allowing to identify patients with high catch-up growth, carefully monitor children’s weight during the years following the birth, and fully understand the importance of the altered tolerance to glucose, so as to prevent metabolic syndrome and cardiovascular diseases at 5 and 10 years of age compared to the AGA population (ARR = = 1.45 [95% CI = 1.45-1.6, P < .00001]). The obesity risk increases with age. There is no difference concerning overweight between SGA subjects and AGA subjects, likely due to high overweight prevalence in the pediatric Campania population. The examination of 10 years of longitudinal data has allowed us to also describe the natural history of obesity and overweight in children born AGA in our socioeconomic reality, characterized by a marked increase in obesity and overweight in the past 2 decades. Although the pathogenic mechanisms behind the base of the risk of obesity in children born SGA are still unknown, pediatric primary care can have a major role in prevention, through early intervention aimed at preventing rapid weight gain during early childhood and encouragement of more healthy life by transmitting to parents and children right messages on nutrition and encourage physical activity in children born SGA and AGA.
Author Contributions
PG contributed to conception and design; contributed to acquisition, analysis, and interpretation; drafted manuscript; critically revised manuscript; gave final approval; agrees to be accountable for all aspects of work ensuring integrity and accuracy.
LC contributed to design; contributed to acquisition, analysis, and interpretation; drafted manuscript; critically revised manuscript; gave final approval; agrees to be accountable for all aspects of work ensuring integrity and accuracy.
RL contributed to acquisition; gave final approval; agrees to be accountable for all aspects of work ensuring integrity and accuracy.
EF contributed to acquisition; gave final approval; agrees to be accountable for all aspects of work ensuring integrity and accuracy.
VB gave final approval; agrees to be accountable for all aspects of work ensuring integrity and accuracy.
RS contributed to acquisition; gave final approval; agrees to be accountable for all aspects of work ensuring integrity and accuracy.
MDG contributed to acquisition; gave final approval; agrees to be accountable for all aspects of work ensuring integrity and accuracy.
VG contributed to interpretation; gave final approval; agrees to be accountable for all aspects of work ensuring integrity and accuracy.
AD contributed to acquisition; gave final approval; agrees to be accountable for all aspects of work ensuring integrity and accuracy.
SDM contributed to analysis and interpretation; critically revised manuscript; gave final approval; agrees to be accountable for all aspects of work ensuring integrity and accuracy.
Footnotes
Declaration of Conflicting Interests
The author(s) declared no potential conflicts of interest with respect to the research, authorship, and/or publication of this article.
Funding
The author(s) received no financial support for the research, authorship, and/or publication of this article.