
Abstract
Malnutrition is a significant issue among elderly individuals in 24-hour care facilities, leading to increased morbidity. The aim of the study was to compare the nutritional status before and after nutritional intervention based on selected indicators of nutritional status among residents of a 24-hour care institution. The study included a group of 104 people aged 65 to 97 years. Nutritional status was assessed before and after the nutritional intervention based on indicators: levels of prealbumin, albumin, transferrin, total lymphocyte count, BMI, and MNA scale. The nutritional intervention consisted of administering oral nutritional supplements (ONS) to patients, regardless of nutritional status. The method of retrospective analysis of patients' medical records was used. Statistical analysis was performed using IBM SPSS Statistics 24 for Windows. Improvements in nutritional status occurred among patients with malnutrition based on MNA and prealbumin indices, and in groups of patients with moderate or mild malnutrition as determined by transferrin, prealbumin and albumin. The mean levels of nutritional indices significantly increased: MNA (p = .001), BMI (p = .001), prealbumin (p = .001), and albumin (p < .001). The use of ONS resulted in better nutritional status parameters based on MNA, albumin and prealbumin. These indices may be predictors of reducing the risk of various disorders among the elderly.
Introduction
The United Nations General Assembly has declared 2021 to 2030 as the “U.N. Decade of Action for Healthy Aging.” The U.N. resolution pointed out that despite the knowledge of aging populations and the acceleration of this phenomenon, the world is not sufficiently prepared to adequately respond to the needs of the elderly. Healthy aging should be a priority in all countries. In view of the situation related to the steady increase in the number of elderly people, the problem of seniors’ independent living may arise, especially those requiring care, treatment and rehabilitation (Da Silva et al., 2021; Ory & Smith, 2022).
Adequate physical functioning, nutrition and nutritional status are important factors in the pathogenesis of many diseases during any period of life, but especially during aging. Assessment of nutritional status is a component of the comprehensive geriatric assessment (COG). Malnutrition is a strong predictor of death in the elderly due to increased incidence of infections, occurrence of sarcopenia, reduced immunity and poorer response to medical management (Karlsson, 2021).
Diet is an extremely important element in the process of maintaining proper nutritional status. However, there are situations when it is no longer possible to achieve this goal with conventional products. Medical nutrition, including oral nutritional supplements, then comes to the rescue. According to the definition of the European Society for Clinical Nutrition and Metabolism (ESPEN), oral nutrition supplements (ONS) are agents that come in liquid, semi-liquid or powdered form and are intended to provide energy and nutrients (Cederholm et al., 2017).
Oral nutritional supplements are a very diverse group of products, so they can meet the needs of different patients. ONS are also differentiated in terms of nutritional value such as normo- and high calorie formulas, as well as those with reduced or increased protein or fat content. Some are enriched with functional components (e.g., fiber, fatty acids or amino acids), while in others the amount of specific components is reduced (e.g., products with reduced electrolytes). The main recommendation for the use of ONS is existing malnutrition or the risk of developing it in the elderly (Cederholm et al., 2017; Chew et al., 2021).
The motivation for the study was to highlight the prevalence of malnutrition and the risk of malnutrition among the elderly, including those residing in 24-hour medical facilities with dietary plans determined by medical staff. However, a number of other factors also affect their nutritional status. These are due to various limitations related to food intake and the pathophysiological process of aging and its consequences. Therefore, it is essential to properly and systematically monitor the nutritional status of the elderly, detect the risk of malnutrition early and take appropriate preventive and therapeutic measures.
Therefore an attempt was made to assess the nutritional status among residents of a 24-hour care facility, then the nutritional intervention in the form of ONS was applied and the nutritional status was monitored again. The premise was to verify if there would be an improvement in nutritional status after ONS application. Improved parameters of nutritional status would allow a general recommendation of the use of such preparations in the daily diet to improve nutritional status and prevent and thereby reduce the risk of various complications in a situation of malnutrition and its risk. Malnutrition is a costly and dangerous condition affecting up to 71% of this subpopulation. It can negatively affect the immune system and the risk of increased morbidity (Burdick et al., 2021). Therefore, it is essential to properly and systematically monitor the nutritional status of the elderly, to detect early those at risk of malnutrition and to take appropriate preventive and therapeutic measures especially in patients residing in 24-hour institutions.
Aim
The aim of the study was to compare the nutritional status before and after the ONS nutritional intervention based on selected indices such as: levels of prealbumin, albumin, transferrin, total lymphocyte count (TLC), BMI, and MNA scale among residents in a 24-hour medical care facility.
Methods
The prospective study included a group of 104 people aged 65 to 97, residing in a 24-hour medical care facility in Krakow, Poland. Women accounted for 73.1% of the respondents, and 26.9% were men. The mean age of the analyzed group of patients was 80.1 years, SD = 10.8, median = 82, quartiles: Q1 = 71.25 and Q3 = 90.
Selection criteria for the study group were: age over 65, no cancer, no objective or subjective symptoms of infection, CRP<10 mg/dl, informed consent of the patient to participate in the study, no previous nutritional intervention in the form of an industrial diet, no symptoms of gastrointestinal disorders in the form of diarrhea or vomiting, and independent intake of daily meals prepared by the institution.
The criteria for exclusion from the study were: diagnosed cancer, the presence of objective and subjective symptoms of infection, CRP>10 mg/dl, and symptoms of liver or kidney failure (abnormal liver function test values, bilirubin, urea, and creatinine levels outside the normal range), as well as any additional dietary intervention, symptoms of gastrointestinal disorders in the form of diarrhea or vomiting, age under 65, lack of independence in meal intake, and lack of consent to participate in the study.
Each patient qualified for the study group received information in oral and written form about the purpose of the study and the possible benefits of taking ONS.
From a group of 256 people staying in a 24-hour care center, 113 patients were qualified for the study in accordance with the established criteria. During the study, 2 people refused to drink ONS due to incomplete intake of the recommended portion and reluctance to take it despite being offered a choice from 4 flavors. Another 2 people were eliminated due to technical difficulties related to collecting blood samples for laboratory tests and their lack of consent to further venipuncture attempts. Among 3 people, after 4 days of taking ONS, symptoms of upper respiratory tract infections occurred (CRP > 10 mg/l), which was associated with a general lack of appetite and thus reluctance to take ONS. Two more people had a deterioration in their health, including their physical ability to take medications on their own, which, based on the established criteria, resulted in the patients’ refusal. Ultimately, the study group consisted of 104 patients.
Nutritional status was assessed twice before and 1 month after the nutritional intervention which included: measurement of height, weight and calculation of BMI, Mini Nutritional Assessment (MNA) scale results, TLC (total lymphocyte count) and laboratory tests—prealbumin, albumin, transferrin. Blood samples were collected from the patients following the laboratory procedure. A total of 4 ml of blood was collected into non-anticoagulant tubes to determine the levels of prealbumin, albumin, and transferrin. An additional 2 ml of blood was collected in EDTA (edetic acid) tubes for hematological analysis to determine the total lymphocyte count.
Subsequently, the results of BMI, MNA, and laboratory tests were analyzed, followed by the assessment of nutritional status and the classification of patients into specific nutritional status groups.
The nutritional intervention involved administering oral nutritional supplements (ONS) to all residents, regardless of nutritional status: in two servings (each serving 200 ml/600 kcal) for a period of 2 weeks according to the manufacturer’s recommendation, with the indication to take the formula between meals, sipping slowly over a period of 30 minutes to 1 hour. The formula used was a complete, hypercaloric diet, in the form of a milk drink available in flavor versions preferred by the residents. The protein source was casein, the carbohydrate source was slowly absorbed maltodextrins and sucrose. The product contained only LCT (Long-Chain Triglycerides) fats and a unique blend of fiber to regulate bowel function. By volume 100 ml of the product contained: energy value: 1005 kJ/240 kcal (12% RDI—recommended daily intake); fat 10.4 g (14.4% RDI), including saturated acids 1.1 g (5.5% RDI); carbohydrates 25.2 g (9.16% RDI), including sugars 14.1 g (28.2% RDI), lactose 0.6 g; fiber 3.6 g (12.9% RDI); protein 9.5 g (19% RDI); salt 0.21 g (3.5% RDI); vitamin A 240 mcg (26.7%); vitamin D 1.8 mcg (9% RDI); vitamin E 3 mg alpha-TE/ET (20% RDI); vitamin K 13 mcg (10.8% RDI); thiamine 0.40 mg (33.3% RDI); riboflavin 0.40 mg (30.8% RDI); niacin 2.2 mg (13.8% RDI); pantothenic acid 1.3 mg (26% RDI), vitamin B6 0.40 mg (23.5% RDI); folic acid 64 mcg (16% RDI); vitamin B12 0.50 mcg (20.8% RDI); biotin 9.6 mcg (32% RDI); vitamin C 24 mg (26.7% RDI); minerals: sodium 83 mg (3.6% RDI); potassium 229 mg (4.9% RDI); chloride 91 mg (4% RDI); calcium 174 mg (13.4% RDI); phosphorus 174 mg (13.9% RDI); magnesium 33 mg (7.9% RDI); iron 3.8 mg (21.1% RDI); zinc 2.9 mg (26.4% RDI); copper 0.43 mg (0.48% RDI); manganese 0.80 mg (34.8% RDI), fluoride 0.20 mg (5% RDI); molybdenum 24 mcg (53.3% RDI); selenium 14 mcg (25.5% RDI); chromium 16 mcg (45.7% RDI); iodine 32 mcg (21.3% RDI); choline 88 mg (16% RDI). Osmolarity: 790 m Osmol/l.
The groups according to the MNA scale were as follows: good nutritional status >24, malnutrition risk 17 to 23.5, malnutrition <17. BMI according to the basic WHO classification is: underweight < 18.5, normal value 18.5 to 24.99, overweight ≥ 25.0. The values of laboratory indicators of nutritional status are shown in Table 1 (Klek et al., 2018). The total lymphocyte count (TLC) was calculated based on the below formula.

Laboratory Indicators of Nutritional Status.

Tables with the results of the various indicators of nutritional status have taken into account data gaps due to technical reasons.
The study also used a retrospective method of analyzing patients’ medical records, using daily observation sheets and laboratory test results to evaluate the patient as part of the study group selection.
Statistical analysis was performed using IBM SPSS Statistics 24 for Windows.
The distributions of quantitative variables were described using the absolute counts of individual categories (n) and their percentage distribution within the variable (%). The average values of variables following a normal distribution were described using the mean and standard deviation (SD). The statistical significance analysis was conducted using the chi-squared test. Effects were considered statistically significant when the P-value was < .05.
Patients voluntarily consented to take part in the ongoing study. At the same time, having given their consent, the patient had the right to withdraw from participation in the study at any stage. The study received University Bioethics Committee’s approval.
Results
Based on the MNA index, there were 48 malnourished subjects (46.1%) in the entire study group before the nutritional intervention, and 38 (36.5%) after the intervention, Table 2. Nutritional status improved significantly in 10 subjects (9.5%) when malnutrition was diagnosed.
Nutritional Status Before and After Nutritional Intervention According to the MNA Scale.

In the entire study group, there were 38 people (36.6%) who were malnourished before the nutrition intervention, and 39 people (37.5%) after the intervention, Table 3.
Nutritional Status Before and After Nutritional Intervention According to BMI.

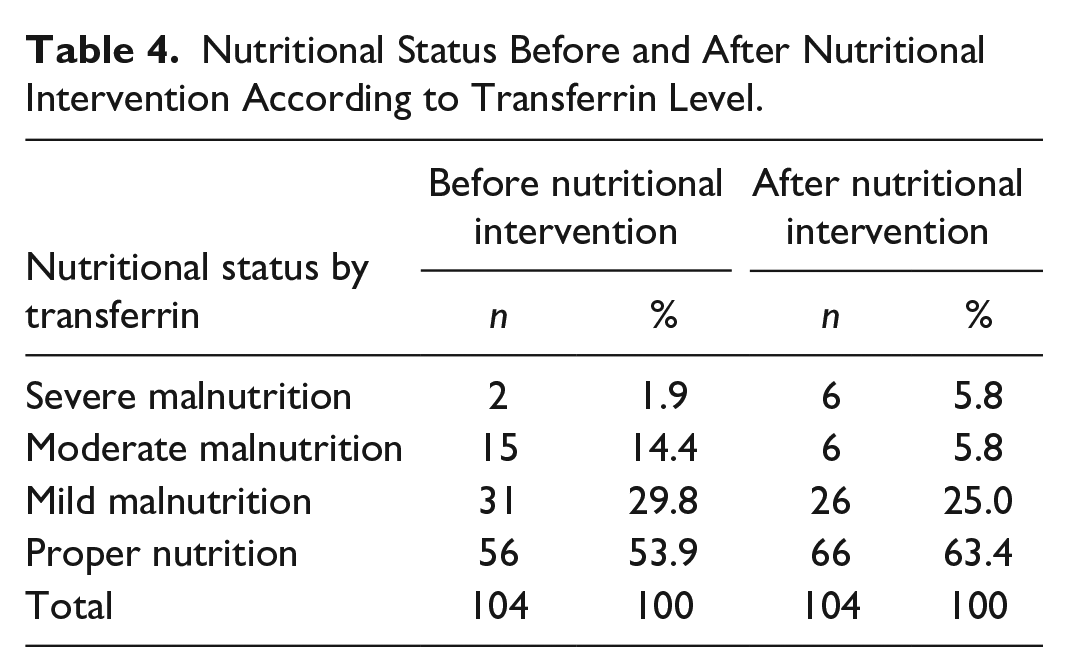
Based on transferrin, there were 48 people (46.1%) in the entire group who were malnourished before the intervention, and after ONS, their nutritional status improved for 10 people (9.5%). Transferrin levels indicated severe malnutrition at the beginning of the study in 2 people (1.9%), moderate malnutrition in 15 people (14.4%), and mild malnutrition in 31 (29.8%). After the nutritional intervention, severe and moderate malnutrition was present in 6 patients (5.8%), and mild malnutrition was present in 26 patients (25.0%)—Table 4.
Nutritional Status Before and After Nutritional Intervention According to Transferrin Level.
Based on the total prealbumin index, nutritional status improved in 12 patients (11.5%). Among the patients before the nutritional intervention, 3 (2.9%) were diagnosed with severe malnutrition, 15 (14.4%) with moderate malnutrition and 59 (56.7%) with mild malnutrition. At the end of the study, there were no patients with severe malnutrition, only 6 (5.8%) with moderate malnutrition, and 59 (56.7%) with mild malnutrition—Table 5.
Nutritional Status Before and After Nutritional Intervention According to Prealbumin Level.

Based on albumin levels, nutritional status in terms of moderate and mild malnutrition improved in 8 people (7.7%). Before the nutritional intervention, albumin levels indicated severe malnutrition in 3 people (2.9%), moderate malnutrition in 10 people (9.6%), and mild malnutrition in 35 (33.7%). After applying the intervention, 4 people (3.8%) had severe malnutrition, 7 people (6.7%) had moderate malnutrition, and 30 people (28.9%) had mild malnutrition. The nutritional status of moderate and mild malnutrition improved in 8 people (7.7%)—Table 6.
Nutritional Status Before and After Nutritional Intervention According to the Albumin Level.

The level of TLC did not indicate severely malnourished people at the beginning of the study, although 11 people (10.5%) were moderately malnourished and 16 (15.4%) were mildly malnourished. At the end of the study, 10 people (9.6%) were moderately malnourished and 12 (11.5%) were mildly malnourished—Table 7. Nutritional status improved in 5 people (4.8%).
Nutritional Status Before and After Nutritional Intervention According to TLC.

After the nutritional intervention, the average level of the values of the individual indicators of nutritional status increased statistically significantly for MNA p = .001, BMI p = .001, prealbumin p = .001 and albumin p < .001. For transferrin, the mean level did not change statistically significantly p = .068—Table 8. For TLC, the average median value did not change statistically significantly p = .378—Table 9.
Change in Mean Values of Nutritional Status Indicators After Nutritional Intervention.
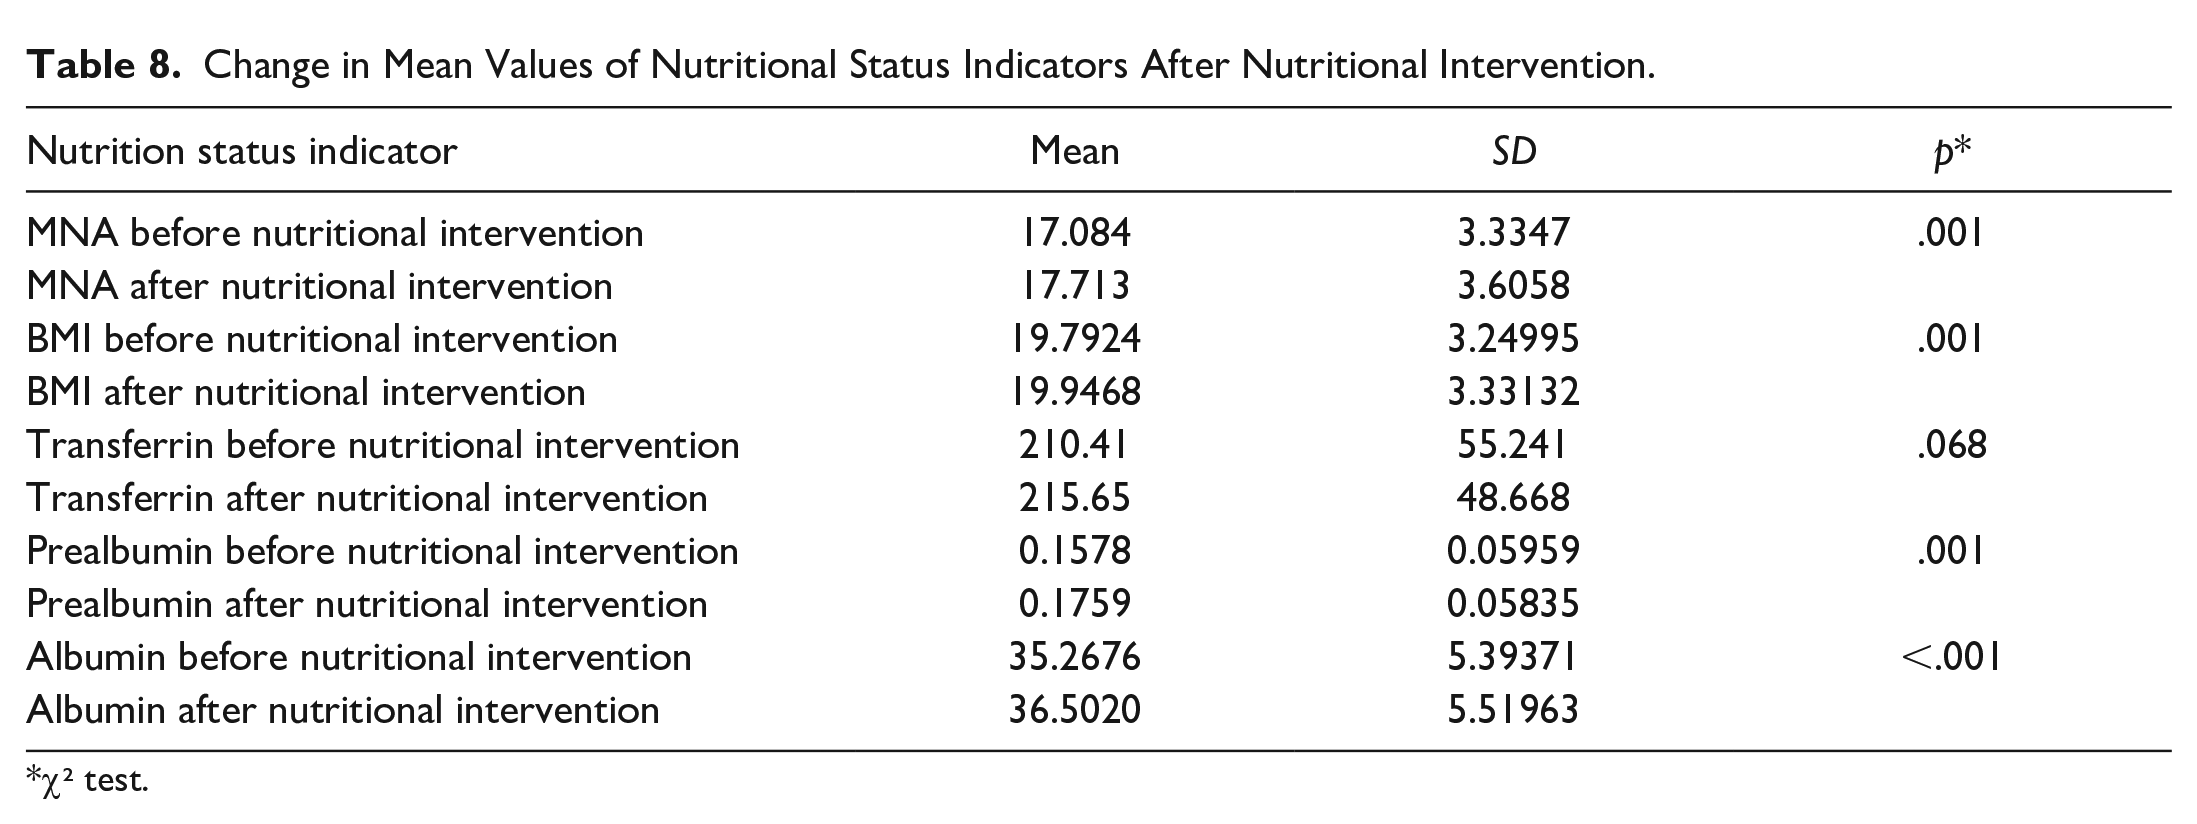
χ² test.
Change in Median Value for TLC Indicator.

χ² test.
Discussion
Malnutrition is a common and significant problem among the elderly, which can adversely affect human body functions There are various parameters used singly or in combination to define malnutrition. The most common are low BMI, unintentional weight loss, low MNA values, low food intake, along with reduced laboratory indicators of nutritional status, such as albumin, transferrin, prealbumin (Volkert et al, 2019; Wolters et al., 2018). This study assessed the nutritional status of people over 65 years of age residing in a 24-hour care institution, before and after nutritional intervention in the form of ONS on the basis of BMI, MNA and selected laboratory indicators of nutritional status: transferrin, prealbumin, albumin and also total lymphocyte count. Based on the MNA scale, in the entire group of patients before the nutritional intervention, 46.1% were malnourished, 36.6% based on BMI and 46.1% based on transferrin. The results also indicated malnutrition based on albumin values in 46.2% and prealbumin in 74% of patients. On the basis of TLC, malnutrition was determined in 25.9% of the respondents. ESPEN guidelines and many studies confirm that the MNA is a universal screening tool for detecting malnutrition for the elderly (Dent et al., 2012; Phillips et al., 2010; Salminen et al., 2020). The use of this simple questionnaire provides a quick, easy, and non-invasive way to obtain an authoritative assessment of the nutritional status of geriatric patients (Mastronuzzi & Grattagliano, 2019). BMI also belongs to this group of tools. In order to avoid the serious consequences of malnutrition, intervention strategies involving the administration of energy and/or protein-enriched meals to the elderly, as well as oral nutritional supplements (oral liquid industrial diets) are crucial (Malafarina et al., 2019). Their primary advantage is their well-balanced composition and small volume, which, in the case of patients with decreased appetite, can be a way to ensure an adequate supply of nutrients.
Possible benefits are also indicated by scientific data from a study involving people aged ≥ 65, in which one group received ONS, while the other received a placebo preparation. The use of the intervention was associated with better nutritional status, higher BMI, and greater strength of the participants (Chew et al., 2021).
The authors of many studies confirm significant annual savings and cost-effectiveness when ONS is administered to elderly people at risk of malnutrition (Beck, 2018; Elia et al., 2016; Freijer et al., 2014).
This research showed that the number of people in the “properly nourished” group increased after the nutritional intervention was applied among residents whose nutritional status was assessed based on MNA, transferrin, prealbumin and TLC. Such results were not observed based on albumin and BMI values. On the other hand, the mean level of the values of each nutritional status index after the nutritional intervention increased statistically significantly for MNA p = .001, BMI p = .001, prealbumin p = .001 and albumin p < .001.
A systematic review demonstrated the effectiveness of nutritional intervention in malnourished hospital patients and nursing home residents (Berg et al., 2021). Some reports cautiously interpret the improvement in nutritional status as a result of implementing a nutrition plan, suggesting that a beneficial effect on nutritional status can be demonstrated at a follow-up time of at least 3 months. There are still factors, such as inflammation, pain, acute illness, and depression, that may interfere with the results regarding the demonstration of a difference in nutritional status caused by nutritional interventions (Abbott et al., 2013; Green et al., 2011). It is expected that it takes a few weeks for weight gain, followed by an increase in BMI (Schultz et al., 2014).
In the authors’ study, improvements in nutritional status occurred among patients with malnutrition based on MNA and prealbumin indices and in groups of patients with moderate or mild malnutrition as determined by transferrin, prealbumin and albumin.
Research on the use of ONS in the elderly suggests that clinical outcomes such as mortality and complication rates can be improved in elderly people with reduced nutritional status (Cawood et al., 2012). A review of Fabijanik’s studies on the efficacy of ONS as a form of nutritional intervention showed a positive effect of ONS on weight gain and nutritional status assessed by MNA and IGF-1 albumin levels. The author emphasized that insufficient duration of nutritional interventions may have accounted for statistically insignificant differences (Fabijaniak, 2018). Oftentimes studies indicating improvements in nutritional status after ONS intervention are associated with assessments of physical fitness and quality of life. These studies confirm that implementation of nutritional interventions can be a means to improve nutritional status and quality of life (Kaur et al., 2019).
A study by Grönstedt H et al. showed that a twelve-week intervention of daily physical activity combined with ONS in nursing home residents did not improve physical fitness, but increased body weight (p = .013) (Grönstedt et al., 2020). Another study showed evidence that conditions such as sarcopenia and malnutrition are associated with quality of life in elderly nursing home residents (Boström et al., 2022). Future studies are needed in larger populations of 24-hour care institutions on exercise and nutrition in terms of effects on quality of life (Boström et al., 2022). There are studies that have analyzed the effects of individualized modular nutrition intervention in nursing home residents with malnutrition or at risk of malnutrition, that show their concept can improve protein intake and quality of life (Seemer et al., 2022). Tangvik et al. (2021) analyzed nine clinical trials involving 407 people with dementia, 228 of whom used ONS for 7 to 180 days. The use of ONS improved daily energy and protein intake. Body weight, muscle mass and nutritional biomarkers in the blood improved in the intervention groups compared to the control groups. No effects on cognitive function or physical performance were observed. Other studies have shown that protein supplementation has the most beneficial effect on preventing sarcopenia and weakness in malnourished or debilitated elderly people at risk for malnutrition (Park et al., 2018). A study in Singapore found that body weight and BMI were significantly higher in the nutritional intervention group compared to placebo (p < .001) (Chew et al., 2021).
The authors’ study was conducted on a selected population, the results suggest that routine monitoring of nutritional status parameters and their interpretation can be a useful tool for assessing and monitoring nutritional status. Periodically, especially in a group of patients with malnutrition or at risk of malnutrition, the use of ONS in the patient's diet demonstrates improvement in nutritional status.
The study has some limitations. First of all, the period of nutritional intervention, which was the administration of ONS, was short. Limited financial resources contributed to this. Also, there was no assumption in the study to exclude patients with nutritional status change during the intervention—other than those listed in the study’s exclusion criteria.
Global studies confirm the prevalence of malnutrition among elderly people living in 24-hour care homes and the adverse impact of malnutrition on health, so it is advisable to continue research in this area, as well as on taking preventive measures to reduce the risk of multimorbidity.
The study conducted to assess the nutritional status of a selected group of elderly people in a 24-hour medical care facility and the results obtained confirm the occurrence of malnutrition among the study group, which adversely affects the general health and bio-psycho-social state of the patient. This proves the need for nursing staff to continue assessing the nutritional status in order to detect irregularities early. There is a need to disseminate results about the nutritional situation of patients, which constitutes the basis for taking preventive actions by nursing staff and social/governmental bodies to implement procedures related to counteracting malnutrition. Among the academic community of medical faculties, it is important to raise awareness and pay attention to the patient regarding the quantity and quality of meals consumed, as well as to undertake educational and motivational activities aimed at proper nutrition, which determines better health and, therefore, quality of life.
Conclusion
After nutritional intervention in the form of ONS among people residing in a 24-hour care institution, nutritional status improved significantly based on nutritional status indices of MNA, albumin and prealbumin. Better nutritional status parameters after ONS among the elderly may be predictors of reduced risk of multimorbidity. It is advisable to undertake further studies involving larger groups of subjects, longer duration of nutritional intervention to confirm the effectiveness and advisability of its use among the elderly population.
Footnotes
Declaration of Conflicting Interests
The author(s) declared no potential conflicts of interest with respect to the research, authorship, and/or publication of this article.
Funding
The author(s) disclosed receipt of the following financial support for the research, authorship, and/or publication of this article: The study was funded by the Jagiellonian University Medical College budget (statutory project K/ZDS/004672).
Ethical Approval
The study received approval from the UJ Bioethics Committee of Jagiellonian University No. KBET/59/B/2014.