
Abstract
Introduction
The Lancet Global Health Commission defines eye health as maximized vision, ocular health, and functional ability, with these features contributing to overall health and wellbeing, social inclusion, and quality of life (Burton et al., 2021). In Singapore, a population based cross-sectional study found that health-related quality of life decreased with increasing visual impairment across the Chinese, Malays, and Indians, and visual impairment was associated with reported problems in usual activities and mobility (Wang et al., 2014). While research has been undertaken on the prevalence and impact of visual impairments in different ethnic groups in Singapore (Saw et al., 2004; Wong et al., 2008; Zheng et al., 2011), there is currently no systematic method of identifying the types of visual loss and linking these with the functional visual challenges faced in daily activities among older adults attending the outpatient ophthalmology clinics in Singapore. The importance of making explicit the link between ocular pathology and function is highlighted.
Age is the single best predictor for developing low vision and two-thirds of older adults with low vision are over age 65 years (Congdon et al., 2004). Approximately 45% of adults above 18 years old have vision loss in the United States of America (USA), and 27% are above 65 years old (American Foundation for the Blind, 2013). The conditions that cause most cases of vision loss in older patients are age-related macular degeneration, glaucoma, ocular complications of diabetes mellitus, and age-related cataracts and these are expected to increase in prevalence (Pelletier et al., 2016). In Singapore, the older adult population is projected to increase to 18.7% in 2030 (Ministry of Social and Family Development, 2022). It is anticipated that the prevalence of low vision will also increase among older adults in Singapore, given that eye conditions that commonly cause low vision such as glaucoma and age-related macular degeneration are linked with ageing (Burton et al., 2021). Further, older adults experience greater limitations in daily activities when the visual impairment occurs together with other chronic conditions associated with aging (Jones et al., 2011). For instance, older adults with visual impairment and chronic conditions are more likely to have problems in mobility and shopping compared to those with only visual impairment (Crews et al., 2006). Older adults with low vision should therefore have access to the full scope of rehabilitation, including low vision rehabilitation, to facilitate adaptation to changes contributed by visual impairment and enhance independence (Watson, 2001).
According to the definition by the World Health Organisation (WHO), a person with low vision is one who has impairment of visual functioning even after treatment and/or standard refractive correction, and has a visual acuity of less than 6/18 (USA: 20/60) to light perception, or a visual field less than 10° from the point of fixation, but who uses, or is potentially able to use, vision for the planning and/or execution of a task for which vision is essential (McAllister & Kammer, 2014). This definition guided the planning and implementation of the reported study from the start. However, this definition has since changed and is consistent with the definition of visual impairment indicated by the International Classification of Diseases and Related Health Problems 11th version (ICD-11); where moderate visual impairment includes visual acuity of 6/18 to 6/60 (USA: 20/60 to 20/200) and severe visual impairment spans from 6/60 to 3/60 (USA: 20/200 to 20/400) (World Health Organisation [WHO], 2019). While the criteria for visual field have been removed from the definition of low vision, the ICD acknowledges that visual field is still relevant in relation to functional vision in the vision rehabilitation context. Therefore, it is still relevant to consider the impact of visual field loss in this study as older adults with visual field loss will require referral for vision rehabilitation services.
Low vision conditions can be categorized into different types of vision loss, including having a full field with decreased acuity, central field defects, peripheral field defects, and hemifield defects (Mogk, 2011). Categorization of such types of visual loss has potential clinical relevance as they have been associated with differing impact on function. For example, age-related macular degeneration results in a center field defect which creates difficulties with tasks requiring precise vision such as managing money (Hochberg et al., 2012). Advanced glaucoma significantly reduces peripheral field and impacts on mobility (Friedman et al., 2007). Neuro-ophthalmic conditions may cause a hemifield defect causing difficulties with tasks such as driving and shopping (Warren, 2009). Whilst these hemifield impairments do not meet the WHO low vision criteria, they do impact daily activities.
The functional ability to perform specific activities of daily living varies depending on the eye structure(s) and/or visual processing system impacted by the ocular pathology (Mogk, 2011). Classification of clinical ocular pathology assessment information into distinct types of visual loss known to be associated with different functional impacts has the potential to make explicit the link between diagnostic information on the nature of the visual impairment/loss in the medical history and the functional visual challenges experienced in performance of daily activities. Identification of types of visual loss linked with function would in turn enhance communication between the medical and rehabilitation models and provide more meaningful information on functioning and disability for health professionals. Moreover, different types of vision loss require targeted forms of vision rehabilitation to be effective. Provision of a classification tool that makes explicit the link between type of visual loss and implication of that loss in function would not only inform the likely functional consequences of the visual loss but also how rehabilitation may target the distinct functional visual challenges faced in daily activities among older adults.
Our aim was to develop a flow chart to facilitate classification of types of visual impairment associated with function for use in clinical practice. Specifically, we aimed to use clinical information from medical records of the outpatient ophthalmology clinics of a large hospital to: (i) identify the frequency of older adults with low vision according to the WHO criteria, and (ii) classify the information of those individuals with low vision into different types of visual loss associated with function. It is envisaged that use of a structured flow chart to define such types of visual loss that link pathology and function, may enhance referral to vision rehabilitation and inform targeted rehabilitation strategies, as compared to information from clinical measures alone. Clinicians in the ophthalmology clinic could use the flow chart to identify and refer older adults for visual rehabilitation based on clinical medical information and types of visual loss known to be linked with function that may be addressed in rehabilitation. In turn, communication of this type of medical information may be used by rehabilitation therapists to interpret the implications on function based on the type of visual impairment identified through the flow chart. This has potential to improve patient care by ensuring that these older adults with visual impairment are identified and receive visual rehabilitation targeted to the specific functional visual challenges experienced in daily activities.
Method
A retrospective medical records review methodology was used to collect clinical data from a sample of older adults aged 65 years and over seen at the outpatient ophthalmology clinics of a large hospital. The process was guided by the methodology for retrospective chart reviews recommended by Vassar and Holzmann (2013) and Worster and Haines (2004). A sample size of 700 was required to be representative of the older adults seen at the clinics at a confidence level of 99%, based on the total number of 50,886 older adults seen in the ophthalmology clinics in 2017. A random sample of medical records was selected from patients seen at the ophthalmology clinics between 1 May 2017 and 31 October 2017. The inclusion criteria were older adults aged 65 years and above, who were patients of the outpatient ophthalmology clinics. A pilot test was done on the first fifty records to assess the study design and feasibility of the methodology (Vassar & Holzmann, 2013). Each electronic record was reviewed to obtain information including age, gender, eye diagnosis, visual acuity, and visual field. To facilitate the recording of data, a standardized electronic form was created with the questions following the order in which the information appeared in the medical record and clear definitions of variables were used (Vassar & Holzmann, 2013; Worster & Haines, 2004). Visual acuity measured by Snellen fraction was converted to decimal notation for analysis and measures of “Count Finger,” “Hand Movement,” “Light Perception,” and “No Light Perception,” which are used to classify very low vison for people who cannot see the largest numbers on the chart (Lange et al., 2009) were coded “0.” To ensure completeness of data, the medical records of patients with missing data were reviewed. Where data could not be found the code “999” was used. Descriptive analysis was completed with Statistical Package for Social Sciences statistical software.
The visual acuity and visual field information extracted from the medical records were mapped to the WHO low vision criteria (McAllister & Kammer, 2014) according to the decision tree flow chart in Figure 1. The visual status of the patient was classified into one of the three types: (1) full field and decreased acuity; (2) central field defect and decreased acuity; or (3) peripheral field defect with/without decreased acuity, using the visual acuity and visual field information. Those who had a neurological defect due to a cortical event, such as stroke, had their visual field records reviewed to check if they had any hemifield defect, which is the fourth type of visual loss. These types of visual loss were referenced to those described by Mogk (2011) (Figure 1). The need for informed consent was waived as this was a retrospective medical records review study. The study was approved by the National Healthcare Group Domain Specific Review Board in Singapore and the La Trobe University Human Research Ethics Committee in Melbourne, Australia (Approval number: 2018/00604). The study adheres to the Tenets of the Declaration of Helsinki.

Flow chart to classify types of visual loss in older adults who meet World Health Organization low vision criteria or have a hemifield defect based on Mogk (2011).
Results
Characteristics of Sample
Characteristics of the sample are presented in Table 1. The mean visual acuity of the better eye and worse eye was 0.60 and 0.56 respectively, which is better than the low vision acuity of 0.33 or less. The visual acuity in each eye ranged from total blindness to 1 (full vision). A large majority had the main diagnosis of cataracts (Right Eye [RE] 74.6%, Left Eye [LE] 74.0%), followed by glaucoma (RE 6.9%, LE 6.7%), diabetic retinopathy (RE 6.3%, LE 6.1%), and age-related macular degeneration (RE 2.7%, LE 2.9%). Only one participant had a left hemianopia.
Characteristics of Patients Reviewed (n = 700).

Frequency of Older Adults Who Fulfil the WHO definition of Low Vision
The visual acuity and visual field information of the sample was mapped to the WHO low vision criteria (McAllister & Kammer, 2014) (Table 2). Most patients (n = 642, 92%) did not meet the low vision criteria, including three patients with visual field defects from a neurological condition and two participants who were bilaterally blind without any light perception, which is different from low vision. Approximately 6% (n = 41) met the low vision criteria, with most meeting the visual acuity criteria alone (n = 38, 5%). It was difficult to ascertain if the low vision criteria were met in 2% of cases (n = 15) due to the lack of visual field information in the medical records. These cases were deleted from the analysis of those who meet the low vision criteria, as it was less than 10% of the cases (Vassar & Holzmann, 2013).
Frequency of Older Adults Mapped to the WHO Criteria of Low Vision (n = 700).

Frequency of Types of Visual Loss
Modification of classification types and development of sub-types
Each of the cases which met the WHO low vision criteria or had visual field loss due to neurological eye conditions was discussed by the authors to ascertain the type of visual loss (according to Mogk, 2011) which it best fitted. The pilot test showed that types of visual loss, as described in the clinical records, did not fall clearly into the four types described by Mogk (2011) due to factors such as different eye conditions between right and left eyes, different stages of disease progression, and formal visual field tests were often not done for eye conditions which the ophthalmologists did not deem necessary. The types of visual loss were inferred based on other clinical information such as the pathology of the eye condition. Therefore, the names of the types of visual loss were modified, and sub-categories were developed for each type to better classify the types of visual loss (Figure 2).
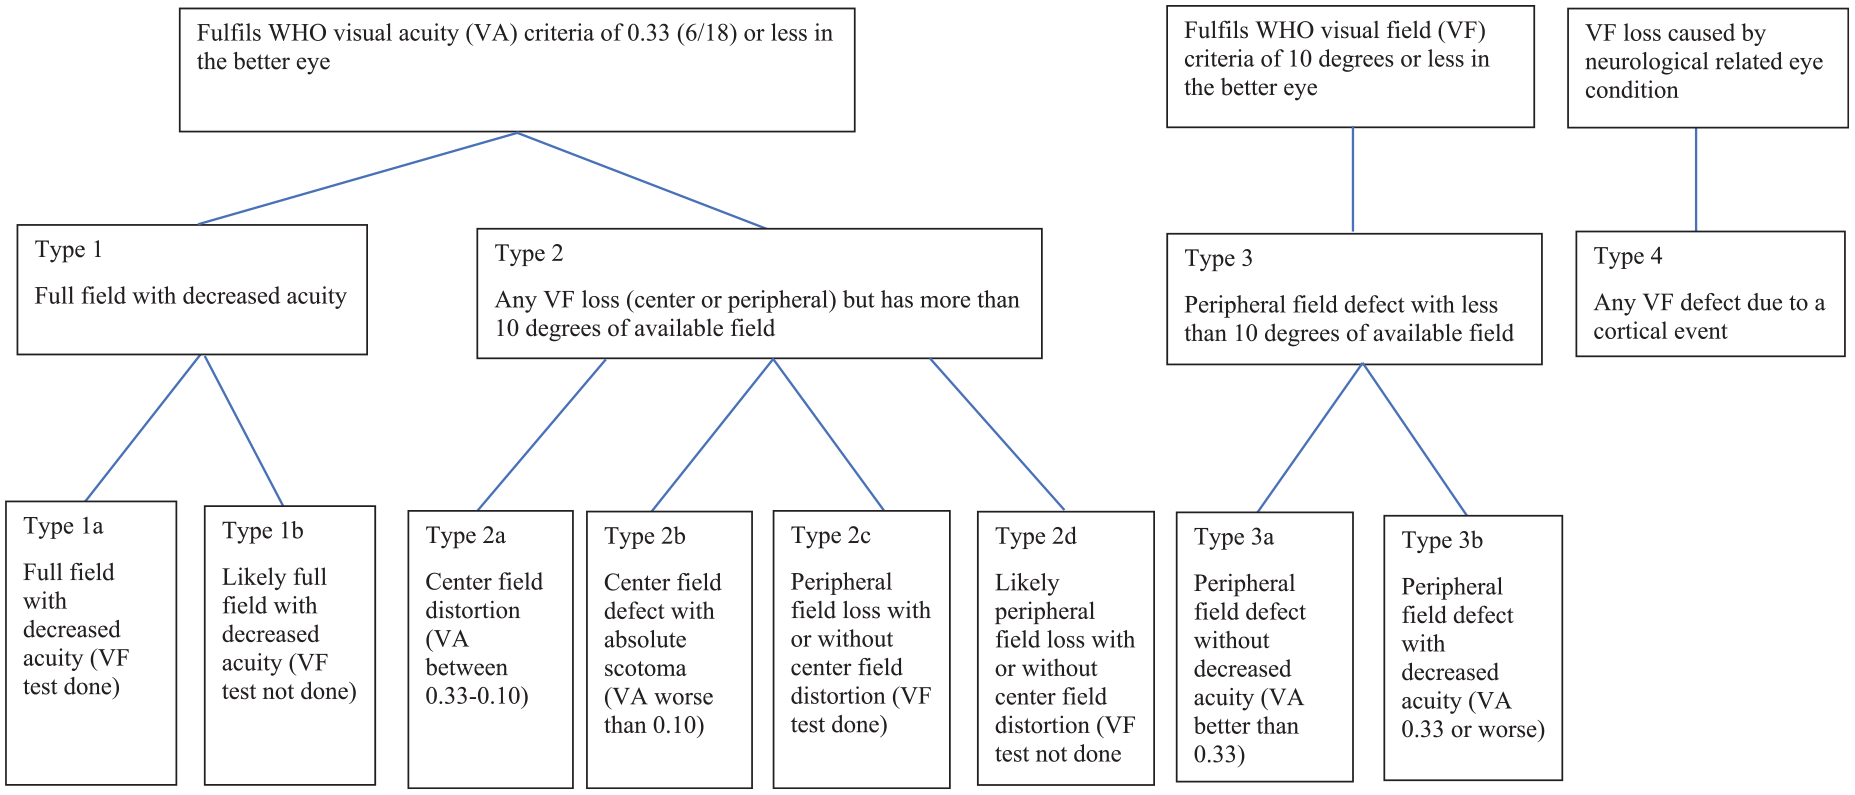
Modified flow chart to classify types and sub-types of visual loss linked with function in the sample of older adults who meet World Health Organization low vision criteria or have a visual field defect from a neurological condition.
Visual loss Type 1 met the WHO visual acuity criteria; sub-categories (1a and 1b) were formed to differentiate between those with visual field test done or without visual field test done but inferred to have full field. Type 2 was modified from Mogk’s (2011) description of central field defects to “any visual field loss (center or peripheral) but has more than ten degrees of available field.” This included cases with center field distortion (2a), center field defect with absolute scotoma and acuity worse than 0.10 (2b), and cases which had visual field loss but still had more than 10° of remaining visual field when tested or inferred (2c and 2d). Type 3 met the WHO visual field criteria and was similar to the type of peripheral field defect described by Mogk (2011). Two sub-categories (3a and 3b) were developed to differentiate those with an acuity better or worse than 0.33 respectively. Type 4 did not meet the WHO low vision criteria and was initially meant to capture patients with hemifield defects. Out of the three patients with visual field defects of neurological origin, only one patient was diagnosed with a left hemianopia; one patient had a left superior quadrantanopia; and another patient had a center field loss due to meningioma. Thus, Type 4 was modified to “any visual field defect from a cortical event” to more accurately and inclusively capture the range of pathologies that cause vision loss at a cortical level.
Frequency of types and sub-types of visual loss
Of the older adults who meet the WHO low vision criteria (n = 41) or had a visual field defect of cortical origin (n = 3), over half (n = 25; 56.8%) had eye conditions which were classified as Type 2. The next most common type of visual loss was Type 1, which had 29.5% (n = 13), followed by Type 3 and 4 each with 6.8% (n = 3). Further analysis of the sub-types (Figure 3) showed that the highest proportion occurred for Type 1b (27.3%, n = 12) followed by Type 2c (20.5%, n = 9) and Type 2d (18.2%, n = 8).
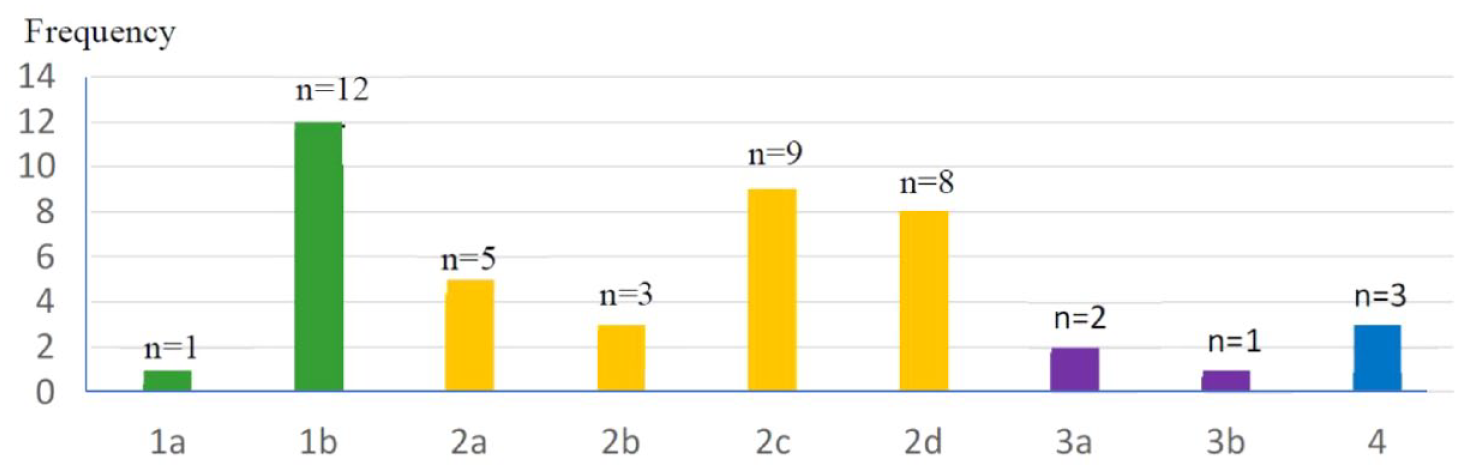
Frequency of sub-categories of types of visual loss in the sample of older adults who meet World Health Organization low vision criteria or have a visual field defect from a neurological condition. 1a: Full field with decreased acuity (visual field test done). 1b: Likely full field with decreased acuity (visual field test not done). 2a: Center field distortion (visual acuity between 0.33 and 0.10). 2b: Center field defect with absolute scotoma (visual acuity worse than 0.10). 2c: Peripheral field loss with or without center field distortion (visual field test done). 2d: Likely peripheral field loss with or without center field distortion (visual field test not done). 3a: Peripheral field defect without decreased acuity (visual acuity better than 0.33). 3b: Peripheral field defect with decreased acuity (visual acuity 0.33 or worse). 4: Any visual field defect due to a cortical event.
Discussion
Two main findings emerge from this study: (i) a low proportion of older adults seen at the outpatient ophthalmology clinics of a hospital in Singapore fulfil the WHO criteria for low vision and (ii) types of visual loss could be classified into four main categories with eight sub-categories. These different types of visual loss likely have a different impact on function.
For the first finding, only approximately 6% of older adults met the WHO criteria for low vision. There are three possible reasons for this. First, most of the older adults seen at the ophthalmology clinics have correctable eye conditions which may not result in low vision. More than half the sample had cataracts as the primary eye condition which can be corrected with surgery; compared to glaucoma, diabetic retinopathy, and age-related macular degeneration, which are common causes of low vision, occurring in less than 20% of the sample.
Second, older adults may be seeing an ophthalmologist at earlier stages of their eye condition before it progresses to low vision. This was consistent with the mean visual acuity of the better eye of 0.60, which is within the normal to near normal range of visual acuity (WHO, 2019). It is recommended that low vision rehabilitation programmes which aim to obtain referrals of older adults with low vision should target specific ophthalmology clinics such as the glaucoma and retina clinics, where patients are more likely to meet the low vision criteria.
The third reason may be that patients with visual field loss of less than 10° are not fully captured through the retrospective medical records review. Only three patients in the sample met the WHO visual field criteria. This may be because visual field tests were not done consistently for all patients, including eye conditions like glaucoma where a constricted visual field loss is expected in advanced stages (Friedman et al., 2007). Clinical measures such as optical coherence tomography are more appropriate to monitor disease progression than visual field tests (Zhang et al., 2017). None-the-less, these patients may have functional challenges that would benefit from low vision rehabilitation, but are not identified and referred for rehabilitation.
In addition to using the WHO visual field criteria (McAllister & Kammer, 2014) to refer to low vision rehabilitation, other criteria should be considered. These may include subjective feedback from patients that indicate that their eye condition has progressed to a stage of causing functional challenges that require rehabilitation. It has been reported that the costs of low vision rehabilitation compared to provision of low vision devices without rehabilitation was similar, but patients who received low vision rehabilitation had greater improvements in overall visual ability, reading ability and visual information processing (Stroupe et al., 2018). Older adults with low vision should be referred to rehabilitation as they may gain improvements in functional ability that support cost effectiveness in the long term (Stroupe et al., 2018), improved vision-related quality of life (Liu et al., 2021), and maintaining independence (Liu & Chang, 2020).
For the second finding, types of visual loss defined in the flow chart were modified from the original types (Mogk, 2011) to four main types with eight sub-categories. Only Type 1 was similar to the first type described by Mogk (2011). The other three types had to be modified, highlighting the complexity that different types of visual loss may present with their associated functional challenges. A flow chart was developed, which potentially helps to bridge the gap between the medical and rehabilitation models and enhance communication across disciplines by classifying clinical information obtained in a medical setting into function-related meaningful information for rehabilitation.
The developed flow chart could be used with multi-disciplinary health care professionals working with older adults with visual impairment, including ophthalmologists, geriatricians, and neurologists, to identify a wider target group of older adults who may meet the criteria of the classification flow chart and thus benefit from functional vision rehabilitation. Vision rehabilitation therapists (often referred to as low vision rehabilitation therapists) would benefit from increasing their knowledge of how to interpret medical notes to identify the distinct types of visual loss, and better understand the functional implications of each type of visual loss for older adults to plan effective rehabilitation. Application of the flow chart should be integrated into existing workflows and routine clinical practice, to ensure that older adults with different types of visual loss and distinct functional needs are identified and referred to receive targeted visual rehabilitation in a timely manner (Watson, 2001). It is anticipated that more targeted referrals to low vision rehabilitation will be enabled by informing the function-oriented rehabilitation needs of patients with different types of visual loss.
The WHO low vision criteria are commonly used across different countries in clinical practice to identify and refer patients for low vision rehabilitation. However, patients with visual field defects of cortical origin may be missed out as they do not fulfil the WHO low vision criteria. The development of the current flow chart builds on the WHO low vision criteria and expands on it to include patients with visual field defects of cortical origin. In addition, as the impact on function is known to vary with the type of vision loss, this flow chart helps to identify the types of vision loss associated with different functional outcomes to guide referral and vision rehabilitation to ensure good functional outcomes. This function-oriented classification of type of vision loss has the potential to complement that of the WHO and be applied in practice settings internationally. Future research is recommended to test if this classification flow chart can be applied specifically across a range of low vision clinics in different countries to identify and link the challenges faced in daily activities among older adults with different types of vision loss, including distinct commonalities and differences in activities and participation within the sub-types of vision loss.
Although this study has included older adults with Type 4 vision loss on the same flow chart as the eye conditions which meet the WHO low vision criteria, they may have other functional deficits associated with cortical damage, in addition to the visual field deficits. For instance, patients with stroke may have cognitive, motor, somatosensory, and speech deficits which will impact on function in addition to visual field deficits. Older adults with conditions of cortical origin may also have impairments in other visual functions such as visual acuity and oculomotor impairments (Warren, 2011) which are not captured in this flow chart. Therefore, it may be more appropriate to have a separate flow chart for patients with visual impairment following acquired brain injury, to capture the broader range of types of visual loss and functional implications. The current classification flow chart based on the WHO low vision criteria, appears more appropriate for eye conditions like glaucoma, diabetic retinopathy, and age-related macular degeneration rather than vision impairments due to cortical events.
Study Limitations
One limitation was that of the 700 medical records reviewed, only a small number met the WHO low vision criteria and could be categorized into one of the four types of vision loss. Another limitation was that data was collected from the general ophthalmology clinics that do not see large numbers of low vision patients. The study was limited to a 6-month study period thus other stable eye conditions such as hemianopia may not be captured as they may be seen over a longer interval, such as a yearly review. It would be useful to test this function-oriented classification flow chart to categorize types of visual impairment on a larger sample in the low vision rehabilitation clinics and specialist clinics such as the glaucoma and retinal clinics across Singapore and extend the study period. As visual field information is not routinely tested, this was a missing variable that may have contributed to a small percentage of patients not meeting the WHO visual field criteria.
Conclusion
A relatively small proportion of older adults met the WHO low vision criteria or had a visual field defect due to a cortical event, based on the retrospective record audit in the general outpatient ophthalmology clinics of a large hospital in Singapore. A systematic approach was developed to identify older adults with low vision and to categorize their vision loss into four main vision loss types using a classification flow chart which builds on the WHO low vision criteria and maps to types of visual loss known to be associated with distinct functional outcomes. Across the four major types of vision loss, eight sub-types were identified reflecting the complexity of the visual impact of the eye conditions. This classification flow chart will enable researchers and clinicians working in eye clinics to better identify older adults with different types of vision loss known to be associated with distinct functional outcomes and refer them for targeted low vision rehabilitation.
Future research is recommended to investigate related functional difficulties in daily activities based on the defined types of vision loss. The developed flow chart can potentially bridge the gap and enhance communication between the medical and rehabilitation settings internationally by linking medical information with the types of visual loss which can provide meaningful information on functional deficits and improve rehabilitation outcomes for older adults.
Footnotes
Declaration of Conflicting Interests
The author(s) declared no potential conflicts of interest with respect to the research, authorship, and/or publication of this article.
Funding
The author(s) disclosed receipt of the following financial support for the research, authorship, and/or publication of this article: This study was supported by the scholarship provided by Tan Tock Seng Hospital in Singapore; and the Graduate Research support grant by La Trobe University, in Melbourne, Australia. There are no grant numbers for the scholarship provided by Tan Tock Seng Hospital and Graduate Research support grant by La Trobe University.