
Abstract
This study investigated the relationship between frailty and body composition and the target values for preventing frailty in body composition. Frailty status and body composition such as the percent body fat and skeletal mass index was measured. Logistic regression analysis was performed by sex. Receiver operating characteristic curve was used to extract the cutoff values for body composition. The participants were 259 in females and 84 in males for 343 of which 75.5% females. Among the females, age was a significant independent variable. Percent body fat was significantly associated with frailty status in males, with a cutoff value of 27.6%. The area under the curve was significant (0.689, p < 0.01, sensitivity = 0.574, specificity = 0.784). New target value of percent body fat in males for preventing frailty is identified. Findings of this study could contribute to the establishment of preventive intervention for frailty in clinical practice.
The world continues to progress into an aging society. Among the developed countries, Japan is one of the top aging societies. It has been projected that one-third of Japanese population will be at least 65 years old and approximately 20% will be at least 75 years of age by 2030 (Akiyama, 2020). Aging causes a decline in physical activities, and this limitation in older adults leads to an increase in social security costs. Thus, it is important to maintain physical activities in older adults for the benefits of the individuals, their families, community, and the nation.
Frailty is one of the problems related to the decline in physical activity in older adults, which warrants appropriate attention. In 1992, Buchner and Wagner (1992) defined frailty as a state of reduced physiologic reserve associated with increased susceptibility to disability. Fried et al. (2001) also defined frailty as a clinical syndrome in which three or more of the following criteria are present: unintentional weight loss (10 lbs. in the past year), self-reported exhaustion, weakness (grip strength), slow walking speed, and low physical activity. Previous reviews have indicated that frailty is associated with (1) fall risk, with a prevalence of up to 44% among older adults (Fhon et al., 2016) and (2) increased risk of mortality and hospitalization (Yang et al., 2018).
Studies that have examined the relationship between frailty and body composition indicated that there were differences in body fat mass, percent body fat (PBF), skeletal muscle mass, total body water, fat-free mass, and basal metabolic rate between patients with and without frailty and that obesity plays an important role in older adults with frailty (Xu et al., 2020; Reinders et al., 2017; Reinders et al., 2017, 2017). These results suggest that body composition is significantly associated with frailty and can be considered a potential target for the prevention of frailty. However, no study has examined the target values of body composition for preventing frailty. Therefore, it is important to clarify target values and factors associated with frailty prevention, which could help to identify appropriate intervention and management in clinical practice. Hence, this study investigated (1) the relationship between frailty and body composition and (2) the target values for preventing frailty in body composition using cutoff value.
Materials and Methods
Ethical Considerations
Data on sociodemographic information (age and gender), frailty, and body composition were used for analyses. All the measured parameters were essential for assessing the participants’ functional status and were not harmful. All procedures were conducted in accordance with the World Medical Association Declaration of Helsinki Ethical Principles for Medical Research Involving Human Subjects of 1975. All participants provided written informed consent to participate in the study. This research has been approved by the institutional review board in Hiroshima University (approval number: 02–05).
Setting
This was a descriptive study. The participants were recruited through the staff of community centers, regional comprehensive support centers, and gymnasiums in Hiroshima Prefecture in Japan. A flyer outlining the survey was also used for recruitment. Recruitment and data collection were performed between November 2020 and December 2020.
Participants
The inclusion criteria for the study were the following: (1) community-dwelling persons aged 65 years or older and (2) persons with independent mobility (Barthel Index mobility score >10 [full score 20]). The exclusion criteria were the following: (1) suspected cognitive impairment (mini-mental state test score <23 [full score 30]) and (2) serious illness (unstable cardiovascular disease, stroke, severe respiratory impairment, Parkinson’s disease, diabetic peripheral neuropathy, or rheumatoid/arthritis). The reason for excluding people with suspected cognitive impairment was to ensure the accuracy of the responses to the questionnaire survey. People suspected of having serious diseases were excluded to prevent falls during measurement and to avoid worsening of diseases. A total of 343 people participated in the study.
Outcome
The outcome in this study was frailty status, which was assessed using a revised Japanese version of the Cardiovascular Health Study (J-CHS) criteria (Satake & Arai, 2020). The revised J-CHS criteria are modified criteria in reference to the criteria proposed by Fried and colleagues, which are used to screen for frailty among Japanese individuals. It consists of five items: shrinking, weakness, exhaustion, slowness, and low activity. Shrinking was measured with the question, “Have you lost 2 or more kg in the past 6 months?” Weakness was defined as grip strength <28 kg in men or 18 kg in women. Exhaustion was measured with the question, “In the past 2 weeks, have you felt tired without a reason?” Slowness was defined as a gait speed of <1.0 m/s. Low activity was surveyed with two questions: “Do you engage in moderate levels of physical exercise or sports aimed at health?” and “Do you engage in low levels of physical exercise aimed at health?” Every positive (yes) answer to each question was assigned one point. Finally, the scores were summed using the established cutoff points to create a composite variable: 0 = robust, 1–2 = pre-frail, ≥3 = frail (score range = 0–5).
For the measurement of grip strength, we used a grip strength meter (TKK 5401 Grip-D; Takei, Niigata, Japan). The participants grasped the grip strength meter so that the pointer of the meter was on the outside. Before the measurement, the interphalangeal joints of the fingers were adjusted so that they were almost at right angles. Measurements were taken once on both sides. Records were made in kilograms, and those less than a kilogram were rounded down. The reliability and validity have shown in measuring hand grip strength using a hand-held dynamometer (Abizanda et al., 2012). Additionally, for the measurement of walking speed, the participants walked along a 5-m walking path according to the instructions. A spare path of 1 m was provided for walking. The participants were instructed to “walk forward as if you were always walking.” Measurements were taken once. Walking time is reliable and valid method for measuring walking speed (Steffen et al., 2002).
Predictive factors
PBF and skeletal mass index (SMI), indexes of skeletal muscle mass, were measured using multifrequency bioelectrical impedance analysis (MF-BIA; InBody 270, Tokyo, Japan) to ascertain body composition. The SMI was calculated as the skeletal muscle mass of the extremities. The MF-BIA instrument is a versatile, convenient, instantaneous, non-invasive, and highly accurate device for measuring bioelectrical impedance. As such, it is now the most common method for measuring body composition. The MF-BIA instrument can assess changes in body composition. InBody 270 is acceptable for body composition analysis. The high accuracy of measurement in older adults was certified. Additionally, this instrument can be used to monitor the nutritional status of older people and identify people with sarcopenia in the community (Fang et al., 2020).
Statistical analysis
Logistic regression analysis was performed to investigate the relationship between body composition and pre-frailty and/or frailty. PBF and SMI were entered into the regression model as independent variables. To adjust for confounder, age was also entered into the regression model as a confounding variable. Finally, to assess whether the dependent variable was linear in the logit, three methods, as proposed by Hosmer and Lemeshow, were used: lowess (locally weighted least squares) smoothing curves, design variables, and fractional polynomials.
In the first model (Model 1), the dependent variable was the binary value of the existence of pre-frailty or frailty: robust participants were coded as 0 and participants with pre-frailty and frailty were coded as 1. Model 1 was used to identify whether the participant was not robust. In the second model (Model 2), the dependent variable was the binary variable with frailty: robust participants and participants with pre-frailty were coded as 0 and participants with frailty were coded as 1. Model 2 was used to identify whether the participant was frailty. Considering that sex might be a confounding factor in the relationship between body composition and pre-frailty and/or frailty, logistic regression analysis was performed separately for male and female participants. Finally, a total of four models were created.
To extract the cutoff values for body compositions to identify the presence of pre-frailty and/or frailty, we conducted an analysis using the receiver operating characteristic (ROC) curve. This analysis was applied only to body composition that was significant in the logistic regression analysis. In the ROC analysis, the outcome variable was the presence or absence of pre-frailty and/or frailty. The test variable was the body composition that was significantly associated with pre-frailty and/or frailty. Cutoff values were identified using the Yoden index. The area under the curve (AUC), sensitivity, and specificity were calculated to evaluate the accuracy of the identified cutoff values. The AUC could distinguish between nonpredictive (AUC <0.5), less predictive (0.5 < AUC <0.7), moderately predictive (0.7 < AUC <0.9), and highly predictive (0.9 < AUC <1) values, as well as perfect prediction (AUC = 1) (Swets, 1988).
Sample size
According to a previous study (Fhon et al., 2016) that investigated the prevalence of pre-frailty or frailty in Japanese older adults, 44% of older adults were suspected pre-frailty or frailty. Based on this fundamental data, ratio of the Japanese older adults with pre-frailty or frailty was assumed to be 1 (45%) to 1.2 (55%). The alpha value was set at 0.05, and the power was set at 0.8. The hypothesized and null hypothesis AUC were set at 0.6 (moderate). Consequently, a total of 196 cases were required. In this study, additionally subjects were recruited to ensure that an adequate sample size was obtained.
Results
Background of the Subjects.

( ) standard deviation; R: Robust, P: Pre-frailty, F: Frailty; BMI; Body mass index, PBF; Percent body fat, SMI: Skeletal mass index.
Results of Logistic Regression Analyses.

PBF: Percent body fat, SMI: skeletal mass index.
Results of ROC Analysis.
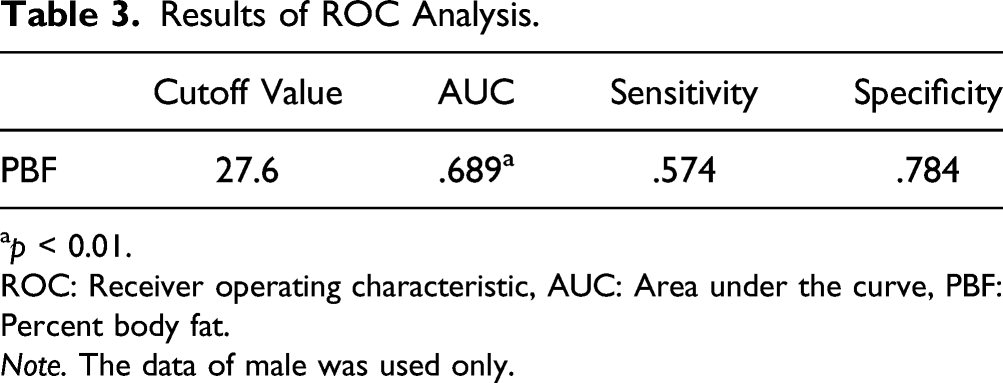
ap < 0.01.
ROC: Receiver operating characteristic, AUC: Area under the curve, PBF: Percent body fat.
Note. The data of male was used only.

ROC analysis for the PBF in male. ROC: Receiver operating characteristic. Note: PBF: Percent body fat.
Discussion
This study examined the relationship between frailty and body composition, as well as the cutoff value in significant factors. In females, age was a significant variable in models 1 and 2, whereas in males, PBF was a significant variable in model 1. This study also showed that the cutoff value was 27.6% in PBF. These results can be leveraged to support healthcare providers to develop appropriate preventive programs for frailty in clinical practice.
In the two models for females, age was a significant factor. The odds ratios were 1.127 for model 1 and 1.102 for model 2. This finding is consistent with the high incidence of frailty in older adults. Although age is not a factor that healthcare providers can intervene in, it is important to recognize that being older is a factor in frailty. Whereas, PBF was significantly related to frailty in males. A previous cross-sectional study in Chinese older adults (Xu et al., 2020) indicated that body fat mass was associated with a higher risk of frailty, and a national database in the US (Crow et al., 2019) also showed that PBF was significantly associated with frailty. The result of our study reports similar findings in the Japanese population. Previous systematic reviews (Yin et al., 2021; Talar et al., 2021) have reported that nutritional advice and exercise intervention were effective in reducing body weight and fat mass. This indicates that PBF can be altered by interventions such as advice and exercise. This study revealed a new finding on the cutoff value in PBF, which was 27.6%. This target value might contribute to the establishment of preventive intervention for frailty in clinical practice.
This study analyzed the data by sex because sex was considered as a confounding factor. PBF was a significant factor in males but not in females. The reason for this discrepancy is not clear but indicates a sex variation in PBF with aging. In a previous study (Whitaker et al., 2016) that evaluated sex differences in adipose tissue, although subcutaneous adipose tissue and visceral adipose tissue decreased linearly with age in both sexes, visceral adipose tissue was maintained in males more often than in females. Furthermore, Stevens et al. (2010) showed that there are large differences in the body composition of males and females, with males having a relatively more central distribution of fat (waist circumference was relatively longer in males than in females). In fact, a previous longitudinal study in older adults (Bouchard et al., 2011) indicated that waist circumference was the significant factor associated with mobility function related with frailty. These results might explain the sex discrepancy in PBF in our study and suggest a need to consider effective interventions that would mainstream sex into such interventions.
The sample in this study can be regarded as approximating the population. According to the data from the Ministry of Education, Culture, Sports, Science and Technology in Japan (Japan Sports Agency, n.d.Japan Sports Agencyn), the average grip strength was 22.5 kg for females and 35.0 kg for males in Japan aged above 75 years. Previous study (Matsushita et al., 2016) using the same Japanese sample as ours, the grip strength of robust female was 23.6 kg and that of robust male was 36.6 kg. The average grip strength in our data was 22.6 kg for females and 34.1 kg for males. These values do not appear to be distinctly different among studies. Similarly, in pre-frail, the values of grip strength were similar in this study and previous studies. Therefore, the sample in this study can be considered to be representative of the population.
In our study, the percentage of subjects with pre-frailty and frailty were 43.2% and 3.9% for females and 51.2% and 4.8% for males, respectively. This compares well with a previous study among 2206 Japanese older adults (Murayama et al., 2020), which reported a pre-frailty and frailty prevalence of 40.8% and 8.7%, respectively. With reference to previous studies, the percentage of frailty included in this study may be small. However, the presence or absence of frailty was determined by standard criteria in this study. Therefore, we believe that the small percentage of frailty is not a serious problem.
The results of this study imply to clinical practice that PBF in males should assess carefully in clinical practice. In males, the sensitivity of this cutoff value was 0.574, which was lower than the specificity value. In other words, it would be myopic to assume that a PBF of less than 27.6% means that the older adults are not pre-frail or above. Clinicians need to have an attitude of not judging robustness based on low PBF alone.
This study has several limitations. First, it was a descriptive study, which was not sufficient to examine a strict causal relationship between body composition and frailty. Second, although this study had a large sample of 259 older females, the sample size of 84 older males was relatively small. Third, this study indicated cutoff values in PBF for males in Japan. However, Japan has a population with one of the lowest body mass index values among the Organization for Economic Co-operation and Development countries (GBD 2015 Obesity Collaborators, 2017). The second and third limitations highlight the limited generalization of this study’s findings. Hence, the results of this study need to be interpreted with caution.
Conclusion
This study examined the relationship between frailty and body composition, and it determined the target values for potential predictive factors. Our results showed that the association between body composition and frailty differs between females and males. In males, PBF was significantly associated with frailty in model 1, and the target value of PBF was 27.6%. These findings could contribute to the establishment of preventive intervention for frailty in clinical practice.
Footnotes
Declaration of Conflicting Interests
The author(s) declared no potential conflicts of interest with respect to the research, authorship, and/or publication of this article.
Funding
The author(s) received no financial support for the research, authorship, and/or publication of this article.