
Abstract
Background:
Significant racial/ethnic disparities exist in the prevalence of functional disability among older Americans.
Objective:
The study analyzed the odds of older people in the United States experiencing single and multiple disabilities, by race and region of birth.
Method:
Data came from the American Community Survey (2011–2015). Multinomial logistic regression analysis was used.
Results:
Region of birth, race/ethnicity, age, citizenship status, duration of stay, sex, marital status, veteran status, educational attainment, poverty status, and class of workers were all significantly associated with reports of either single or multiple disabilities. However, the introduction of the interaction terms for citizenship status by race modified some of the significant results. For instance, being born in Latin America no longer reduced the odds in reports of both single and multiple disabilities. However, compared with Whites and native-born of all races, both Hispanics who were either naturalized or were noncitizens had lower odds of reporting multiple disabilities (27% and 28% lower, respectively), whereas naturalized Hispanics also had significantly reduced odds (22%) for a single disability.
Conclusion:
These findings add to the disability, race/ethnicity, and place of birth literature.
Introduction
Disability is a public health issue not only because of its prevalence but also its cost to society. The Centers for Disease Control and Prevention (CDC, 2018) estimated that 25% of the U.S. population had some type of disability in 2016. In 2018, 61 million American adults (people aged 18 and above) had difficulty with mobility, independent living, self-care, cognition, hearing, and vision (Okoro et al., 2018). Overall, disability costs the U.S. government hundreds of billions in dollars spent on disability-related care and services each year (Ma et al., 2014). The odds of disability increase with age. The rapid aging of baby-boomers (both native-born and foreign-born) makes examining functional disability among Americans necessary.
There is ample evidence of racial and ethnic disparities in morbidity and mortality among the aging people (Beydoun et al., 2016; Gennuso et al., 2019; MacDorman & Mathews, 2011; Quiñones et al., 2019; Vega et al., 2009; Yee et al., 2016). Significant racial/ethnic disparities also exist in the prevalence of functional disability among older native-born Americans (Dunlop et al., 2007; Goyat et al., 2016; Louie & Ward, 2011; Phaswana-Mafuya & Peltzer, 2018). Morbidity is related to functional disability as demonstrated by some researchers. For example, Beltran-Sanchez et al. (2014) show that some morbidity conditions (e.g., diabetes, obesity) may be precursors of disability. Parmar and Saikia (2018) similarly observed higher levels of disability “among people diagnosed with chronic morbidities” (p. 4).
One social determinant of research interest in relation to morbidity and mortality is immigrant history and the health advantage of immigrants over native-born people (Antecol & Bedard, 2006; Fang et al., 1997; Singh & Miller, 2004; Singh & Siahpush, 2002). This interest arises because the baby-boom population is racially and ethnically diverse and includes a significant number of foreign-born boomers (Colby & Ortman, 2014; Gassoumis et al., 2010). The upsurge in the number of immigrants to the United States has also introduced increased diversity among the foreign-born population not only culturally but also socioeconomically (Abramitzky & Boustan, 2017). Functional disability and socioeconomic status are related. For example, it is known that socioeconomic status decreases as disabilities increase in number (Stevens et al., 2016). It is therefore important to understand the prevalence of functional disability conditions among immigrants relative to native-born Americans.
Studies of racial and ethnic disparities in functional disability among immigrants in the United States have examined the healthy immigrant hypothesis and the erosion of this effect with duration of U.S. residency (Elo et al., 2011; Huang et al., 2011). Most of the studies found that immigrants had lower levels of disability. For instance, older Mexican Americans reported fewer functional limitations among immigrants with longer U.S. residency compared with their native-born counterparts (Cantu et al., 2013). Also, Elo et al. (2011) in their study of Black immigrant groups found that all immigrant subgroups had lower levels of physical activity and personal care limitation compared with native-born Blacks. Huang et al. (2011) also found lower levels of mental and physical limitations among immigrants from all regions of the world compared with native-born Americans. However, studies of disability among Asian immigrants report more nuanced findings. Although Ro and Gee (2012) found that, in later life, disability advantage is eroded in some older Asian immigrants, Mutchler et al. (2007) reported that immigration and history of place of origin have diverse results on reports of disability among older Asians. Asian immigrants from certain nations and immigration cohorts may have some disability advantages relative to others.
In general, the healthy immigrant paradox has been attributed to immigrant health selection effect (Arias, 2010; Jasso et al., 2005; Palloni & Arias, 2004) and positive health behaviors related to cultural characteristics of immigrants (Antecol & Bedard, 2006; Fenelon, 2013). However, chronic stress from racism and discrimination and their physiological impact on health have also been suspected to be another reason for the changes in the health conditions of immigrants, the longer they reside in the United States (Brigham et al., 2016; Doamekpor & Dinwiddle, 2015; Kaestner et al., 2009; McClure et al., 2015). Environmental factors thus seem to play a role in the healthy immigrant paradox. This makes racial and ethnic minorities and non-White immigrants vulnerable to health threats.
Previous studies of disability neither examined the impact of race/ethnicity, region of birth, and citizenship status on functional disability nor made a distinction between single and multiple disabilities in the same context. It matters whether a person has a single disability or multiple disabilities as there are disparities among American adults in the number of disabilities and socioeconomic status (Stevens et al., 2016). A person with only one functional disability may be less burdened and limited in the kinds of activities that they can perform compared with those having multiple disabilities, all things being equal. Also, controlling for the number of functional disabilities helps understand the overall status of limitation that people have (Stevens et al., 2016). Similarly, as race/ethnicity is a social determinant of health, it makes sense to examine the impact of this factor among different immigrant groups in the United States.
This exploratory epidemiological study sought to understand the prevalence of single- versus multiple-functional-disability conditions among immigrant populations in the United States and to compare them to native-born Americans. It further sought to examine the impact of race and region of birth on the prevalence of these disability conditions among aging Americans as well as to understand the disparities in level of functional disability conditions (i.e., single vs. multiple) among American adults by racial and ethnic and socioeconomic status. Our focus on single versus multiple functional disabilities is to understand factors that impact the overall functional status of Americans as Stevens et al. (2016), have reported disparities among American adults in the number of disabilities and socioeconomic status. The following questions guided this study: (a) Does region of origin make a difference in the prevalence of single versus multiple disabilities among aging people in the United States? (b) Do race and region of birth matter in reports of disabilities controlling for social and demographic variables? (c) How will race/ethnicity interact with citizenship status to impact reports of single or multiple disabilities?
Data and Method
We used data from the 2011–2015 American Community Survey (ACS) Public Use Micro Data Samples (PUMS). The ACS is an ongoing monthly survey of U.S. households. The ACS design is similar to the long-form questionnaire design employed up to the 2000 Census of Population and Housing. It covers diverse characteristics of the U.S. population including migration and disability characteristics. Further description of the design of the ACS can be found at https://www.census.gov/programs-surveys/acs/methodology.html. The data set contained more than six million cases aged 50 years and above. We used the random sample selection of cases procedure in SPSS to extract a 5% subsample of respondents in this age category. This procedure yielded 302,456 cases for this study in about the same proportions of race and citizenship as in the original sample of more than six million cases.
The outcome variable is disability status. We based our measure of disability on six questions in the ACS. These questions inquired whether persons had self-care, hearing, vision, independent living, ambulatory, and cognitive difficulties. Respondents were asked to answer “Yes” or “No” to the following questions (U.S. Census Bureau, 2015):
Qt. 17. a. Is this person deaf or does he or she have serious difficulty hearing? b. Is this person blind or does he or she have serious difficulty seeing even when wearing glasses?
Qt. 18. a. Because of a physical, mental, or emotional condition, does this person have serious difficulty concentrating, remembering, or making decisions? b. Does this person have serious difficulty walking or climbing stairs? c. Does this person have difficulty dressing or bathing?
Qt. 19. Because of a physical, mental, or emotional condition, does this person have difficulty doing errands alone such as visiting a doctor’s office or shopping?
We counted the number of Yes responses for each person and then categorized them as having none, single, or multiple disabilities as shown in Table 1. Two issues arise from this approach. First, the six disabilities are different in nature and present different challenges to respondents. However, our focus here is on the burden of single versus multiple disabilities in light of the absence of sufficient attention to multiple disabilities in the literature (Stevens et al., 2016). Second, there are differences in severity of the disabilities. In this case, we recognize that a person with two disabilities may be less burdened by them compared with someone else with a single but severe disability. However, the ACS does not query respondents about the severity of reported disabilities. Hence, we ignore the important issue of severity and focus on the burden of single versus multiple disabilities as it is also known that socioeconomic status decreases as disabilities increase in number (Stevens et al., 2016).
Descriptive Statistics.

Factors associated with the likelihood of disability are outlined in Table 1. All variables except age of respondent are categorical. We used information on year of entry and year of data collection to compute duration of stay for respondents who are immigrants. Information on whether or not respondents identified as Hispanic or non-Hispanic enabled us to sort cases into race/ethnicity categories such that all Hispanics of any race were classified as Hispanic, whereas the other identified races (Asian, Black, White) remained non-Hispanic. Furthermore, we excluded American Indian, Alaskan Native, Native Hawaiian, and other Pacific Islanders from the analysis because they represented less than 1% of the sample.
We used a cross tabulation of disabilities with world region of birth to begin the analyses. Our aim was to assess whether there is a significant association between these two variables using a chi-square test of independence. We then used multinomial logistic regression procedure in SPSS Statistics 22 to evaluate the effects of various factors (listed in Table 1) on the odds of reporting single and multiple disabilities compared with none.
Results
As shown in Table 1, respondents averaged nearly 65 years of age and about 73% reported no disabilities, about 12% had only one disability, and about 15% reported multiple disabilities ranging from two to six. Native-born respondents amounted to 88% of the subsample. About 79% identify as White (non-Hispanic), whereas Hispanic-origin respondents constitute some 7%. The rest identified as Black (9%) and Asian (4%). Respondents were mostly female (about 54%). The majority were currently married (62%), whereas more than half of the respondents were high school graduates (51.70%), and 10% were living in poverty.
Table 2 shows the distribution of disabilities by world region of birth. Most people (73.1%) do not report any disabilities. However, a higher percentage of foreign-born respondents (75%–82%) fall in this category than native-born respondents (72.5%). More native-born respondents (15.1%) also report multiple disabilities than foreign-born respondents. Among the foreign-born, European-born respondents report a higher level of multiple disabilities (14.3%) than the other categories. Asian-origin respondents (7.4%) report the lowest level of single disability, whereas African-origin respondents (9.4%) report the lowest level of multiple disabilities. Overall, there is a significant association between place of origin and level of disabilities (χ2 = 668.7; p < .001). Hence, we conclude that region of birth not only makes a difference in reports of disability among aging people in the United States, but also influences the level of disabilities (none, single, or multiple) among this population.
Level of Disability by World Region of Birth.

Note. χ2 = 688.7; p < .001.
Following multinomial logistic regression (Table 3), respondents who identified Latin America as their region of birth had 18% lower odds of reporting both single and multiple disabilities relative to their counterparts who were born in the United States. These odds were nearly 30% higher for multiple disabilities reported by respondents from the Asian region relative to those born in the United States. Race/ethnicity also significantly affects the relative odds of single and multiple disabilities. Although the odds were significantly lower for Asians (23% and 22%, respectively, for single and multiple disabilities) relative to the Whites, they were higher for Hispanics and Blacks. For Hispanics, the odds of reporting a single disability were 16% higher and, for Blacks, they were 10% higher compared with Whites. In the case of multiple disabilities, both Hispanic and Black respondents had roughly 30% higher odds than Whites. Each additional year of age was associated with higher odds of reporting single (3%) and multiple (4%) disabilities.
Multinomial Logistic Regression of Single and Multiple Disabilities with Interaction Terms.

Note. OR = odds ratio.
Contrast category.
p < .05. **p < .01. ***p < .001.
Contrary to expectation, duration of stay had no significant association with the odds of single and multiple disabilities except that immigrants who had lived in the United States for 10 to 19 years reported significantly lower odds (about 15% lower) of single disability compared with the native-born population. In general, immigrants (naturalized and noncitizens) experienced lower levels of single and multiple disabilities compared with the native-born. These lower odds were significant for multiple disabilities. In the case of single disability, only noncitizens had significantly lower odds. Males reported 22% higher odds of a single disability and 13% higher odds of multiple disabilities compared with females. Although being either currently married or widowed was associated with lower odds of having a single disability (26% and 5%, respectively), being separated was associated with higher odds by 5%, compared with those who had never married.
However, the odds of reporting multiple disabilities were reduced for respondents who were either currently married, widowed, separated, or divorced compared with their counterparts who were never married. Respondents with veteran status reported significantly higher odds of both single (35%) and multiple (21%) disabilities. Higher educational attainment had negatively significant association with the odds of both single and multiple disabilities. Compared with college graduates, respondents who had at most a high school degree reported 46% and 68% higher odds of single and multiple disabilities, respectively. Similarly, for respondents with less than high school education, the odds were about double and triple those of college graduates. Also, people who were below the poverty line had higher odds of reporting both single and multiple disabilities (respectively about 60% and 85% higher) compared with their counterparts who were above the poverty line. In addition, both unemployed and respondents in public sector reported higher odds of both single and multiple disabilities compared with their counterparts who were self-employed.
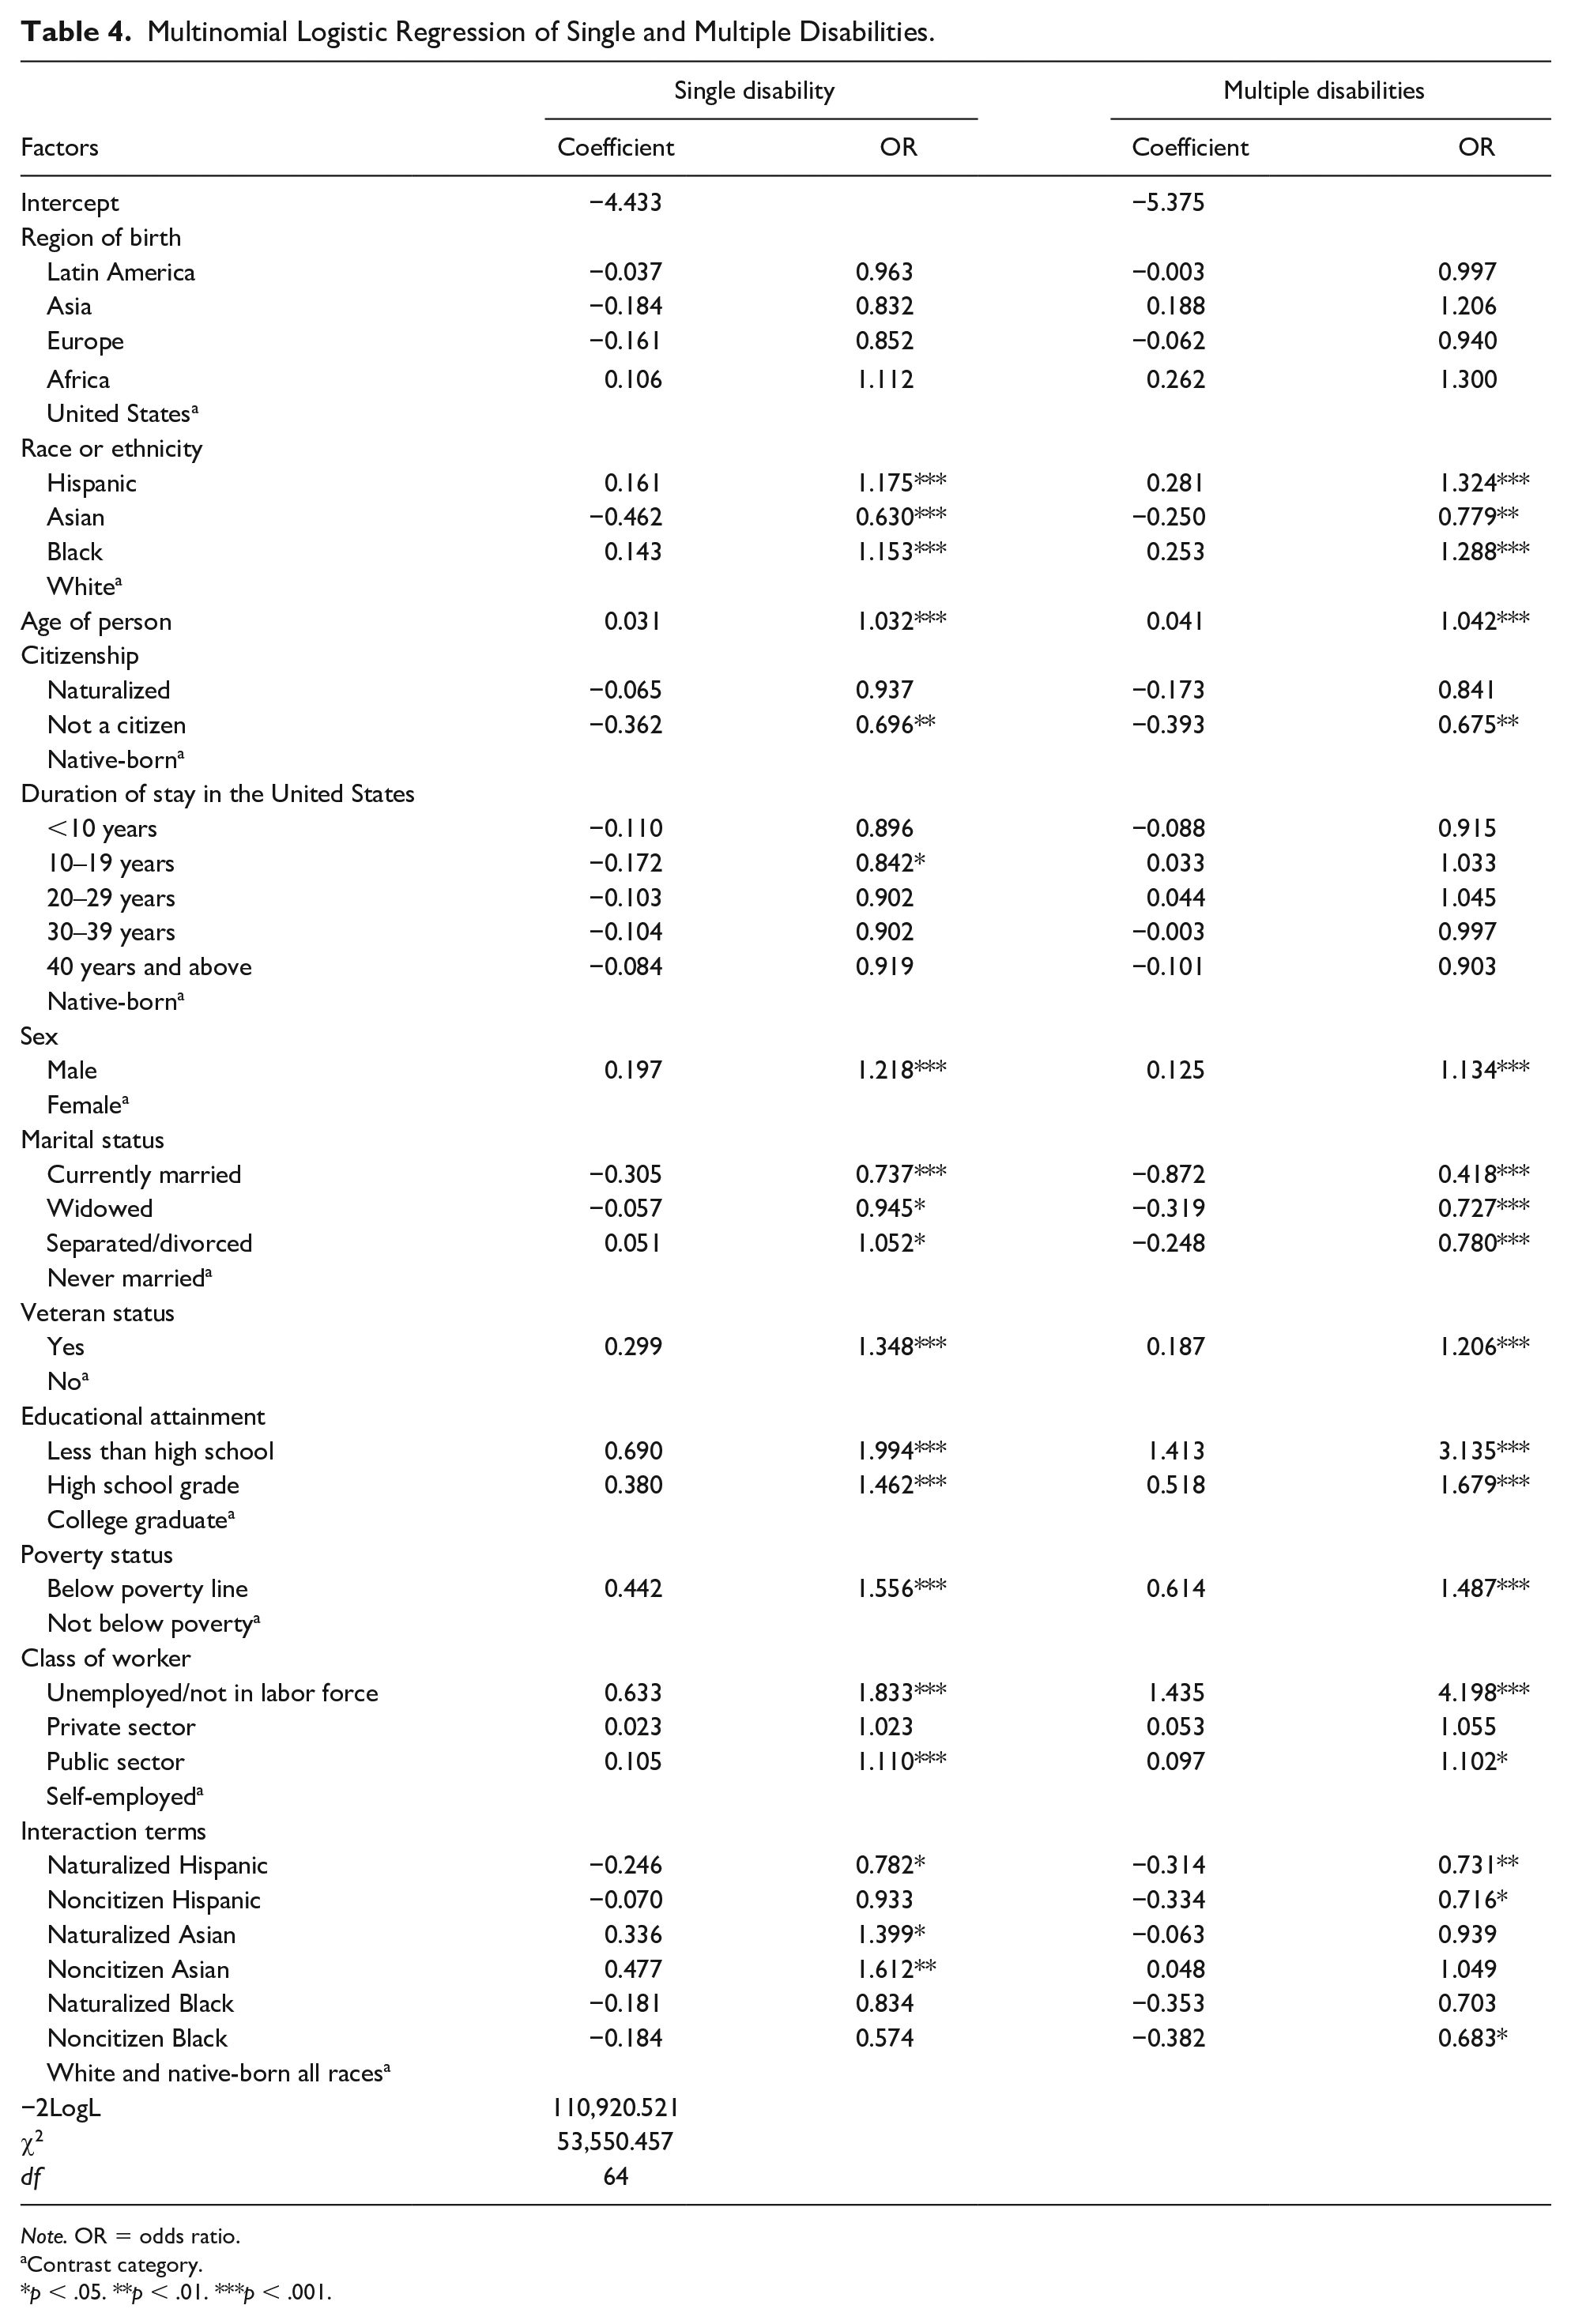
Adding the interaction terms for citizenship status by race in Table 4, region of birth turned out to be statistically nonsignificant for both single and multiple disabilities. Specifically, being born in Latin America no longer reduced the odds in reports of both single and multiple disabilities. However, compared with Whites and native-born of all races, both Hispanics who were either naturalized or were noncitizens had lower odds of reporting multiple disabilities (27% and 28% lower, respectively), whereas naturalized Hispanics also had significantly reduced odds (22%) for a single disability. This should be viewed against the results in Table 4 that the main effect of being Hispanic showed significantly higher odds of both single and multiple disabilities and that noncitizens retain a favorable position with significantly reduced odds of disability. Similarly, noncitizen Black respondents also had about 32% lower odds of reporting multiple disabilities compared with Whites and native-born of all races even though the main effect of being Black is to raise the odds of such disabilities. For naturalized and noncitizen Asians, the odds of a single disability were significantly higher by about 40% and 61%, respectively, even though the main effect of being Asian is to reduce the odds of single disability.
Multinomial Logistic Regression of Single and Multiple Disabilities.
Note. OR = odds ratio.
Contrast category.
p < .05. **p < .01. ***p < .001.
Discussion
The number of people with a disability will increase as the U.S. population ages. However, the proportion of aging people that report single or multiple disabilities is not the same among all population groups in this study. Region of birth differences in reported disabilities show that lower proportions of immigrants reported disabilities relative to native-born Americans as reported in other studies (Elo et al., 2011; Melvin et al., 2014). But, unlike other studies, we found that although Asian-born immigrants (Table 2) reported the lowest level of single disability, African immigrants reported the lowest level of multiple disabilities. Also, the race factor in odds of reporting disabilities shows that self-identified Asians had an advantage over Whites with regard to both single and multiple disabilities, whereas Black and Hispanic respondents fared worse than Whites for both single and multiple disabilities. These findings concur with previous studies that report lower rates of disability among Asians compared with Black and White adults about two decades ago by Fujiura et al. (1998) and the disability disadvantage among Hispanic and Black older people relative to their White counterparts (Chinn & Hummer, 2016; Dunlop et al., 2007; Schoeni et al., 2005). This shows that the race factor in odds of having disabilities has persisted over decades and is still a significant issue for minorities, especially for Blacks and Hispanics. However, the “healthy immigrant hypothesis” holds for foreign-born Hispanics (naturalized or noncitizen) even though being Hispanic does not confer a healthier status in terms of disabilities. It also applies to noncitizen Blacks. On the other hand, Asians, as a racial group, retain a health advantage but the healthy immigrant hypothesis does not work for Asian immigrants as it does for Hispanic immigrants.
Moreover, the analysis found that, overall, aging immigrants (both naturalized [Table 3] and noncitizens [Tables 3 and 4]) have lower odds of disability than native-born. The advantage is more strongly revealed for immigrants who are noncitizens. This is in line with the “healthy immigrant” hypothesis which posits a health advantage for immigrants over native-born presumably for as long as they have not yet fully acquired health-damaging habits of the host country. It may also reflect a more recent migration experience. An examination of the data reveals that nearly two-thirds of noncitizen immigrants have been in the United States for less than 30 years before data collection, whereas a similar proportion of naturalized immigrants have been in the country for 30 years or more. Although this cross-sectional data set does not allow for an examination of the time it takes immigrants for their health to deteriorate, a longitudinal data set will be able to address this fact and also the time of onset of disabilities for all the population groups. Knowledge of this information will be important for stakeholders for disability-related programs and policies.
Another take from these results is that the first models without interaction terms (Table 3) found some significant effects for region of birth. In particular, only Latin-American-origin respondents returned significantly lower odds of single and multiple disabilities with Asia-born respondents reporting significantly higher odds of multiple disabilities. These results are not repeated once we introduce race/ethnicity-by-citizenship interaction (Table 4). We believe that this emanates from a relationship between place of origin and race/ethnicity. For example, although European-origin respondents are overwhelmingly White, African-origin respondents are also predominantly Black. Consequently, teasing out the effects of race/ethnicity directly and through the interaction terms renders place of birth no longer significant in the analysis. Race/ethnicity is thus an important determinant of disability among older people in the United States regardless of place of birth and other factors. An important problem to investigate in future studies is which factors significantly account for race/ethnic variation in disabilities, knowing that socioeconomic, physiological, and environmental factors as well as genetics all account for health, health behavior, and disability.
Limitations
Some limitations need to be reported. The study used cross-sectional data and causality cannot be inferred. Second, the time of entry to the United States may not be accurately estimated as some immigrants may enter and leave the United States several times before permanently residing in the country (Redstone & Massey, 2004). Third, the ACS did not ask respondents about the severity of disabilities.
Conclusion
Despite the limitations noted above, this study shows that there are some differences in the factors that account for the odds of reporting single and multiple disabilities among older Americans. These findings add to the disability, race/ethnicity, and place of birth literature. In addition, although there was some evidence of the healthy immigrant hypothesis, race/ethnicity appeared to be an overarching factor to account for both single and multiple disabilities. This study was able to tease out the impact of duration of stay and race/ethnicity on odds of disabilities in the United States among aging Americans. This is an important contribution to the healthy immigrant debate and race/ethnic disparity in health and disability.
Footnotes
Declaration of Conflicting Interests
The authors declared no potential conflicts of interest with respect to the research, authorship, and/or publication of this article.
Funding
The authors received no financial support for the research, authorship, and/or publication of this article.