
Abstract
Background
Ageism is the systematic stereotyping of and discrimination against older adults (Butler, 1969). Unlike other forms of prejudice, ageism is considered more socially acceptable (Palmore, 2003) and seems to be the strongest among all the studied social biases (Nosek et al., 2002). Longitudinal studies demonstrate that having negative stereotypes and attitudes toward older adults at younger ages were associated years later with cardiovascular disease (Levy et al., 2009), memory impairment (Levy et al., 2012), decreased capacity to recover from disability (Levy et al., 2012), hearing loss (Levy et al., 2006), diminished will to live (Levy et al., 1999), lower participation in preventive activities (Levy & Myers, 2004), lower perception of functional health (Levy et al., 2002), and poor recovery after myocardial infarction (Levy et al., 2006). Furthermore, these problems individually or in combination may have increased the risk for all-cause hospitalization by 50% (Levy et al., 2015), and reduced longevity (Levy et al., 2002) compared with people who harbored more positive explicit attitudes toward old age. There is no comparable longitudinal data on individuals with implicit ageist attitudes. Although many studies have focused on the ageist attitudes of health care professionals and their pernicious effects on older patients, this and other longitudinal studies focus on individuals’ attitudes toward their own aging process. Two theories may serve to explain these findings. The theory of stereotype embodiment proposes that a lifetime exposure to widespread ageism leads to older persons’ internalization of ageist messages which then become part of their unconscious beliefs about older persons in general (Levy, 2009). The stereotype threat theory posits that under specific conditions involving widely held stereotypes, older persons would act subconsciously to fulfill those stereotypes, even when the outcome becomes detrimental to themselves (Lamont et al., 2015).
Devine (1989) studied prejudice using dual process models that include explicit and implicit levels. Explicit bias involves deliberative, controlled processes. In contrast, implicit bias involves automatic, unconscious processes. Explicit biases are assessed through surveys and questionnaires whereas implicit biases are assessed with measures of automatic behavior such in the Implicit Association Test (IAT; Greenwald et al., 1998). However, evidence shows that explicit, self-report measures may be influenced by social expectations, political correctness, answering style, interpretations of individual item wording, or limits of participant memory (Amodio & Devine, 2006; Dovidio et al., 2002; Puhl & Brownell, 2006; Puhl et al., 2005; Schwartz et al., 2003; Vanman et al., 1997). Most studies dealing with the longitudinal outcomes of ageism have used explicit measures. Implicit bias, however, may better predict behaviors toward older people than self-report measures (Greenwald et al., 2009; Roddy et al., 2011). The IAT is the most well-known and used implicit measure (Greenwald et al., 1998). The IAT evaluates the overall strength of associations between concepts by ascertaining individuals’ reaction time (latency) in response to categorization tasks (Greenwald et al., 2002). In many instances, both controlled and automatic processes are operating independently and concurrently (Greenwald et al., 2003) yet may display opposite bias. Explicit and implicit attitudes may contribute to higher risk for poor clinical outcomes and higher health care utilization.
The purpose of the current study was to determine the association of explicit and implicit ageism with all-cause hospitalizations and mortality in a sample of Veterans. This study predicted that explicit and implicit ageist attitudes will be associated with a greater risk for all-cause hospitalizations and mortality after adjustment for covariates.
Method
Design and Participants
This is a retrospective cohort study of community-dwelling Veterans 50 years and older who were receiving outpatient care at a VA (U.S. Department of Veterans Affairs) facility between July 2014 and April 2015. Veterans were included who met the following criteria: enrollment in a VA clinic, cognitively intact (Mini-Cog of > 3), and nondepressed (Patient Health Questionnaire–2 [PHQ-2] of < 3), and were followed for up to 3 years. After obtaining an exempted review status from the institutional review board (IRB) department in 2013, an addendum was submitted in 2018 to conduct a retrospective electronic health record review to obtain data from these participants to determine all-cause hospitalizations and mortality. All patients signed an informed consent and the study was done following the Declaration of Helsinki.
Measures
All consented eligible participants completed online versions of a sociodemographic questionnaire and the following instruments.
Kogan’s Attitudes Toward Old People (KAOP) Scale
The scale measures explicit attitudes toward older persons. It is easy to score and fast to complete. It assesses participants’ opinions and stereotypes regarding older adults: their intellectual abilities, image, levels of dependence, personality, living situation, personal appearance, influence, and the individuals’ feelings of discomfort in the presence of older adults. The instrument consists of 17 matched pairs of positive and negative statements about older individuals. Responses are rated on a 6-point Likert-type scale that ranges from strongly agree to strongly disagree. The possible scores range between 34 and 204 with higher scores representing more positive attitudes toward older individuals (Kogan, 1961). A score of 102 indicates a neutral attitude (Kearney et al., 2000).
The IAT
To measure implicit bias, participants completed an online version of the IAT (Inquisit Millisecond Software, Seattle, WA). Participants are asked to pair the terms “Old People” and “Young People” with both positive (a total of 10 words) and negative (a total of 10 words) “affective” attributes, such as unpleasant–pleasant. The words are combined with 10 photographs of older individuals and 10 photographs of younger individuals according to established IAT protocols (Figure 1). Next, each participant completed an evaluative IAT (Greenwald et al., 1998), in which they paired pleasant and unpleasant words with pictures of old and young persons (Table 1). Target category and attribute labels remained on the top left and top right of the screen throughout the task, while stimulus pictures and words appeared at the center of the screen. A red “X” appeared whenever participants made an error, which they were required to correct before moving onto the next trial. Latencies were recorded to the correct response. Participants were instructed to make their classifications as quickly and accurately as possible. Greenwald developed an algorithm for scoring of the IAT, which is a timed word classification task (Greenwald et al., 2003).

Implicit Association Test screenshot.
Implicit Association Test.
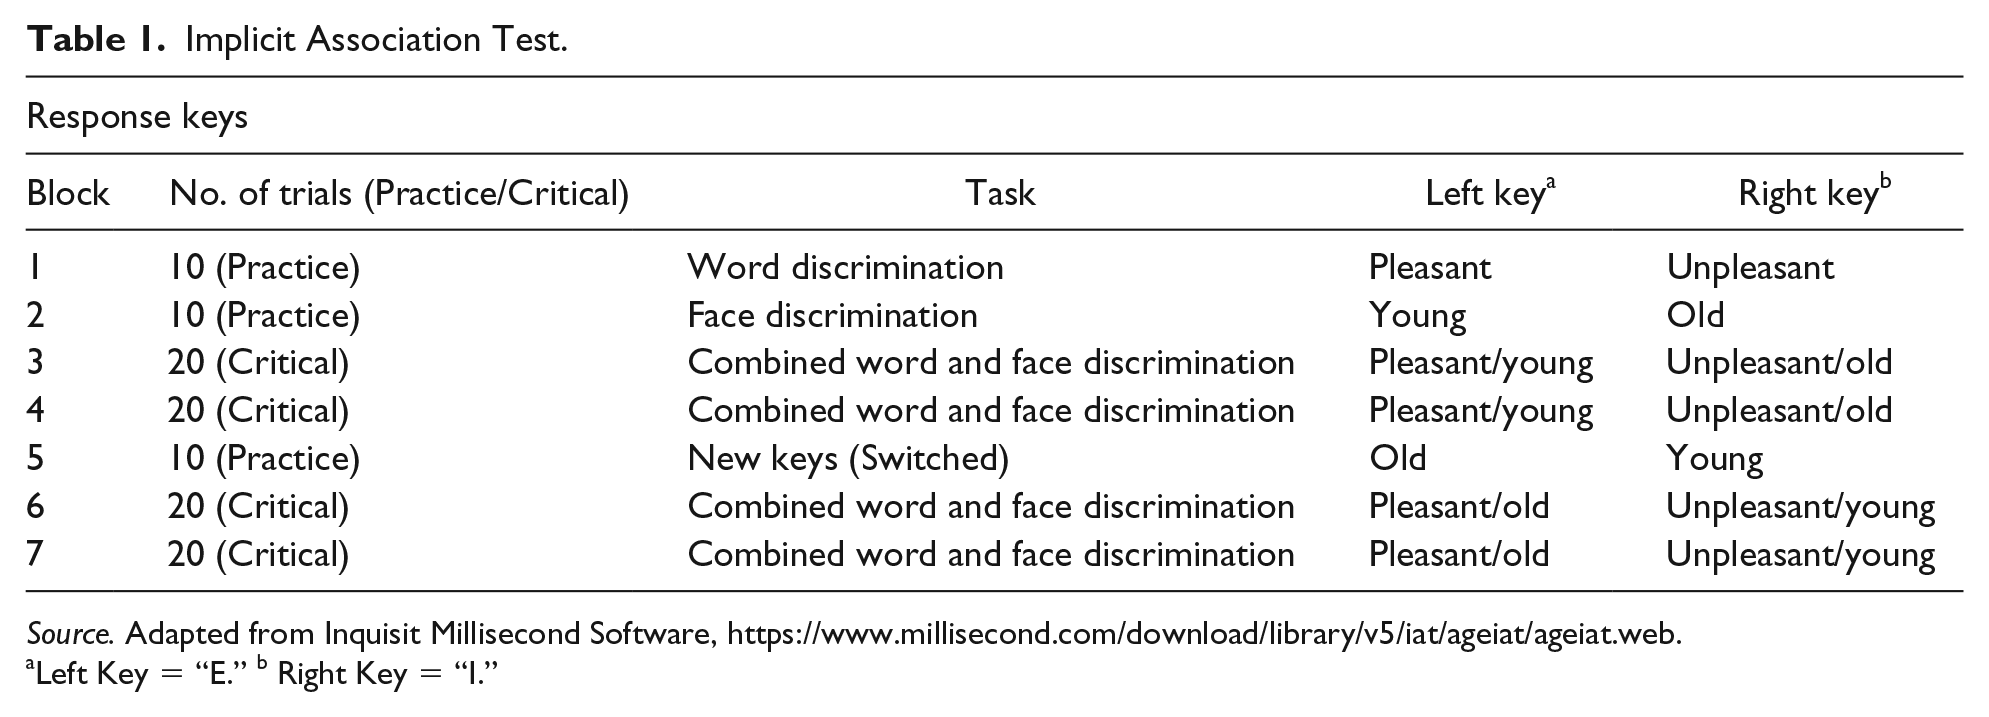
Source. Adapted from Inquisit Millisecond Software, https://www.millisecond.com/download/library/v5/iat/ageiat/ageiat.web.
Left Key = “E.” b Right Key = “I.”
In the present study, positive IAT d scores indicated stronger associations of negative attributes with old people compared with young people, whereas an IAT d score of 0 indicated no difference in associations with old people compared with young people. IAT d scores were categorized into preference for older individuals (≤.15), neutral (>−.15, ≤.15), slight (IAT d score > .15), moderate (IAT d score > .35), or strong (IAT d score ≥ .65) preference for younger individuals (Greenwald et al., 2003).
Outcome variables
The two primary study outcomes were hospitalization and mortality.
Hospitalizations
Following the initial assessment of explicit and implicit ageism, patients were followed through September 30, 2018. Data on all-cause hospitalizations at the VA was obtained from the VA Corporate Data Warehouse (CDW). The number of hospital admissions for medical, mental health, and surgical teams were captured during the previous year and prospectively for the follow-up period. Trained research staff recorded the primary diagnosis for hospitalization by International Classification of Diseases codes from inpatient treatment files; the primary reason for hospitalization was grouped by diagnosis.
Mortality
All-cause mortality was verified via official source including VHA (Veterans Health Administration) facilities, death certificate, and National Cemetery Administration available from the VA CDW. There is high agreement (91%–99%) between dates of death recorded in the CDW and dates of death recorded in external sources that feed the VHA Vital Status File. The last day of follow-up was September 30, 2018.
Data Analysis
Baseline characteristics are presented as frequency (percent) for categorical variables, as M ± SD for normally distributed continuous variables, and as median (interquartile range [IQR]) for continuous variables with skewed distributions. We report descriptive statistics of age, education, marital status, race, ethnicity, median household income, number of medications, body mass index (BMI), and Charlson comorbidity index (Charlson et al., 1987). The 5-Digit ZIP Code Tabulation Area (ZCTA) was used to determine the median household income in the past 12 months (in 2011 inflation-adjusted dollars) by racial groups (U.S. Census Bureau, 2007–2011). We compared the mean scores of KAOP and IAT using one-way analysis of variance (ANOVA) and comparisons of proportions were carried out using the Pearson chi-square test of homogeneity. The association of explicit and implicit ageism with hospitalizations was determined with the Andersen–Gill model (Amorim & Cai, 2015), accounting for repeated hospitalizations performing univariate analysis, as well as multivariate analysis adjusting for age, race (White vs. Non-White), ethnicity (Hispanic vs. Non-Hispanic), median household income, age-adjusted Charlson comorbidity index, and hospitalizations in the previous year. The proportional hazard assumption was tested using scaled Schoenfeld residuals and was found to be valid. Follow-up duration in years was calculated as follows: (September 30, 2018 − ageism assessment administration date) / 365. Cox proportional hazards regression analysis was performed to calculate the hazard ratios (HRs) and 95% confidence intervals (CIs) of survival for scores of KAOP Scale and the IAT. Known factors associated with mortality (age, race, ethnicity, mean household income, and multimorbidity) were considered for inclusion in the adjusted analysis. Collinearity among covariates was quantified using the variance inflation factor, taking a cutoff of two as exclusion criterion. We did not exclude variable having a high collinearity among themselves. A Pearson correlation was run to assess the relationship between the KAOP Scale and IAT. Associations were considered significant if p < .05. All analyses were performed using the SPSS 24.0 for Macintosh (SPSS, Inc., Chicago, Illinois) and SAS version 3.71 (SAS Institute Inc., Cary, North Carolina). All statistical tests were two-tailed, and statistical significance was assumed for p < .05.
Results
Patient Characteristics
A total of 381 participants were included in the study. Patients were 89.8% male, 48.0% White, 87.9% non-Hispanic, and the mean age was 60.5 (SD= 7.2) years. Table 2 shows participant characteristics. The KAOP scores revealed that 364 (95.5%) of the 381 participants showed a general positive attitude toward older people (scores > 102). In contrast, of the 339 participants completing the IAT, scores showed that 22 (5.8%) preferred older people, 32 (8.4%) were neutral, 43 (11.3%) had a slight, 63 (16.5%) had a moderate, and 179 (47.0%) had a strong preference for younger individuals. There was no significant correlation between the KAOP and the IAT scores (r = .043, p = .431).
Participant Characteristics.
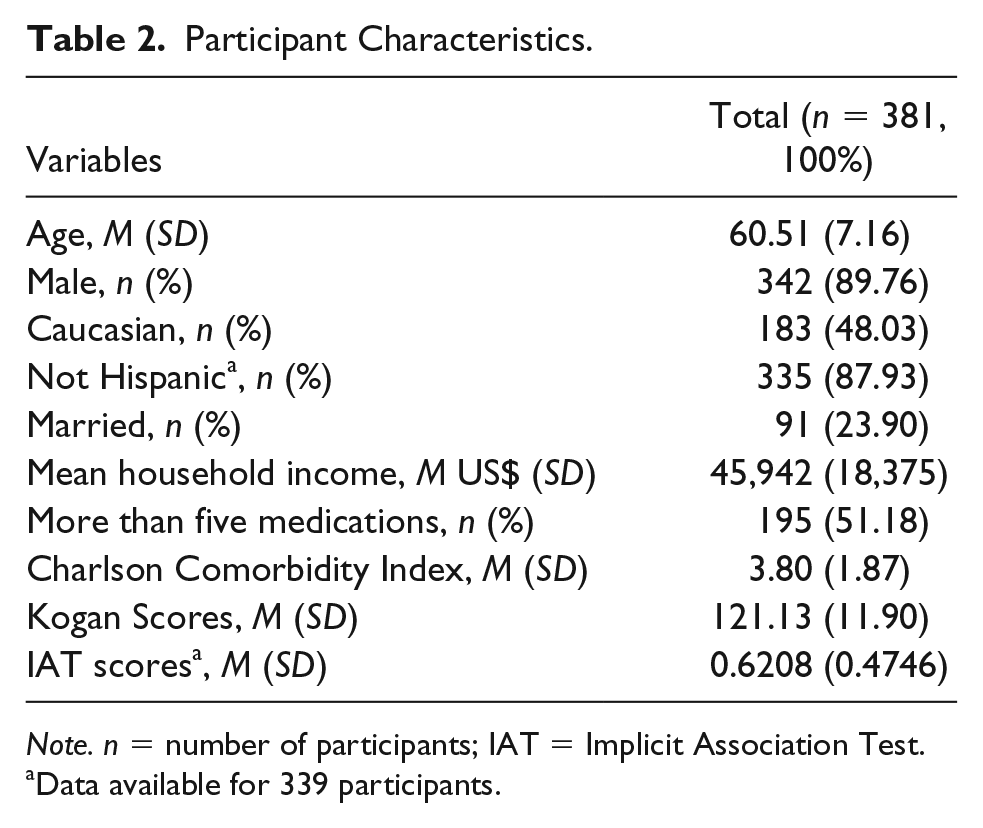
Note. n = number of participants; IAT = Implicit Association Test.
Data available for 339 participants.
Hospitalizations
There were 584 all-cause hospitalizations over a median follow-up period of 1,440 days (IQR = 100) with the range between 0 and 47 hospital admissions. Over the follow-up period, 200 participants (52.5%) did not have any hospitalizations whereas 181 (47.5%) had at least one hospitalization. As shown in Table 3, using the Andersen–Gill model for recurrent-event analysis of hospitalizations, fully adjusted for covariates, including age, race, ethnicity, median household income, Charlson Comorbidity Index, and hospitalizations in the previous year, neither explicit ageism as measured with the KAOP, adjusted HR = 1.01 (95% CI = [0.99, 1.03]),p = .286, nor implicit ageism as measured with the IAT scores were associated with risk for hospitalizations, adjusted HR = 1.05 (95% CI = [0.69, 1.59]), p = .824.
Association Between Explicit (KAOP) and Implicit Ageism (IAT) and Risk of Hospitalizations at Follow-Up.

Note. Adjusted for age, race, ethnicity, median household income, Charlson Comorbidity Index, and hospitalizations in the previous year. KAOP = Kogan’s Attitudes Toward Old People; IAT = Implicit Association Test; CI = confidence interval.
Data available for 339 participants.
Mortality
Over the median follow-up period 35 deaths occurred. As shown in Table 4, using a Cox’s regression analysis fully adjusted for covariates, including age, race, ethnicity, median household income, and Charlson Comorbidity Index, neither KAOP scores nor IAT scores were associated with risk of all-cause mortality during follow-up, HR = 1.02 (95% CI = [0.99, 1.05]), p = .157, and HR = 0.72 (95% CI = [0.34, 1.51]), p = .380, respectively (Table 4).
Association Between Explicit (KAOP) and Implicit Ageism (IAT) and Risk of Mortality at Follow-Up.
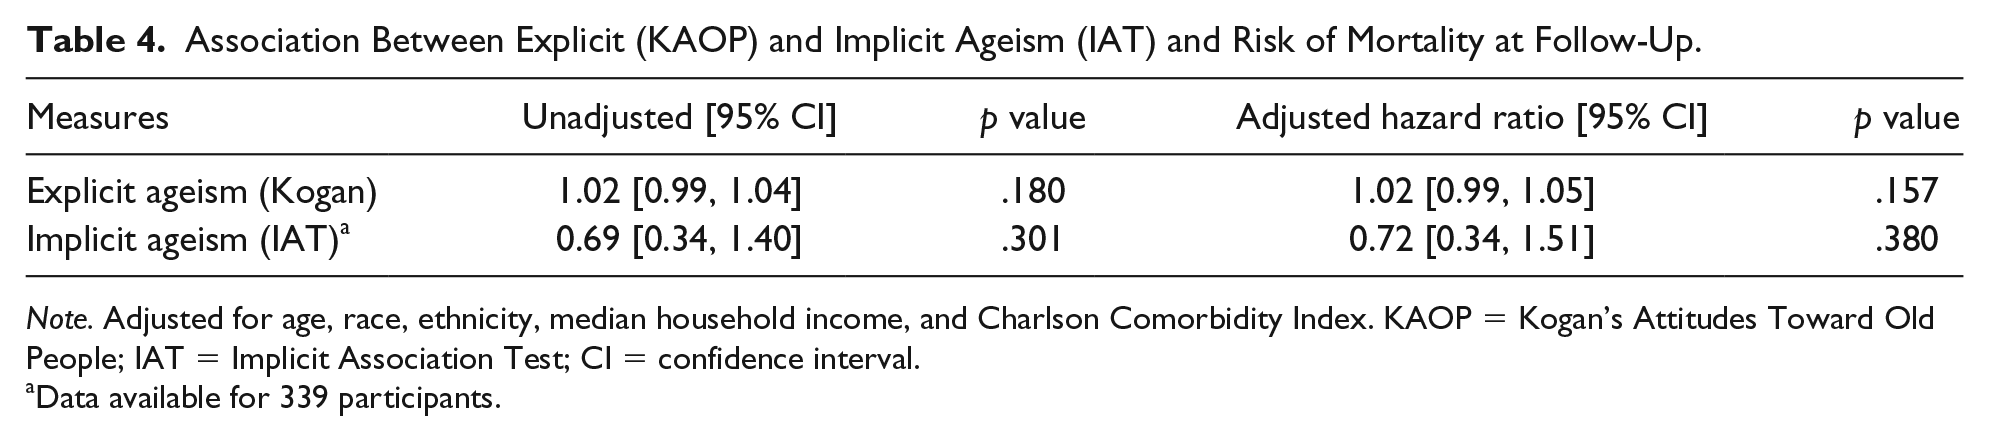
Note. Adjusted for age, race, ethnicity, median household income, and Charlson Comorbidity Index. KAOP = Kogan’s Attitudes Toward Old People; IAT = Implicit Association Test; CI = confidence interval.
Data available for 339 participants.
Discussion
The predicted hypothesis that explicit ageism measured with the KAOP Scale and implicit ageism as measured with the IAT would be associated with a greater risk for increased rate of all-cause hospitalizations and mortality was rejected. Neither explicit nor implicit ageism were associated with an increased risk for all-cause hospitalization or mortality on follow-up. The KAOP and IAT scores were not correlated: The overwhelmingly majority of participants showed a favorable explicit attitude while on the contrary more than three quarters showed negative implicit bias toward older individuals.
Only one longitudinal study with 10-year follow-up showed an association of explicit ageist attitudes with a 50% higher risk of hospital admission in those individuals with negative attitudes to aging (Levy et al., 2015). A total of 231 participants answered a single question from the Images of aging instrument (explicit measure) and were followed over time for the occurrence of hospitalizations verified by self-report. In contrast, this study included a larger sample size of a predominantly male sample of Veterans who completed evaluations of explicit and implicit ageist attitudes. Although also longitudinal, this study had a much shorter follow-up period. Another stronger factor is that the average age of this sample was 16 years younger than that of Levy’s study, a factor that may account for the lower hospitalization and mortality rates during the shorter follow-up period. Another explanation relates to how explicit ageism was assessed in this study. Whereas we used the KAOP scale which measures individual attitudes toward older people in general, it may not be evaluating the domain of personal attitudes to oneself as the other scales do. That is, older persons may hold more positive views of themselves than the view they have of other, in their opinion, more “typical” older persons. This dissociation between attitudes toward one’s own aging as compared with other older persons has been reported (Celejewski & Dion, 1998; Rothermund & Brandtstädter, 2003). Measures that focus on self-perceptions of aging domains may be more likely associated with future clinical outcomes than measures like the KAOP.
There are no previous studies linking implicit ageism at baseline with subsequent hospitalizations and mortality. Levy et al. has shown in experimental studies that individuals’ exposure to subliminal implicit primes was associated with behavioral, psychological, and physiological changes (Hausdorff et al., 1999; Levy, 1996; Levy et al., 1999) but there was not follow-up or ascertainment of the effects on hospitalization or mortality. The findings of a lack of causality between IAT scores and subsequent all-cause mortality may suggest that implicit ageist attitudes may not result in the internalization of those ageist attitudes as purported by the stereotype embodiment and stereotype threat theories that will eventually contribute to poor clinical outcomes. Once again, that these effects will appear on follow-up is still a possibility, but the mean age of this cohort might have shown at least a trend. Another factor is that despite their high multimorbidity burden Veterans have access to an integrated health care system that provides a range of medical and social services (Nelson et al., 2014; Rosland et al., 2013) which may ameliorate the negative effects of ageist attitudes on their health care outcomes and utilization.
Strengths of this study include the large number of participants with complete assessments of explicit and implicit ageist attitudes, inclusion of complete health care data from electronic health records, and a relatively large sample with a reasonable follow-up period. There are certainly some limitations. This study used a convenience sample of male Veterans at one medical center data, and ethnic, racial, educational, and socioeconomic composition may be different from other Veterans’ facilities and other community-based health care institutions in the United States. Problems with the predictive validity of the IAT should cause us to be cautious in selecting this instrument and interpreting its results when evaluating implicit ageist attitudes. Education might influence ageist attitudes but was not considered as a covariate in the analyses. Future cohort studies should include more diverse, randomly selected samples from varied geographic locations and health care systems. Nevertheless, the results and conclusions can have important clinical implications and can motivate future clinical and epidemiological studies.
Conclusion/Implications
The data suggest that neither explicit not implicit attitudes had an effect on all-cause hospitalizations or mortality in this sample of community-dwelling Veterans. Future research may benefit from longitudinal investigations of the impact of ageist attitudes in diverse populations on all-cause hospitalizations and mortality.
Footnotes
Declaration of Conflicting Interests
The authors declared no potential conflicts of interest with respect to the research, authorship, and/or publication of this article.
Funding
The authors disclosed receipt of the following financial support for the research, authorship, and/or publication of this article: This material is the result of work supported with resources and the use of facilities at the Miami VA Healthcare System (Geriatric Research Education and Clinical Center [GRECC]).
Ethical Standards
A protocol of this study was submitted to and approved by the Miami VA Healthcare System Institutional Review Board.