
Abstract
Introduction
The processes leading to the development of functional limitations and disability likely operate across the life course. Indeed, models of the disablement process emphasize its longitudinal nature and posit that interactions between the individual and his or her social, psychological, and physical environments are key elements in the development of functional limitations throughout the life course (Alvarado, Zunzunegui, Beland, & Bamvita, 2008; Makizako et al., 2018). A growing body of research highlights the importance of socioeconomic status (SES) in shaping these life course processes, beginning in early life and extending into middle and late life (Mann, Hayes, Basterfield, Parker, & Pearce, 2013; Willson, Shuey, & Elder, 2007). SES, defined by a range of measures spanning education, income, occupation grade, and subjective social status, is linked with outcomes including cardiovascular disease (Mensah, Mokdad, Ford, Greenlund, & Croft, 2005), cancer incidence, and all-cause mortality (Adler & Rehkopf, 2008). There is also evidence to suggest that poor SES has an impact on more proximal health outcomes such as diminished physical function (PF) (Louie & Ward, 2011; Minkler, Fuller-Thomson, & Guralnik, 2006) and physical limitations, antecedents for long-term outcomes such as disability. Understanding socioeconomic inequalities in physical function may further explain persistent disparities in age-related declines overall.
Research seeking to understand the development of functional limitations and disability among older adults must also account for the sustained impact of low SES throughout the life course. Life course studies suggest that function in adulthood and later life is often directly related to the social environment in childhood (Liu, Jones, & Glymour, 2010). For example, a study using the Health and Retirement Study found adults who experienced socioeconomic disadvantage in childhood lived fewer total years, and lived more years impaired compared with individuals from socioeconomically advantaged childhoods, a finding only partially mediated by adult educational attainment (Montez & Hayward, 2014). Yet, there is still much unknown about which socioeconomic indicators across the life course are most salient for later life physical function and how these indicators may work together to augment risk for functional impairment in later life.
While formally testing the effects of life course SES on physical function would require panel data on SES and physical function, Ben-Shlomo, Cooper, and Kuh (2016) suggest an alternative method of using cross-sectional data with a wide age range. Using data from a community-based cohort study of individuals aged 30 to 90+ years, this study examined the associations of multiple indicators of SES, both in early life and late life, with physical function. It was hypothesized that low SES, both in early- and late-life, would be associated with poor physical function across the life course. Furthermore, it was hypothesized that individuals who experience sustained low SES, both in childhood and adulthood, would have worse physical function compared with those of sustained high SES. Understanding the association between SES and physical function across the life course may give insights into the origins of health disparities in aging, and point to potential interventions.
Method
Study Population
The study sample was drawn from the Physical Performance Across the LifeSpan (PALS) study (Hall et al., 2017), which aims to understand physical and environmental factors over the lifespan that may contribute to age-related changes in physical function. PALS is a nested cohort study of community dwelling adults at least 30 years of age who participated in the Measurement to Understand the Reclassification of Disease of Cabarrus and Kannapolis (MURDOCK) Study (Bhattacharya et al., 2012; Hall et al., 2017). The study sample was prospectively recruited and stratified by sex and age, with oversampling for ages 60 years and above. Additional information on the MURDOCK study is given in Supplement 1.
All participants provided additional informed consent to participate in the PALS study that covered the collection of additional measures of physical function. There were 973 individuals in the original PALS study. We excluded individuals who were missing information on any of the covariates of interest for this study (12% of the original sample). Thus, the final study sample consisted of 859 individuals with complete covariate information. The study was approved by the Institutional Review Boards of Duke University Medical Center and the Carolinas Healthcare System.
Physical Function Measures
Physical function was assessed through the following functional tests: gait speed, aerobic endurance, and lower body strength.
Gait speed was measured using the 4-m walk test, adapted from the Short Physical Performance Battery (Cabrero-García, Primaria, & undefined, 2012). In the 4-m walk test, participants walked as fast as they could over a distance of 4 m. The fastest time of two trials is recorded and converted to gait speed (m/sec).
Aerobic endurance was evaluated with the 6-min walk test (Enright, 2003; Steffen, Hacker, & Mollinger, 2002). For the 6-min walk test, participants were instructed to walk as far as they could over 6 min using a self-selected pace. The distance walked during this time was recorded in meters.
Lower body strength was assessed with the 30-s chair stand test (Rikli & Jones, 2013). Participants were instructed to rise from a seated position in a chair as fast as they could for 30 s while keeping their arms crossed at the chest. The total number of chair stands the participant was able to perform was recorded.
Self-Reported Independent Variables
Five measures of SES were explored and are described below.
SES measures
Objective childhood SES
Objective childhood SES was measured through parental education. Responses were categorized in five groups as follows: (a) less than high school, (b) high school graduate, (c) some college or associate’s degree, (d) bachelor’s degree, and (e) master’s degree or higher. This study used the highest level of parental education reported for either parent.
Subjective childhood SES
Subjective childhood SES was measured through a self-response question that asked the participants how well off they felt they were while growing up. This variable was coded with five levels: (a) poor, (b) below average, (c) about average, (d) above average, or (e) quite well off.
Participant education
Responses were categorized in five groups as follows: (a) less than high school, (b) high school graduate, (c) some college or associate’s degree, (d) bachelor’s degree, and (e) master’s degree or higher.
Household income
Household income was categorized into five groups: (a) less than US$30,000; (b) US$30,000-$49,900; (c) US$50,000-$69,999; (d) US$70,000-$89,999; and (e) US$90,000 or more.
Socioeconomic trend (SET)
The SET variable was built to characterize an individual’s socioeconomic path, incorporating both his or her parents’ SES and his or her own SES (Figure 1). It was based on the highest parental level of education and the income of the participant at the time of interview (e.g., someone whose parents had less than a high school degree and whose current income averaged less than US$30,000 was classified as low-low). Five descriptive trends were identified: stable low, stable mid, stable high, and downward or upward trend.

Description of the socioeconomic trend variable incorporating both parental education and participant income.
Age Stratification
Age was assigned categorically in 10-year increments as a traditional marker of chronological time. To explore the sociological aspects of the aging process, age was also categorized into three groups based on likely work force participation. Those 30 to 59 years old (n = 273) were identified as “earners,” those 60 to 69 years old (n = 179) were classified as the “transitioners,” and those 70+ years old (n = 407) as “retired.” Additional details regarding the rationale for this age categorization are given in Supplement 1. Supplementary Table 1 gives additional details as to the breakdown of socioeconomic characteristics by age category.
Covariates
Demographic factors included age; self-reported race/ethnicity, which was categorized as non-Hispanic Black, non-Hispanic White, Hispanic, or Other; sex; marital status, categorized as married or with domestic partner, separated or divorced, never married, or widowed; and employment status, categorized as employed full-time, part-time, unemployed, retired, or other.
Statistical Analysis
Categorical variables were analyzed using the Pearson chi-square test and continuous variables were compared using the t test and reported as means with standard deviation. Class-level variables stratified by sex were analyzed with the analysis of variance (ANOVA) procedure. Multiple linear regression models were developed to examine the cross-sectional association between each physical performance measure and (a) objective childhood SES (parental education), (b) subjective childhood SES, (c) participant education, and (d) household income, independently. For each outcome, Model 1 shows the association with objective childhood SES, Model 2 with subjective childhood SES, Model 3 with current SES (education and household income), and Model 4 with all SES indicators together. All four models were adjusted for age, race/ethnicity, sex, marital status, and employment status.
Model 4 was then stratified by age and was used to estimate the association between each outcome of interest and all four measures of SES together. Age stratification was done to proxy life course processes. In the absence of longitudinal, panel data, utilizing cross-sectional data across a large age span is one method for approximating life course changes in the relationship between SES and physical function (Ben-Shlomo et al., 2016). Previous studies using the National Health and Nutrition Examination Survey have documented the utility of such an approach (Klein et al., 2011; Obisesan, Umar, Paluvoi, & Gillum, 2012). We also performed statistical analyses with an interaction term between age and each SES variable for each of the three functional measures. We found marginally significant interactions between parental education, household income, and age for both gait speed and aerobic endurance.
Finally, the association between the SET and each outcome was examined, controlling for age, race/ethnicity, sex, marital status, and employment status.
Adjusted regression models are presented with unstandardized betas (β) to ease interpretation of results. All reported statistical tests were double-sided, alpha .05. Statistical analyses were performed using SAS version 9.4 (SAS Institute, Inc., Cary, NC) and graphics using SAS JMP version 13.0 (SAS Institute, Inc., Cary, NC).
Results
Baseline Characteristics
The study sample included 859 individuals ranging in age from 30 to 90+ years; 53% were women and 86% were non-Hispanic White. Over two thirds reported being married (69%) and over half were retired (52%). Over three quarters of participants (80%) reported having a greater than high school education, and over half of the sample (57%) did not have a parent with more than a high school education. Fifty-six percent reported that their family SES was about average during their childhood. Further details of the participants’ baseline characteristics are presented in Supplementary Table 2.
Measures of physical performance (Table 1) showed that on average the participants had a gait speed of 1.80 m/s (SD = 0.48) as measured by the 4-m walk test. Their aerobic endurance, measured with the 6-min walk test, averaged 529.30 m (SD = 142.97). Participants completed an average of 14.76 chair stands in 30 s (SD = 6.00).
Physical Function Characteristics for the Full Sample and Stratified by Sex.
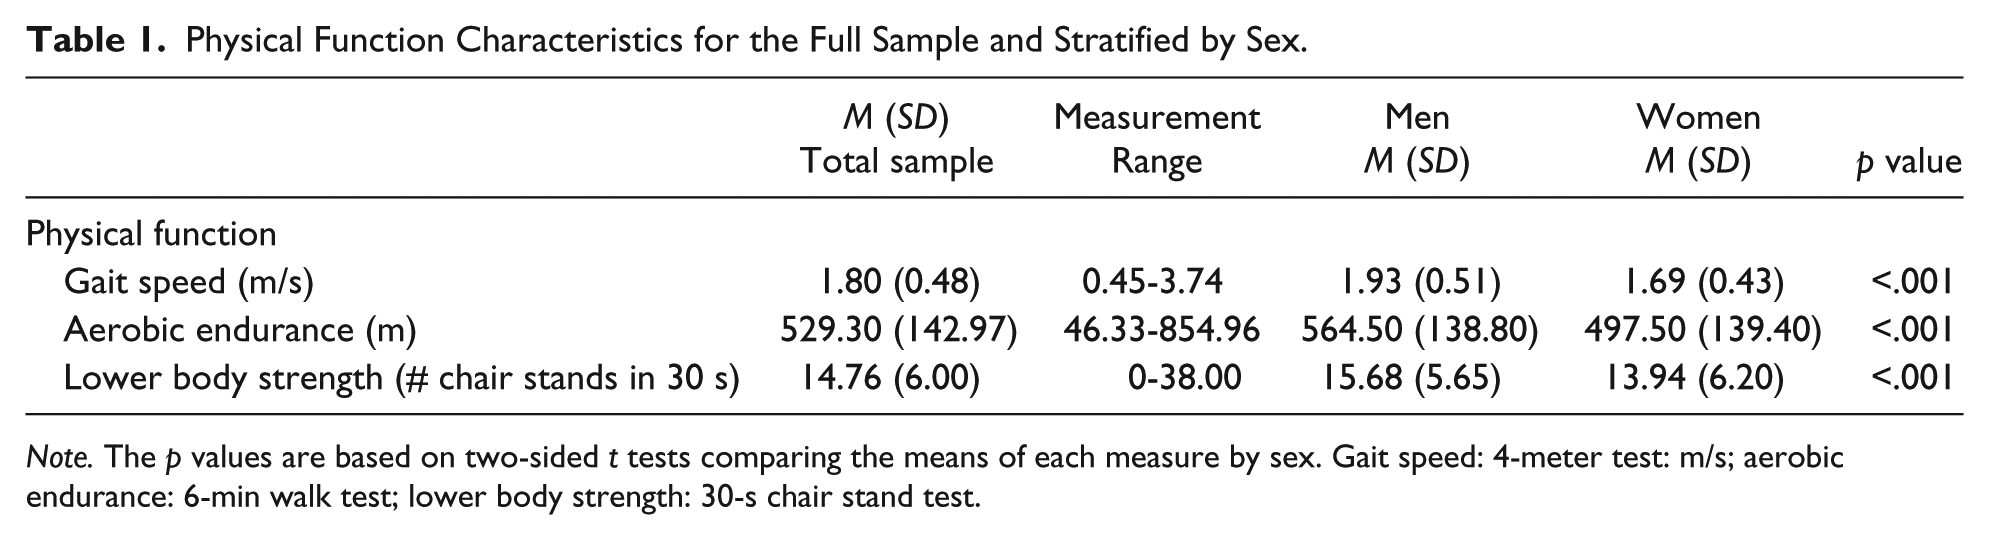
Note. The p values are based on two-sided t tests comparing the means of each measure by sex. Gait speed: 4-meter test: m/s; aerobic endurance: 6-min walk test; lower body strength: 30-s chair stand test.
The distribution of social status pathways from parent to offspring using the SET variable showed that 46% of participants were in a stable category, meaning both the participant and his or her parents had a similar SES; 29% were classified as stable low; 3% as stable mid; and 14% as stable high. Over one third of participants were classified with an upward SET whereby the participants’ SES was higher than that reported by his or her parents, while 17% had a downward SET meaning that the participants’ SES was lower than that reported by his or her parents.
Association Between SES and Physical Function
There was no association between either measure of early life SES and the physical function measures (Table 2). In the fully adjusted model (Model 4), only participant education was associated with gait speed. A one-unit increase in education was associated with a 0.08 m/s increase in gait speed (p < .0001). In the fully adjusted model, both participant education and annual household income were independently associated with aerobic endurance. A one-unit increase in education was associated with a 13.98 m increase in distance walked in 6 min (p < .01), and a one-unit increase in annual household income was associated with a 16.31 m increase in distance walked in 6 min (p < .001). We also found a significant association between both participant education and household income and lower body strength. In the fully adjusted model, a one-unit increase in education was associated with a 0.44 increase in the number of chair stands performed in 30 s (p < .05); additionally, a one-unit increase in household income was associated with a 0.34 increase in the number of chair stands performed in 30 s (p < .05).
Results of the Multivariable Regression Analysis Examining the Association Between Early- and Current-Life Socioeconomic Status and Three Physical Function Measures.
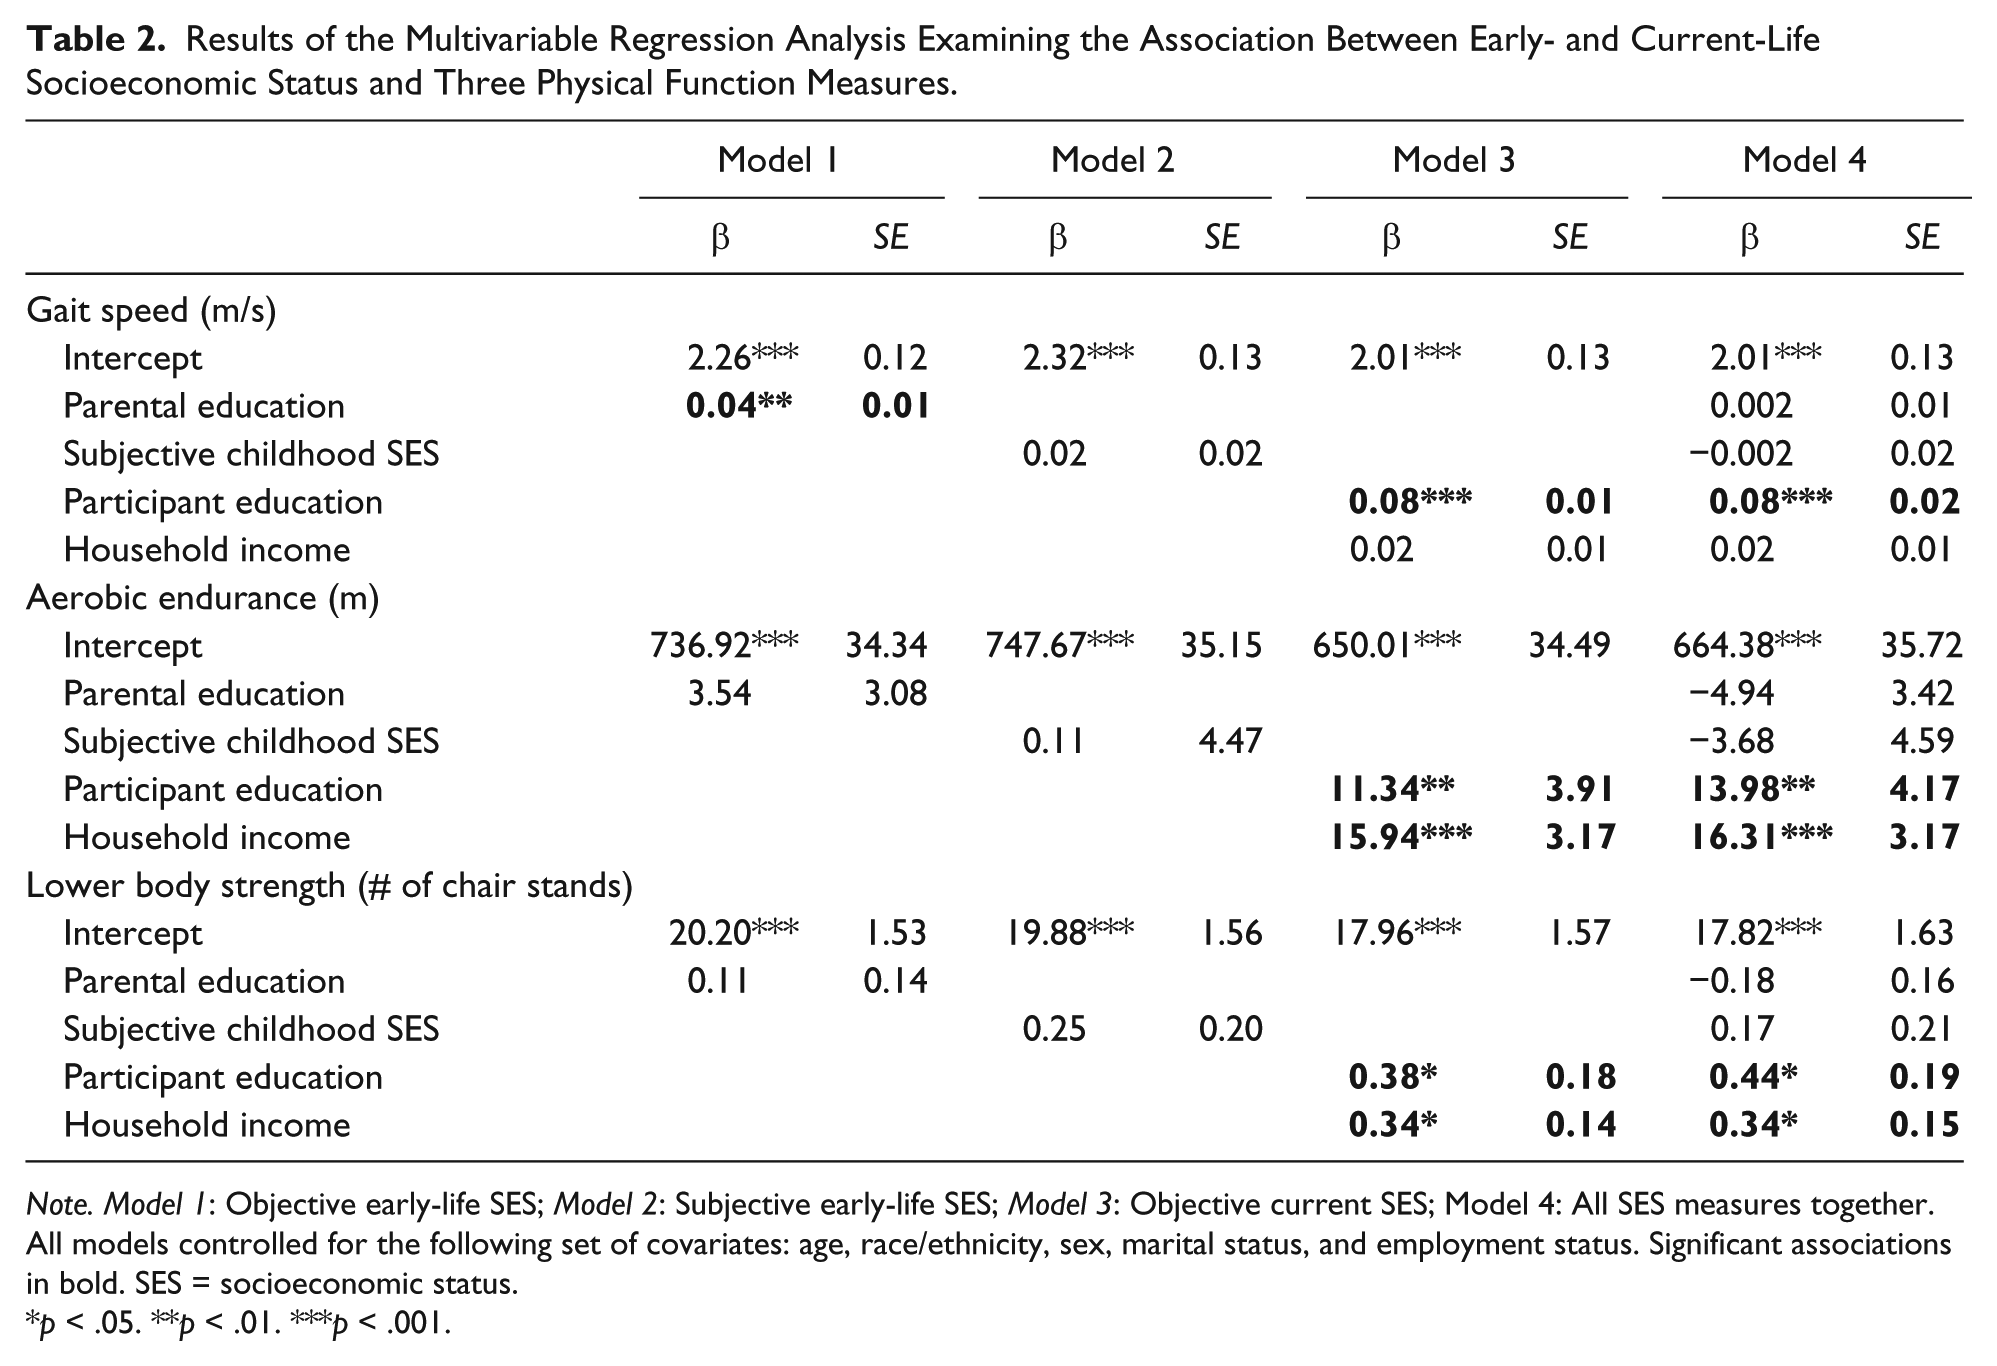
Note. Model 1: Objective early-life SES; Model 2: Subjective early-life SES; Model 3: Objective current SES; Model 4: All SES measures together. All models controlled for the following set of covariates: age, race/ethnicity, sex, marital status, and employment status. Significant associations in bold. SES = socioeconomic status.
p < .05. **p < .01. ***p < .001.
Association Between SES and Physical Function, Stratified by Age
Associations between SES and each physical function measure differed by age group (Table 3). Within the earning group (30-59 year olds), only participant education was associated with a 0.08 m/s increase in gait speed (p < .01). Among those transitioning (60-69 years), participant education was associated with all physical function measures, while household income was only associated with lower body strength. A one-unit increase in participant education was associated with a 0.14 m/s increase in gait speed (p < .001), 24.62-m increase in distance walked in 6 min (p < .01), and 1.03 increase in the number of chair stands performed in 30 s (p < .05). A one-unit increase in annual household income was associated a 0.59 increase in the number of chair stands performed in 30 s (p < .05). In the retired group (70+ years), only household income was associated with a 23.46-m increase in distance walked in 6 min (p < .001).
Results of the Multivariable Regression Analysis Examining the Association Between Early- and Current-Life Socioeconomic Status and Three Physical Function Measures Stratified by Age Category.

Note. All models controlled for the following set of covariates: race/ethnicity, sex, marital status, and employment status. Significant associations in bold.
p < .05. **p < .01. ***p < .001.
Association Between SET and Physical Function
In the SET analysis, those in the downward trend group walked 42.91 fewer meters in 6 min compared with those in the upward trend category (p < .001; Table 4). Compared with the upward trend group, those in the stable low trend group walked 55.02 fewer meters in 6 min (p < .001), had a gait speed reduced by 0.13 m/s (p < .001), and performed 1.25 fewer chair stands in 30 s (p < .01). No significant differences were observed for those in the stable high or stable mid categories.
Results of the Multivariable Regression Analysis Examining the Association Between Socioeconomic Mobility and Physical Function.

Note. All models controlled for the following set of covariates: age, race/ethnicity, sex, marital status, and employment status. Significant associations in bold. SET = socioeconomic trend.
p < .05. **p < .01. ***p < .001.
Discussion
Using a community-based sample of individuals assessed for three physical function measures, the relationships of multiple dimensions of SES with physical function across the adult life course were examined. Associations between higher participant education and household income and gait speed, aerobic endurance, and lower body strength were identified. Although parental education had a minimal effect size in the association with gait speed and there were no other associations between measures of early-life SES and physical function, an association between stable low SES, which accounted for both early- (parental education) and current-life SES (participant income), was found with all physical function measures. Furthermore, the age-stratified analysis presented some evidence of SES disparities with increasing age. Participant education had a more significant impact among those transitioning than those in the earning group, while household income was a much more important factor among the retired (e.g., better aerobic endurance). These findings highlight the significance of considering multiple dimensions of the social environment as important correlates of physical function across the life course.
These results show SES disparities in gait speed, aerobic endurance, and lower body strength, which is consistent with previous work documenting SES disparities in physical function and disability (Britton, Shipley, Singh-Manoux, & Marmot, 2008; Haas & Rohlfsen, 2010; Haas, Krueger, & Rohlfsen, 2012; Louie & Ward, 2011; Seeman et al., 1994) as well as work examining SES disparities in physical activity (Donoghue et al., 2018). Haas et al. (2012) found adult SES to be predictive of physical performance among those 65+ years. In addition, Louie and Ward (2011) found associations between lower education and increased household poverty and increased functional limitations, even after adjusting for disease burden. Interestingly, in this study, the association between SES and physical function varied depending on the outcome being assessed.
The life course framework was used to conceptualize the development of physical function. Broadly, physical function is a manifestation of the health status of multiple body systems. Accordingly, measuring physical function across age ranges can yield insights into the functional aging of individuals, specifically predicting disability. While this study used cross-sectional data, the age-stratified and SET analyses allowed for some inference regarding life course processes that may be at work. The findings regarding gait speed, aerobic endurance, and lower body strength support a cumulative disadvantage model. In the age-stratified model, there was evidence of increasing disparities in the association between participant education and household income and all three functional measures. The SET analyses shed further light on these processes by showing that those in the stable low category fair consistently worse than those on an upward trend. These results suggest that more time spent in disadvantaged conditions is increasingly detrimental for functional status. There are several mechanisms through which prolonged disadvantage could impact functional status including prolonged nutritional deficiencies, reduced access to medical care, restraint of occupational choices, and engagement in risky health behaviors (i.e., smoking, low physical activity).
Furthermore, socioeconomic disparities were less prominent in the oldest age group, and there was a significant association of household income with aerobic endurance. These findings highlight the importance of income for the aging population as income is a key predictor of access to health care (Yamada et al., 2015) and participation in physical activities (Weiss, O’Loughlin, Platt, & Paradis, 2007).
Strengths and Limitations
There are several key strengths to this study. First, using objective measures of physical function, rather than self-report, reduces the opportunity for bias in assessment of health status. Second, the use of a cohort with a wide age range, rather than only focusing on a sample of older adults, is critical to understanding the timing of the development of age-related declines in physical function. While many studies are only able to examine current-life SES and its relationship to health, this study incorporated measures of both early and current SES. This provided a more robust view of the association of SES with physical function across the life course.
There were also several limitations to this study. First, as the data were cross-sectional, inferences regarding the timing of the exposure/outcome relationship are limited. While the age-stratified analysis allowed some inferences regarding life course relationships, longitudinal, panel data would provide a more robust assessment of the life course.
The PALS study was performed on a sample of individuals from a single community and the surrounding area, potentially limiting the wide generalizability of the findings. The homogeneity of the population, particularly by race/ethnicity and education, precluded more nuanced analyses of social disadvantage. Furthermore, the PALS study excluded individuals who were unable to walk 30 feet unassisted at baseline. This likely introduces a form of selection bias in which individuals with the poorest physical function are excluded from the study. Thus, we believe our results are likely an underestimate of the true relationship between SES and physical function.
Finally, this study examined only a few dimensions of the social environment that may influence physical function. Future studies would benefit from more comprehensive assessments of the social environment.
Conclusion
The findings of this study yield several important insights regarding functional status across the life course. The findings that the amount of time spent in low SES, as well as the importance of an individuals’ socioeconomic mobility, point to the enduring influence of SES on health across the life course. Moreover, these findings highlight the need to examine socioeconomic factors in ways that capture the life course processes associated with them, rather than only considering how they may affect health at one point in time. Future studies are needed to include both robust measures of the social environment as well as multiple measures of physical function. Moreover, such studies need to begin early in the life course as these processes likely begin well before clinical dysfunction is manifest. Such studies could also shed light on the mediating mechanisms linking social disadvantage to physical function.
Supplemental Material
Supplement_1 – Supplemental material for The Impact of Multiple Dimensions of Socioeconomic Status on Physical Functioning Across the Life Course
Supplemental material, Supplement_1 for The Impact of Multiple Dimensions of Socioeconomic Status on Physical Functioning Across the Life Course by Grace A. Noppert, Candace S. Brown, Marianne Chanti-Ketterl, Katherine S. Hall, L. Kristin Newby, Harvey Jay Cohen and Miriam C. Morey in Gerontology and Geriatric Medicine
Supplemental Material
SuppleTable1 – Supplemental material for The Impact of Multiple Dimensions of Socioeconomic Status on Physical Functioning Across the Life Course
Supplemental material, SuppleTable1 for The Impact of Multiple Dimensions of Socioeconomic Status on Physical Functioning Across the Life Course by Grace A. Noppert, Candace S. Brown, Marianne Chanti-Ketterl, Katherine S. Hall, L. Kristin Newby, Harvey Jay Cohen and Miriam C. Morey in Gerontology and Geriatric Medicine
Supplemental Material
SuppleTable2 – Supplemental material for The Impact of Multiple Dimensions of Socioeconomic Status on Physical Functioning Across the Life Course
Supplemental material, SuppleTable2 for The Impact of Multiple Dimensions of Socioeconomic Status on Physical Functioning Across the Life Course by Grace A. Noppert, Candace S. Brown, Marianne Chanti-Ketterl, Katherine S. Hall, L. Kristin Newby, Harvey Jay Cohen and Miriam C. Morey in Gerontology and Geriatric Medicine
Footnotes
Acknowledgements
The authors are thankful for the participants in the PALS (Physical Performance Across the LifeSpan) study and for the efforts of the MURDOCK (Measurement to Understand the Reclassification of Disease of Cabarrus and Kannapolis) Study research team who participated in the recruitment and data collection.
Ethical Approval
The study was approved by the Institutional Review Boards of Duke University Medical Center and the Carolinas Healthcare System. Regarding the MURDOCK (Measurement to Understand the Reclassification of Disease of Cabarrus and Kannapolis) study the IRB approval number is Pro00011196. Regarding the PALS study, the IRB approval number is Pro00036608 MURDOCK Study Physical Performance Cohort.
Declaration of Conflicting Interests
The author(s) declared no potential conflicts of interest with respect to the research, authorship, and/or publication of this article.
Funding
The author(s) disclosed receipt of the following financial support for the research, authorship, and/or publication of this article: G.A.N., M.C.-K., and C.S.B. were supported by the National Institute on Aging at the National Institutes of Health (grant number 5 T32-AG000029-41). G.A.N. also received salary support from the Eunice Kennedy Shriver National Institute of Child Health and Human Development (grant number T32 HD091058). This work was also supported by the Duke Older Americans Independence Center grant P30-AG028716, the David H. Murdock Foundation for Business and Culture, and an award by Duke University Clinical & Translational Science Institute. K.S.H. is supported by a Career Development Award from the Department of Veterans Affairs Rehabilitation Research and Development Service (2RX001316).
Supplemental Material
Supplemental material for this article is available online.
References
Supplementary Material
Please find the following supplemental material available below.
For Open Access articles published under a Creative Commons License, all supplemental material carries the same license as the article it is associated with.
For non-Open Access articles published, all supplemental material carries a non-exclusive license, and permission requests for re-use of supplemental material or any part of supplemental material shall be sent directly to the copyright owner as specified in the copyright notice associated with the article.