
Abstract
Introduction
To date, a number of physical performance (PP) tests have been developed to objectively and accurately measure physical function of older adults (Jones, Rikli, & Beam, 1999; Peel, Kuys, & Klein, 2013; Podsiadlo & Richardson, 1991; Roberts et al., 2011) and their relationship with various health outcomes, including falls, frailty, disability, and survival (Barry, Galvin, Keogh, Hogan, & Fahey, 2014; Cooper et al., 2011; Greene, Doheny, O’Halloran, & Kenny, 2014; Keevil et al., 2018; Seidel, Brayne, & Jagger, 2011; Taekema, Gussekloo, Maier, Westendorp, & de Craen, 2010). Physical functionality is a multidimensional concept composed of several related domains such as mobility, dexterity, and ability to carry out activities of daily living (basic and instrumental; van Lummel et al., 2015). Better performance in, for example, grip strength (GS)—an indicator of upper body (muscle) strength has been linked to reduced risk of disability, frailty, and mortality in older adults (Keevil et al., 2018; Taekema et al., 2010). Furthermore, mobility tests such as 4-m gait speed (GSp) are important parts of geriatric assessments (Peel et al., 2013) and powerful predictors of poor health, cognitive impairment, and institutionalization (Abellan van Kan et al., 2009; Cesari et al., 2005; Peel et al., 2013). Therefore, objective and standardized PP tests and composite measures of these tests (Guralnik, Butterworth, Wadsworth, & Kuh, 2006) for assessment of functional limitations in older adults may be used to predict distal health outcomes and possibly serve as another vital sign (Bierman, 2001) to identify at-risk population.
Studies have shown that older adults from ethnic minority groups in the United States, particularly Blacks and Hispanics, have lower physical function and experience greater physical decline (Al Snih, Kaushik, Eschbach, & Markides, 2008), functional limitations, and disability compared with Whites (Mendes de Leon, Barnes, Bienias, Skarupski, & Evans, 2005; Warner & Brown, 2011). Disparities in PP measures have been partially explained by a joint effect of gender and ethnicity/race (Warner & Brown, 2011); lower socioeconomic status (SES; Barnes et al., 2011; Haas, Krueger, & Rohlfsen, 2012; Nguyen, Moser, & Chou, 2014) assessed by either educational attainment, or occupation, family income, or wealth; and poorer childhood and adult health (disease burden) in ethnic minority groups (Haas et al., 2012). Other antecedent risk factors more likely to be associated with worse PP in ethnic minority older adults compared with Whites include unhealthy lifestyle (e.g., low physical activity, poor diet, smoking), higher presence of specific diseases (e.g., arthritis, diabetes, stroke, and hypertension; Al Snih et al., 2008; Germain, Vasquez, Batsis, & McQuoid, 2016; Pérez-Zepeda, González-Chavero, Salinas-Martinez, & Gutiérrez-Robledo, 2015; Quiben & Hazuda, 2015), higher body mass index (BMI; Al Snih et al., 2008; Xu, Houston, Gropper, & Zizza, 2009), and depressive symptoms (Everson-Rose et al., 2005; Raji, Ostir, Markides, & Goodwin, 2002). Aside from the studies that used data from the longitudinal national representative surveys in the United States (e.g., the National Health and Nutrition Examination Survey [NHANES] and the Health and Retirement Study [HRS]; Al Snih et al., 2008; Germain et al., 2016; Stanziano, Whitehurst, Graham, & Roos, 2010), few studies have examined factors associated with objective measures of functional status (Gill, 2010) in a multiethnic cohort of community-dwelling older adults from one geographic area. Given a diverse and rapidly aging population in South Florida (Zevallos, Wilcox, Jean, & Acuña, 2016) and observed ethnic/racial differences in health and functioning with aging in the United States (Haas et al., 2012; Mendes de Leon et al., 2005; Warner & Brown, 2011), identifying independent factors associated with poor physical function (Stuck et al., 1999) may aid future research, intervention, and prevention of differences in physical health in older adults of different ethnicities. Therefore, utilizing data from the Florida Atlantic University Healthy Aging Research Initiative (HARI) registry, we aimed to explore differences in objective measures of upper and lower body strength, and mobility in relation to socioeconomic, health, and lifestyle factors in community-dwelling older adults belonging to four ethnic groups and living in one geographic area in South Florida.
Method
Study Population
The HARI study is a cross-sectional study of diversity in healthy aging in community-dwelling older adults living in South Florida as described (Park, Clement, Hooyman, Cavalie, & Ouslander, 2015; Vieira, Tappen, Engstrom, & da Costa, 2015). The study used convenience sampling of ethnically diverse older adults recruited from 2012 to 2014 using advertisements, by word of mouth at health fairs, from senior centers and housing developments, and by referrals from other participants. Men and women aged ≥60 and self-reported to belong to one of four ethnic groups (African American, European American, Hispanic, or Afro-Caribbean) were eligible. Additional inclusion criteria included the ability to walk independently (with or without use of an assistive device) and good cognitive status (age/education adjusted Mini-Mental State Examination [MMSE] score ≥23). Participants were assessed for health and functioning at their home or at a collaborating institution by trained research staff. The analytic sample comprised of 577 (72% female) participants who had complete information on age, gender, ethnicity, and completed at least one PP test described below.
All participants provided written informed consent. The study was approved by the Florida Atlantic University Institutional Review Board.
Data Collection, Questionnaires, and Health Assessments
Study assessments included questionnaires, PP tests, anthropometric measurements (weight, height, waist and hip circumference), and fasting blood samples. Participants were interviewed for measures of SES (education, living arrangements), depression (Center for Epidemiological Studies–Depression [CES-D] scale; Lewinsohn, Seeley, Roberts, & Allen, 1997), quality of life and general health (The Medical Outcome Study Short Form–36, SF-36; Ware & Kosinski, 2001), cognition (MMSE), health status (disease and medication count, weight loss, fatigue, chronic pain, malnutrition assessed by the Mini Nutritional Assessment [MNA]; Vellas et al., 2006), self-reported physical activity, and lifestyle factors (smoking, alcohol use). All instruments and questionnaires were translated into Spanish and Creole and administered by bilingual speakers when needed (English-Haitian Creole or English-Spanish).
PP Tests
Upper body strength was assessed objectively by GS dynamometry (measured in kg, twice in dominant and nondominant hand) and number of arm curls (AC) performed in 30 s (dominant arm). Briefly, the participants were instructed to squeeze the dynamometer (Baseline® Hydraulic Hand Dynamometer, Fabrication Enterprises Inc., White Plains, NY, USA) as hard as possible in standing position, with the arm tested at the side and elbow at 90°. Average value of four GS measurements was used in the analyses. For AC, each participant was timed with a stopwatch for 30 s and the number of AC in dominant arm accomplished in sitting position was recorded. Lower body strength was assessed by the number of chair stands (CS) performed in 30 s as described (Jones et al., 1999). Mobility item included GSp at normal walking pace, and the time taken to walk 4 m in a straight line was recorded with a stopwatch (Peel et al., 2013).
Participant Characteristics Variables and Covariates
Sociodemographic factors included age, sex, living arrangements (living with family member yes/no), place lived the most (city or town/country/other), and years of education (continuous). Health-related characteristics were as follows: self-reported weight loss of ≥10 lb in the last 6 months (yes/no), depressive symptoms (CES-D, <16 score[no depression]/≥16 [at risk of depression]), cognitive impairment (MMSE, 0-23 [impairment]/24-30 [not impaired]), malnutrition (assessed by the MNA, score 0-11 [malnourished and at risk of malnutrition]/12-14 [not at risk of malnutrition]; Vellas et al., 2006), (self-reported) chronic pain for ≥3 months (yes/no), number of medications (max. 10, self-reported; 0-2/3-4/≥5; prescribed for anxiety, depression, hypertension, diabetes, cancer, bladder control, heart control, memory loss, arthritis, and over-the-counter [multivitamins]), fatigue (yes/no), and number of chronic diseases (max. 9) as diagnosed by a doctor (0/1/2/3/≥4; from a list: “Has a doctor ever told you that you have: hypertension, diabetes, cancer or malignant tumor history, chronic lung disease, heart disease, history of stroke, psychiatric history, memory and cognitive problems, and arthritis and rheumatic diseases?”). Lifestyle variables were as follows: physical activity (low/moderate or vigorous activity at least once a week), smoking status (“Have you ever smoked tobacco product?” yes/no), and alcohol intake (never/2-4 times a month or less/2 or more times a week). Anthropometry included BMI (kg weight/m2 height, continuous), height (cm, continuous), and waist-hip ratio (continuous). Physical and emotional quality of life was assessed by the SF-36 Physical Component Summary (PCS) and Mental Component Summary (MCS) subscales (continuous), respectively (Ware & Kosinski, 2001).
Statistical Analysis
Descriptive Statistics
Participant characteristics (sociodemographic, health-related, lifestyle, and anthropometry) were explored using descriptive statistics, mean (M) and standard deviation (SD) for continuous variables, and frequencies and percentages for categorical variables. Differences between ethnic groups were explored using ANOVA, Kruskal–Wallis test, and Fisher’s Exact or ordinal logistic regression as appropriate (Table 1). Differences in upper and lower body strength test and mobility (untransformed) across ethnicities were tested using ANOVA (Table 2).
Characteristics of Participants in HARI Study Across Ethnic Groups.

Note. HARI = Healthy Aging Research Initiative; CES-D = Center for Epidemiological Studies–Depression scale; MMSE = Mini-Mental State Examination; MNA = Mini Nutritional Assessment; PCS = Physical Component Summary; IQR = interquartile range; MCS = Mental Component Summary; BMI = body mass index.
Fisher Exact Test for categorical variables (age categories, living arrangements, place lived the most, physical activity score, smoking status, weight loss, CES-D, MMSE, malnutrition, chronic pain, fatigue), ordinal logistic regression (alcohol intake, number of medications, number of diseases), ANOVA (age, years of education, BMI, height, waist-hip ratio), and Kruskal–Wallis (PCS, MCS).
Physical Performance Measures (Untransformed) Across Ethnic Groups.

ANOVA.
Multivariate Statistics: Factors Associated With Each PP Test by Ethnicity
The distribution of PP measures was examined within each ethnic group and power transformations were employed to convert data to a normal distribution where necessary. Specifically, GS was transformed using √x for African Americans and Hispanics, AC was transformed with √x for Hispanics only, CS was transformed with √x for African Americans and Hispanics, and GSp was transformed with 1/√x for all, (x representing original PP score). The pattern of “missingness” for each measure of PP by ethnic groups was explored and described in detail in the section “Sensitivity and supplementary analyses.” For each measure of PP, we used multivariable linear regression models stratified by ethnicity to identify sociodemographic, health-related, lifestyle, and anthropometric factors associated with PP. Covariates were selected based on prior literature and the results from univariate analyses (Table 1). The conceptual framework of the study is presented in Figure 1. First, we tested the following models: Model 1 (sociodemographic covariates: sex [female], age [≥75 years], years of education [continuous]), Model 2 (additionally adjusted for anthropometry: BMI, waist-hip ratio, and height [continuous]), Model 3 (additionally adjusted for health-related factors: PCS and MCS of SF-36 quality of life survey, number of medications, number of chronic diseases [continuous], CES-D [at risk], MMSE [impaired], weight loss [yes]), and Model 4 (additionally adjusted for lifestyle: physical activity [medium-high at least once a week] and ever smoking tobacco product [yes]; details not shown). Second, to determine the best model fit, we used backward elimination of the fully adjusted model (Model 4) and assessed the model performance by examining the adjusted R2, testing for heteroscedasticity, inspecting the normality of residuals, and checking for multicollinearity among covariates. The best fit multivariable regression models for each PP measure across four ethnic groups included covariates that explained the most variance in the dependent variable (PP) based on the highest adjusted R2 (Table 3).
Best Fit Multivariable Regression Models a for Four PP Measures Across Ethnic Groups.

Note. Grip strength was √x transformed (x being original value) in African Americans and Hispanics; arm curls was √x transformed in Hispanics; chair stands was √x transformed in African Americans and Hispanics; and gait speed was 1/√x transformed in all groups. PP = physical performance; BMI = body mass index; MMSE = Mini-Mental State Examination; CES-D = Center for Epidemiological Studies–Depression scale; PCS = Physical Component Summary; MCS = Mental Component Summary; AC = Arm curls; PA = physical activity; CS = Chair stands; GSp = gait speed.
Only significant associations B (SE) for the best model fit at α < .05 are reported. Positive associations are indicated as →, negative as ↓, and lack of association as —. Empty cells indicate that the covariates were not included in the models.
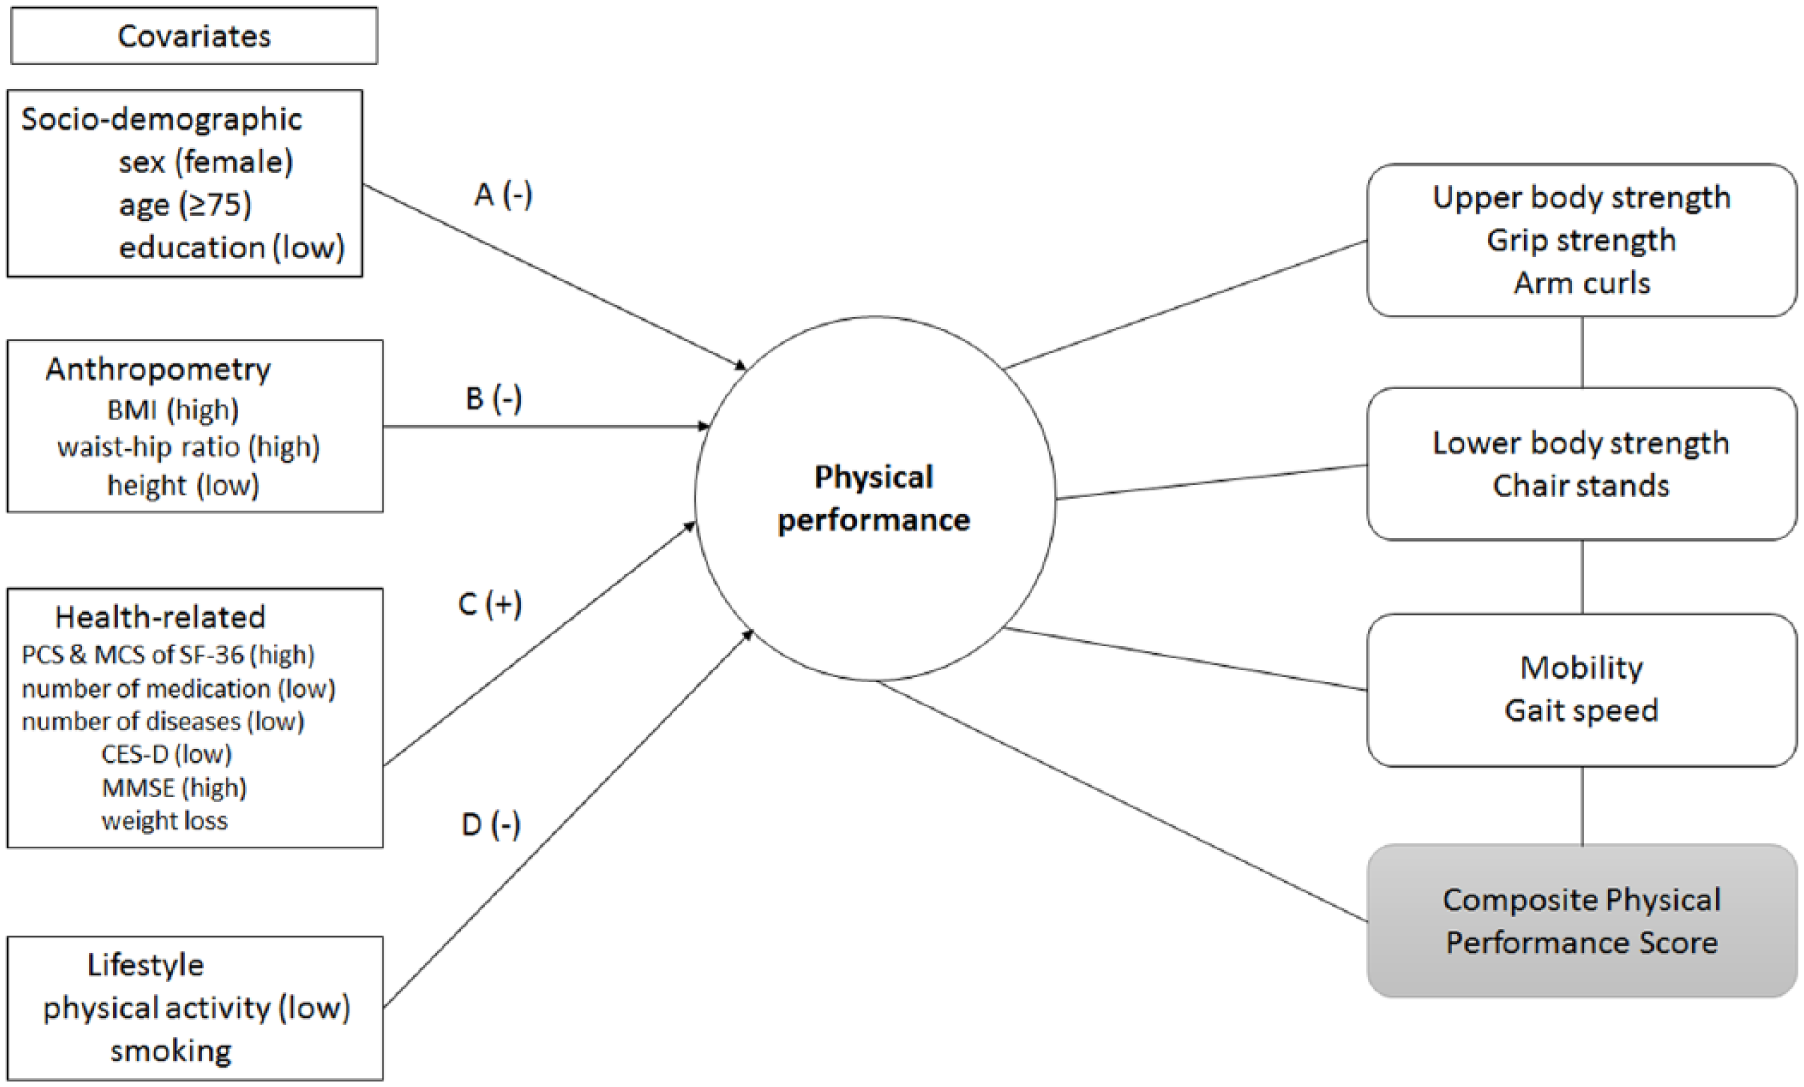
Conceptual framework to examine factors associated with PP measures in the HARI study.
All p values were two-sided and p < .05 was used to indicate statistical significance. All analyses were performed in Stata, Release 14 (StataCorp, College Station, TX, 2015).
Sensitivity and Supplementary Analyses
Analysis of missing values for each PP test by ethnicity
In the analytic sample (n = 577), there were 234 missing values in PP tests (50 in African Americans, 58 in Afro-Caribbeans, 55 in Hispanics, and 71 in European Americans) of which CS were missing the most, but GS and GSp had only a few missing values (Figure 2). To test the Missing Completely at Random (MCAR) and Missing at Random (MAR) assumption, and to determine the factors associated with the presence of “missingness,” we created an indicator variable (1 [missing observation]/0 [not missing observation]) and fitted univariate logistic regression models with each covariate (independent variable) described above (appendix, Table A1).

Flow chart of participant recruitment and physical performance assessments in the HARI study.
Multivariate Analysis With Composite Physical Performance Score (CPPS) in All Participants
We generated a single PP variable, a CPPS as a measure of overall (physical) functioning status (Guralnik et al., 2006) and explored the associations between this variable and selected covariates. CPPS was created by rescaling and combining GS, GSp, AC, and CS test values. Briefly, we rescaled each PP test original value using the approach described by Mohamad and Usman (2013). To reduce the effect of extreme values on the final composite score, we used 99th percentile of each PP score instead of maximum (i.e., all values >99th percentile were set to 99th percentile). GS values were divided by height and then rescaled for each gender. The rescaled GSp was subtracted from 1 before including it into the CPPS calculation. For each rescaled PP test, a value of 0 was assigned to all participants who did not complete the test. Finally, we created the CPPS by summing up four rescaled PP test values. Low CPPS scores indicated poor performance and higher scores represented better performance (range = 0-3.96; median = 2.11 in all participants).
To compare the findings obtained with the individual PP measures, we repeated multivariate regression models with backward elimination (described above with addition of “place lived the most” variable) to determine the best model fit and factors associated with CPPS in participants with all available data (i.e., all available participants’ information; full information maximum likelihood [FIML] model) and in complete cases (participants without missing data; appendix, Table A2). The results from these models were also compared.
Results
Characteristics of Participants Across Ethnic Groups
Of the 577 older adults in the HARI study who had multidimensional health and PP assessments, 104 (18%) were African American, 142 (25%) Afro-Caribbean, 123 (21%) Hispanics, and 208 (36%) were European American (Figure 2). The average age of the population was 74 years (SD = 8), and 72% were women (Table 1). European Americans were older (p < .001), had a higher proportion of men (p < .001), were more educated (p < .001), physically active (p = .01), and were healthier compared with others (e.g., had lower BMI, less chronic pain, and less cognitive impairment [all p < .001]). Hispanics were more likely to be at risk of depression and had the lowest MCS score of the SF-36 (both p < .001) compared with others. However, disease and medication count did not differ significantly by ethnicity.
PP Measures Across Ethnic Groups
GS did not differ significantly between ethnicities (Table 2). European Americans had the highest AC in 30 s, CS in 30 s, and better performance in 4 m-GSp compared with others.
Factors Associated With PP Measures Across Ethnic Groups
Upper body strength (GS and AC)
In multivariable regression models (the best model fit), being female was associated with lower GS and fewer AC in 30 s across all ethnic groups except in Afro-Caribbeans and older age (≥75 years) was associated with fewer AC in all except African Americans (Table 3). Education was significantly associated with GS and AC only in Afro-Caribbeans. Of modifiable health-related factors, weight loss of ≥10 lb in the last 6 months was associated with lower GS in African Americans (a −0.60 √kg lower GS if reported weight loss) and fewer AC in Afro-Carribeans (a −2.79 fewer AC if reported weight loss). Conversely, higher BMI was positively associated with GS in Hispanics (a 0.05 √kg per unit increase in BMI) and European Americans (a 0.22 kg per unit increase in BMI). Better mental health (i.e., higher MCS scores of the SF-36) was positively associated with GS in Afro-Caribbeans (a 0.16 kg per unit increase in MCS) and with better AC performance (a 0.13 more AC per unit increase in MCS) in African Americans. Being at risk of depression was negatively associated with AC in Hispanics, while both moderate/vigorous physical activity and PCS were positively associated with AC in this but not in other ethnic groups. The model explained 53% variation in GS data in European Americans and Hispanics, and 43% variation in AC in Hispanic older adults.
Lower body strength (CS)
Of modifiable health-related factors, higher BMI was associated with poorer performance in CS within 30 s only in African Americans and European Americans (a −0.01 √-transformed CS counts per unit increase in BMI, and −0.27 fewer CS per unit increase in BMI, respectively). Higher PCS scores were positively associated with CS in African Americans (a 0.02 √-transformed CS counts per unit increase in PCS) but not in other ethnic groups. Depression was significantly associated with worse CS in African Americans, and higher MCS was positively associated with CS in Hispanics but not in other ethnicities. The adjusted R2 was the highest in the African Americans model and explained 52% variance in CS data.
Mobility (GSp)
Older age (≥75 years) was significantly associated with longer time to walk 4 m in all ethnic groups except in Hispanic older adults. Higher BMI was negatively associated with GSp in all ethnic groups except in Hispanics. In this ethnic group, female gender and higher number of diseases were associated with slower GSp. Education was positively associated with GSp in European Americans and Afro-Caribbeans but not in others. Physical activity measures (PCS and self-reported moderate/vigorous physical activity at least once a week) were positively associated with mobility in African Americans and Afro-Caribbeans, respectively, but not in other ethnicities. The model explained 23% to 27% variance in data across ethnic groups.
Results for Sensitivity and Supplementary Analyses
Pattern of “missingness” for each PP test by ethnicity
Significant parameter estimates (SE) of the univariate logistic regression models with indicator variable (missing observation [1]/or not [0]) and covariates (described above) by ethnic group are summarized in Table A1 (appendix). Of four PP measures, only GS was MCAR in all except in Afro-Carribean older adults. Those who were older, taking more medication, and were cognitively impaired were less likely to perform GS. For CS (PP with the highest percentage of missing data, Figure 2), older age, higher BMI, lower PCS score, cognitive impairment, chronic pain, and higher number of medications were factors significantly associated with “missingness” in at least two ethnic groups. Therefore, the MCAR and MAR assumptions were questionable, especially in CS multivariate regression models.
Factors associated with CPPS in all participants
Table A2 (appendix) summarizes the results from the best model fit (multivariate regression with backwards elimination) for CPPS in all participants (FIML model, n = 577) and in complete cases (no missing data for PP and covariates, n = 462). The results from the two models were comparable. Specifically, higher PCS score, moderate-vigorous physical activity, and more years of education were positively associated with CPPS, while older age, being female, living in town, and being at risk of depression were negatively associated with CPPS. However, ethnicity and BMI were not associated with the composite score.
Discussion
In this cross-sectional study of a convenience sample of older adults belonging to four ethic groups (African American, Afro-Caribbean, Hispanic, and European American) residing in South Florida, we investigated factors associated with measures of upper (GS, AC), lower (CS) body strength, and mobility (4 m-GSp) using multivariable regression models. PP measures varied across ethnic groups, with European Americans having, on average, enhanced performance in all measures except in GS. Factors associated with PP also varied across ethnicities, explaining different percentage of variance in data. For example, significant factors associated with upper body strength in ethnic minorities were weight loss (African Americans, Afro-Caribbeans), emotional well-being (African Americans, Afro-Caribbeans), years of education (Afro-Caribbeans), physical activity, and PCS (Hispanics). Higher BMI was negatively associated with mobility in all ethnic groups except in Hispanics, while better mental health (MCS) and higher physical activity were positively associated with GSp in Hispanics. The most variance in data (~50%) was explained in GS models (Hispanics, European Americans), indicating that the effect of unmeasured predictors also varied across ethnicities. However, because of relatively small sample size in ethnic minority groups, these results have to be interpreted with caution and verified in other multiethnic cohorts.
Florida’s population is rapidly aging; 17.3% (3.26 million) were aged 65+ in 2010, and the number is projected to reach 7.77 million, a 27% of total population in 2030, with the numbers of non-Hispanic Whites decreasing and ethnic minorities, Hispanics and African Americans, increasing in both absolute terms and as a percentage of state population (Reynolds, Gunderson, & Bamford, 2015). This ethnic diversity is specifically prominent in Florida’s southern counties (Zevallos et al., 2016). Understanding health and functioning profiles and indicators thereof in Florida’s diverse population of older adults is essential to meet their health needs and deliver adequate social services. The HARI registry provides a unique opportunity to investigate differences in PP and associated risk factors in three ethnic minorities, African Americans, Hispanics, and Afro-Caribbeans—the latter being rarely included in aging research in greater numbers.
Factors associated with diversity in physical health in adults belonging to different ethnic/racial groups are understudied. One comprehensive systematic literature review of 78 longitudinal studies that examined risk factors of functional status decline (a combined concept of physical function limitation and disability) in older adults of different ethnic/racial backgrounds (Stuck et al., 1999) has found the strongest evidence for increased and decreased BMI, low physical activity, depression, cognitive impairment, disease burden, smoking, no alcohol use, and low number of social contacts. We confirmed that higher BMI, a modifiable health-related factor, was positively associated with stronger GS (Hispanics and European Americans) but negatively associated with CS (African Americans and European Americans) and GSp (in all ethnic/racial groups except in Hispanics). Higher BMI is strongly related to health behaviors (diet and physical activity), which have been shown to differ by ethnicity in middle age and old adulthood, with English-proficient minorities adopting less healthy behaviors compared with Whites (August & Sorkin, 2011). Better functional health (higher PCS score of SF-36) was significantly associated with upper body strength (Hispanics), walking speed (African Americans), and with the composite PP score in all participants, highlighting the importance of promoting physical activity and healthy diet for functional health and prevention of disability among ethnic minorities.
Physical activity interventions (e.g., home- or group-based) in older adults can result in increased physical activity although the change in behavior is usually short-lived (van der Bij, Laurant, & Wensing, 2002). The adherence and acceptability of the interventions may be increased by incorporating the views of older adults about physical activity into the programs (Farrance, Tsofliou, & Clark, 2016), by concentrating on short-term rather than long-term health goals (Devereux-Fitzgerald, Powell, Dewhurst, & French, 2016), and promoting physical activity across the life course (Breda et al., 2018).
Epidemiological studies investigating the antecedents of physical health disparities between the ethnic/racial groups have shown that disparities persist into old age, especially in African Americans (August & Sorkin, 2010), and can only partially be explained by birth factors, childhood (parental) and adult SES, and education (Barnes et al., 2011; Haas et al., 2012). For example, compared with U.S.-born Whites, U.S.- and foreign-born Blacks and Hispanics had slower walking speed, and Hispanics had worse GS compared with Whites after adjusting for demographics (age, sex), childhood health, and adult SES status (Haas et al., 2012). Among Black and White older adults (aged ≥65 years) from the Chicago Health and Aging Project, each additional year of education was associated with better PP scores (lower body strength, balance, and gait), while the positive effect of education beyond 12 years was more pronounced in Blacks compared with Whites and attenuated racial difference in physical functioning (Barnes et al., 2011). In the current study, education (used as a proxy for SES) was positively associated with AC and GSp (but negatively associated with GS) in Afro-Caribbeans but was not associated with PP measures in other ethnic minorities—despite substantial difference in years of education compared with European Americans (i.e., on average, 2.7-4.4 less years of education in minority older adults). Education was also positively associated with the composite PP score. Education covers only one aspect of SES, but in relation to health and health-related behaviors (e.g., diet and physical exercise) offers additional benefits beyond economic resources and is regarded as “essential element” and a “contributing cause of health” by providing, for example, knowledge about health risks and protective behaviors (Hahn, & Trumab, 2015). However, based on the “age-as-leveler” hypothesis, the protective effect of education in relation to PP may diminish with advancing age (Herd, 2006), a trend also observed among U.S. Chinese older adults with higher education, who experience faster PP decline (chair and tandem stand, and GSp) over 2 years (Dong, Bergren, & Simon, 2017).
We also observed differences in associations between emotional well-being (higher MCS) and depression and PP across ethnic groups. Higher MCS and being at risk of depression was associated with PP measures in African Americans, Hispanics, and in all participants (for the composite PP score). Evidence suggests that these minority groups and, in particular Hispanics/Latino, report worse mental health compared with Whites (Pickett, Bazelais, & Bruce, 2013; Sorkin, Pham, & Ngo-Metzger, 2009) and are more likely to show a culturally driven response bias to depressive symptom items on standardized depression instruments (Kim, Chiriboga, & Jang, 2009). Finally, based on the best fit statistics (adjusted R2), we observed differences in unmeasured predictors of PP across ethnic groups, warranting further research into risk factors associated with poor physical functioning in an ethnically diverse population of older adults.
Study Strengths and Limitations
The strength of the study is inclusion of ethnically diverse older adults, including Afro-Carribeans. However, the results need further verification in other multiethnic cohorts for the following reasons. The study is cross-sectional, and comprised of noninstitutionalized older adults from one geographic area (South Florida), limiting the generalizability of the results to older adults living in other regions of the United States. Convenience sampling may have resulted in a biased sample of more healthy volunteers and more females (72% of the sample) with easier access to a collaborating institution—potentially, individuals with more serious illnesses and limited resources (e.g., transportation) would be self-excluded. The ethnic groups were not equally distributed: European Americans comprised 36% of the sample compared with, for example, 18% of African Americans and 21.3% of Hispanics. Except for GS, the MCAR and MAR assumption was questionable, which may have affected significant associations resulting in Type I error. Based on the power calculation proposed by Cohen, Cohen, West, and Aiken (2003), the study was underpowered increasing the risk of Type 1 error, especially in African Americans and Hispanics and for covariates with a low number of participants (e.g., CES-D and number of medications in African Americans for CS). Therefore, the results have to be interpreted with caution. Similarly, some significant associations by ethnic groups may have been missed (Type II error) because of low power in data. Also, the study was not powered to examine specific subgroups within ethnic minorities (e.g., U.S.- vs. foreign-born), hence each ethnicity was regarded as a homogeneous group and the effect of cultural beliefs, nativity, immigration status, and acculturation (Monserud, 2017) on PP was not explored. Adjusted R2 in several models across the ethnic groups was less than 20%, suggesting that residual confounding and factors not available for inclusion in the models (e.g., social gradient, childhood health, diet; Nguyen et al., 2014; Stuck et al., 1999) may have explained additional variance. Significant associations between measures of mental health and PP in African Americans and Hispanics may indicate a reverse causality—poorer long-standing physical function driving lower emotional well-being in these minority groups who usually report worse mental health compared with non-Hispanic Whites (Pickett et al., 2013; Sorkin et al., 2009). Finally, we used self-reported data for covariates, which may introduce validity issues due to memory problems and fatigue.
Conclusion
Regardless of these limitations, this study adds to the existing literature exploring ethnic/racial differences and associated risk factors for physical functioning in later life, which need to be explored further and confirmed in large multiethnic cohorts. Specifically, modifiable factors such as physical activity were positively associated with upper body strength and mobility in ethnic minority older adults, while higher BMI and weight loss were negatively associated with lower body strength and mobility. This suggests that implementation of a healthy lifestyle (e.g., physical activity and diet) may enhance physical function in these groups and possibly contribute to reducing health disparities. The role of mental health (including depressive symptoms) in PP has to be explored further to better understand likely factors driving ethnic/racial differences in physical health, which will help in designing interventions and recognizing unmet needs for health and social services in a diverse population of older adults in the United States.
Footnotes
Appendix
Best Fit Multivariable Regression Models for CPPS in Complete Cases and All Participants (FIML).

| Parameters | Complete cases |
All participants (FIML) |
||
|---|---|---|---|---|
| B (SE) a | p | B (SE) a | p | |
| BMI | — | — | −0.008 (0.004)↓ | .04 |
| PCS | 0.01 (0.003)→ | <.001 | 0.02 (0.003)→ | <.001 |
| Years of education | 0.01 (0.005)→ | .03 | 0.01 (0.005)→ | .009 |
| Age (≥75 years) | −0.23 (0.05)↓ | <.001 | −0.24 (0.05)↓ | <.001 |
| Sex (women) | −0.19 (0.05)↓ | <.001 | −0.15 (0.05)↓ | .002 |
| Number of diseases | −0.04 (0.02)↓ | .03 | — | — |
| CES-D (at risk) | −0.23 (0.06)↓ | <.001 | −0.19 (0.06)↓ | .002 |
| Place lived the most (town) | −0.34 (0.09)↓ | <.001 | −0.27 (0.09)↓ | .002 |
| Moderate-vigorous PA | 0.16 (0.06)→ | .004 | 0.2 (0.06)→ | <.001 |
| European American | — | — | — | — |
| Hispanic | — | — | — | — |
| Afro-Caribbean | — | — | — | — |
| Adjusted R2 | .31 | |||
| n | 462 | 577 | ||
Note. CPPS = Composite Physical Performance Score; FIML = full information maximum likelihood; BMI = body mass index; PCS = Physical Component Summary; CES-D = Center for Epidemiological Studies–Depression scale; PA = physical activity.
Only significant associations B (SE) at α < .05 for the best model fit are reported. Positive associations are indicated as →, negative as ↓, and lack of association as —.
Acknowledgements
We would like to acknowledge Mrs. Germaine Uwimpuhwe for supplementary statistical analyses.
Declaration of Conflicting Interests
The author(s) declared no potential conflicts of interest with respect to the research, authorship, and/or publication of this article.
Funding
The author(s) disclosed receipt of the following financial support for the research, authorship, and/or publication of this article: The HARI study (JGO, RT) was supported in part by the Retirement Research Foundation (RRF Grant No. 2012-283) and internal funding from Florida Atlantic University. This work was supported by the National Institute for Health Research Newcastle Biomedical Research Center based at Newcastle Hospitals NHS Foundation Trust and Newcastle University (AG, HM, KD, RD).