
Abstract
Introduction
Frailty is a ubiquitous term in gerontology and geriatrics. It is a preclinical state that is characterized as a dynamic, age-related loss of physiologic reserves in multiple systems that leads to vulnerability to stressors and increased risk for multiple adverse health outcomes, including falls, disability, hospitalization, and death (Azzopardi et al., 2016; Fried et al., 2001). Although this definition of frailty is widely accepted, a consensus model and its measurable components have yet to be agreed upon. The lack of a uniform model has led to a proliferation of frailty measurement instruments. As an example, a recent review by Vella Azzopardi and colleagues identified 79 original or adapted frailty instruments in the literature (Azzopardi et al., 2016).
Physical frailty, first operationalized by Gill et al. (2002), is a model of frailty that is typically characterized by poor physical performance, for example, inability to rise once from a chair and/or very slow gait. A major advantage of the physical frailty model is that it can be quickly and easily measured in most clinical settings with minimal training, equipment, or space required. We view this as a necessity to advancing the objective integration of frailty into usual clinical care. This is a view widely shared by experts on this topic (Morley et al., 2013).
If we conceptualize physical frailty as an independent pathway and risk factor for poor outcomes, then it becomes important to detect its early onset to intervene with frailty prevention strategies (Bandeen-Roche & Espinoza, 2017). Identifying early deficits in physiologic reserves via simple physical performance measures, which we have termed performance-based early frailty (PBEF), may be informative in designing prevention programs. Furthermore, identifying PBEF and describing its antecedent and concurrent risk factors in both mid and older adulthood is crucial in the development of life span–focused preventive interventions and public health practices. We had two hypotheses with this study:
Method
Data Source and Participants
A sample from the Fels Longitudinal Study was used for analysis. Information regarding the Fels Longitudinal Study has been previously published in detail (Roche, 1992). Briefly, the study began in Yellow Springs, Ohio for the purpose of examining growth, maturation, and body composition of individuals residing in and around the Southwest Ohio area. In many cases, participants were enrolled as infants or small children, and then followed throughout their life spans. Although the study is now closed to additional recruitment, data collection in a substantial portion of existing participants (N~1,200) is ongoing. Participants follow specific visit schedules depending on age and gender; for participants ≥18 years of age, visits occur every 2 to 5 years. Fels Longitudinal participants are overwhelmingly of European descent and typically live in Southwest Ohio, roughly mirroring that region’s distribution of socioeconomic status. Participants are not targeted for study enrollment because of any particular health conditions, diseases or body composition, and as such, the study can be considered to approximate normal population variation within the represented demographic.
The present analysis included newly collected and retrospective data from N = 104 participants. The newly collected data included n = 35 midlife participants aged 40 to 60 years and n = 69 older participants aged 60 and above. All participants also had a previous visit in young adulthood (for the midlife group) and midlife (for the older group). The sample size for this analysis was limited due to only recent initiation (2014-present) of routine collection of the Short Physical Performance Battery (Guralnik et al., 1994), which is necessary for quantifying PBEF, as part of a study visit.
PBEF Measures and Definition
PBEF was derived from chair rise and gait speed measures as part of the Short Physical Performance Battery, and defined primarily using previously published, age-specific cut points and secondarily using the distribution of chair stand and gait speed times in our sample. Based on these sources, we identified cut points for (a) time to complete five chair stands at 10 s for midlife, and 13 s for older adults (Bohannon, 2006), and (b) usual gait velocity while walking 4 meters of <1.0 m/s for midlife, and <0.80 m/s for older adults (Bohannon, 1997; Studenski et al., 2011). Deficiency in one measure was defined as “pre PBEF” and deficiency in both measures was defined as PBEF.
PBEF Risk Factors
Risk factors were chosen based on availability of information collected as part of the larger, ongoing, Fels Longitudinal Study, which is primarily focused on adiposity and chronic disease risk factors. Of the available information, risk factors were chosen based on their known associations with physical frailty (Peterson et al., 2009) and being key constructs of the frailty phenotype (Fried et al., 2001). Data collected at a previous and new visit, and included in this analysis, are described below.
Anthropometrics/body composition
Measures included fat and lean mass from dual-energy x-ray absorptiometry; thigh and abdominal skinfolds; and thigh, hip, and abdominal circumferences.
Self-reported physical activity
Physical activity was measured using the modified Baecke questionnaire. The Baecke questionnaire estimates habitual physical activity for the previous year by calculating a total activity score from work, sports, and nonsport leisure time activity indices with ranges of 1 (lowest active) to 5 (highest active; Baecke, Burema, & Frijters, 1982).
Grip strength
Grip strength was measured using a Jamar hydraulic hand dynamometer (Model 5030JL, JLW Instruments, Chicago, IL) with participants seated, elbow flexed to 90°, and the dynamometer resting comfortably on the participants’ thigh. Three maximal effort measures were obtained for each hand, with no more than 10% variation between attempts.
Serum/plasma markers
Circulating markers included low-density lipoprotein (LDL) and high-density lipoprotein (HDL) cholesterols, triglycerides, and C-reactive protein (CRP). Whole blood was obtained via venipuncture in a fasting state and collected in anticoagulant-treated tubes. Plasma was then immediately separated via centrifuge, transferred to polypropylene tubes via pipette, appropriately labeled, and frozen at –80 °C. Assays were conducted by a commercial laboratory (LabCorp, Burlington, NC).
Alcohol and tobacco use
Alcohol use was quantified as number of drinks per day, and current and former tobacco use was ascertained and then quantified as pack/years of smoking.
Sleep quality
Sleep quality was measured using the Pittsburgh Sleep Quality Index, which ascertains sleep habits in the previous month. The index has a range from 0 to 21, with a higher score indicating poorer sleep quality (Buysse, Reynolds, Monk, Berman, & Kupfer, 1989).
Quality of life
Health-related quality of life was measured using the Short Form–36 (SF-36) of the Medical Outcomes Survey (Ware, 2000; Ware & Sherbourne, 1992). Particularly, the SF-36 subscales for mental functioning, physical functioning, and social role functioning were of interest in this analysis. SF-36 subscales are standardized with a range of 0 to 100, a mean of 50, and standard deviation of 10. The SF-36 and its subscales have been well validated in many older adult nonclinical and clinical populations (McHorney, Ware, Rogers, Raczek, & Lu, 1992).
Medical conditions
Medical conditions were self-reported by responding to, “have you ever been diagnosed with” a series of cardiovascular conditions (angina, arteriosclerosis, atherosclerosis, congestive heart failure, myocardial infarction, high blood pressure, ischemia, peripheral artery disease, stroke, transient ischemic attack, and valvular heart disease), pulmonary diseases (chronic obstructive pulmonary disease and asthma), cancer, and diabetes.
All study procedures were approved by the institutional review board at Wright State University and all participants provided informed consent prior to participation.
Statistical Analysis
Characteristics of study participants were calculated using appropriate univariate continuous or frequency statistics. Chi-square tests or one-way ANOVA were tested for associations between previous and current visit variables and PBEF status (none, pre-PBEF, PBEF). Separate proportional odds logistic regression models were used to predict midlife and older PBEF status, respectively, as a function of antecedent and current health and physical measures. Age and gender were planned a priori to be forced into the models, and proportional odds assumptions were met in both models. All analyses were conducted using SAS version 9.4 (SAS Institute Inc., Cary, NC).
Results
The mean age in the midlife and older groups was approximately 50 and 69 years old, respectively. The majority of both groups were female, overweight according to body mass index (BMI) status, with mean grip strengths (38.8 in midlife vs. 36.6 in older group) that were slightly above average in both groups compared with published norms. Physical activity scores were representative of the entire Fels Longitudinal Study middle-aged and older participants (Massy-Westropp, Gill, Taylor, Bohannon, & Hill, 2011). The mean number of comorbidities in both groups was low (0.4 comorbidities in midlife vs. 1.2 comorbidities in older group), indicating on average a population with low medical burden. On average, their earlier visit used to determine antecedent PBEF predictors was 19 years earlier for the midlife group and 17 years for the older group (Table 1). The racial distribution in the Fels Longitudinal Study is almost exclusively non-Hispanic White, compromising approximately 98% of the study participants.
Participant Characteristics.
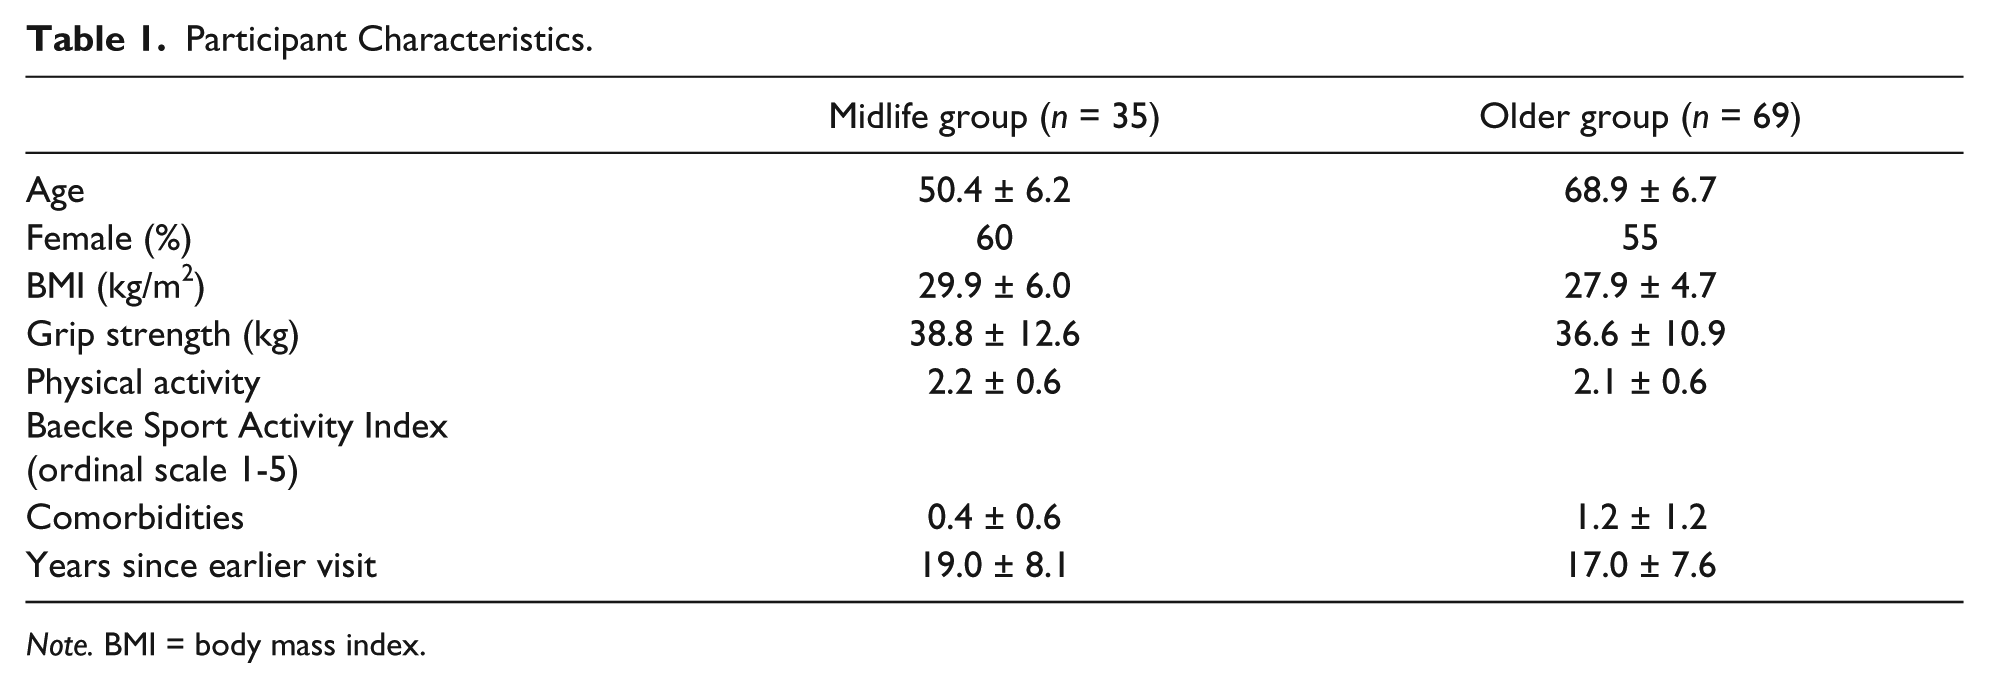
Note. BMI = body mass index.
Pre-PBEF was identified in 26% and 30% of midlife and older adults, respectively, whereas PBEF was identified in 11% and 14% of midlife and older adults. Bivariate associations between select demographic/current health characteristics and PBEF status (presence of either pre-PBEF or PBEF) are shown in Table 2. In the midlife group, the only factor associated with PBEF was lower levels of physical activity. In the older group, PBEF was associated with female gender, higher BMI, higher fat mass, lower grip strength, poorer sleep quality, poorer self-reported physical functioning and mental functioning (p = .06), and higher CRP concentrations. In bivariate models, fat-free mass, drinking and smoking status, SF-36 social role functioning, and the number of reported medical conditions were not associated with presence of PBEF in either group.
p Values for Cross-Sectional Associations Between Risk Factors and Presence of PBEF.

Note. PBEF = performance-based early frailty; BMI = body mass index; DXA = dual-energy x-ray absorptiometry; SF-36 = Short Form–36; CRP = C-reactive protein; Bolded p-values significant at < 0.05 level; ↑ = increased; ↓ = decreased.
In multivariate models predicting PBEF (Table 3), the only variable that was significantly associated with PBEF in midlife was current participation in leisure time sport activities (i.e., tennis and golf) with higher rates of activity conferring an over 80% lower odds, odds ratio (OR) = 0.18, 95% confidence interval (95% CI) = [0.04, 0.73], of PBEF. No earlier adulthood characteristics predicted PBEF status in midlife.
Risk Factors for Midlife and Older Age PBEF.

Note. PBEF = performance-based early frailty; OR = odds ratio; CI = confidence interval; CRP = C-reactive protein.
Adjusted for age and gender (forced into the model).
Adjusted for age, gender (forced into the model), and other significant factors in the older age group model.
In older adults, PBEF status was predicted by midlife heavier drinking (OR = 3.09; 95% CI = [1.39, 6.87]) and a protective association with grip strength was observed (OR = 0.92; 95% CI = [0.85, 1.00]). In addition, current poorer sleep habits (OR = 1.20; 95% CI = [1.03, 1.38]) and current higher CRP concentrations (OR = 1.19; 95% CI = [1.03, 1.39]) were associated with the presence of PBEF.
Discussion
We hypothesized that patterns of antecedent and current risk factors would be consistent in both midlife and older age PBEF. However, differing patterns of risk factors emerged for each age group. In midlife, only current physical activity levels were associated with PBEF, with an almost 80% lower likelihood of having PBEF with higher reported levels of physical activity. The association of physical activity with PBEF is not a surprising finding, as a large body of evidence ties physical activity behavior to both the prevention and treatment of frailty and its adverse health trajectories (Gill et al., 2002; Peterson et al., 2009; Sacha, Sacha, Sobon, Borysiuk, & Feusette, 2017). Finding no earlier adulthood risk factors for midlife PBEF was unexpected, and could be due to latent risk factors that we were not able to include in our prediction model. Extending this thought, recent findings from the Dunedin Study birth cohort demonstrate that early life intelligence predicts midlife “biological age,” which represents the biological underpinnings, or one hypothesized mechanism, by which physiological dysregulation depletes reserves (Belsky et al., 2015; Schaefer et al., 2016). Studies are currently underway using the Fels Longitudinal Study cohort to elucidate the association between numerous childhood intelligence, growth, and nutritional variables and midlife PBEF.
In the older group, midlife heavier daily drinking emerged as a risk factor, along with the protective role of grip strength. Unlike midlife PBEF, current physical activity levels were not associated with older age PBEF, nor did midlife physical activity levels predict PBEF. The protective role of midlife strength, as measured by grip strength, on later-life disability and mortality is well established (Rantanen, 2003; Rantanen et al., 1999; Rantanen et al., 1998), and this finding adds to this growing body of evidence. Standardized testing of handgrip strength on a regular basis in the clinical setting has been recommended by expert panels (Roberts et al., 2011). Currently reported poor sleep and higher levels of CRP, an inflammatory biomarker, added to the risk factors. The constellation of an unhealthy midlife behavior (drinking) in conjunction with current patterns of poor sleep and inflammation presents a risk factor profile that may be important to screen and intervene upon in older adults to address PBEF and frailty-related poor outcomes.
The relationship between sleep disorders and frailty is still not clear in the literature, and expert consensus statements have called for well-designed studies to supplant this knowledge gap in the frailty literature (Cochen et al., 2009). To this end, a very recent study using data from the Doetinchem Cohort Study found that short and long sleep duration was associated with physical frailty (van Oostrom et al., 2017). Given the mechanistic link between sleep-related issues and inflammation (Hurtado-Alvarado, Dominguez-Salazar, Pavon, Velazquez-Moctezuma, & Gomez-Gonzalez, 2016; Straub, 2017), and the findings from the current study, interventions aimed at improving sleep and reducing inflammation may provide synergistic effects on frailty. These types of studies are warranted.
This study has certain limitations and strengths. The study population is predominantly non-Hispanic White; therefore, generalizing these findings to other racial groups should be done with considerable caution. Also, the small sample size for this pilot analysis likely resulted in Type II error leading to nonsignificance of risk factors where associations may exist in the population. Measures of cognitive and nutritional status were not available for these analyses, and an optimal design would have been to longitudinally follow individuals from early adulthood through late life to track the performance and consistency of risk factors throughout the adult life span. Fortunately, this work is presently ongoing. The major strength of this study is the use of simple physical performance measures and their normative-based cut points to quantify PBEF status. From a clinical perspective, these two simple functional tests could be easily incorporated into clinical practice, and if PBEF is identified, risk factors for PBEF could be further collected and discussed using a secondary preventive approach.
In summary, the results from this study indicate that PBEF in midlife is likely a state influenced by current health status, particularly levels of physical activity. Whereas older age PBEF is influenced by antecedent behavioral risk, lower strength, and current sleep quality and inflammation. This highlights the importance of designing and implementing targeted interventions to prevent frailty and its sequela, and emphasizing healthy behaviors throughout the adult life span.
Footnotes
Acknowledgements
A special thanks to the participants of the Fels Longitudinal Study, without whom this work would not be possible.
Author’s Note
The sponsors had no role in the design and conduct of the study; in the collection, analysis, and interpretation of data; in the preparation of the manuscript; or in the review or approval of the manuscript.
Declaration of Conflicting Interests
The author(s) declared no potential conflicts of interest with respect to the research, authorship, and/or publication of this article.
Funding
The author(s) disclosed receipt of the following financial support for the research, authorship, and/or publication of this article: This work was funded, in part, by National Institutes of Health (NIH; R01-HD012252; Eunice Kennedy Shriver National Institute of Child Health and Human Development).