
Abstract
Introduction
In the United States, health care costs for coronary heart disease (CHD) were approximately US$274 billion in 2008 (“National Center for Health Statistics,” 2009). As the population has aged, the burden of chronic diseases has increased rapidly over the past few decades. A better understanding of the causes and consequences of chronic conditions will help policy makers identify ways to reduce the burden of chronic disease among older adults. As chronic conditions develop gradually over time, it is important to consider the early life environment of individuals. Prior research has found that early life environment and social conditions affect development of chronic diseases such as hypertension, stroke, lung function, diabetes, and CHD (Glymour, Avendano, Haas, & Berkman, 2008; Lawlor, Ebrahim, & Davey Smith, 2004; Lawlor, Smith, & Ebrahim, 2004; Liu et al., 2013; Ramsay, Whincup, Morris, Lennon, & Wannamethee, 2007).
A number of studies have examined the association between childhood socioeconomic status (SES) and CHD and have found this association to be independent of adult SES (Falkstedt, Lundberg, & Hemmingsson, 2011; Lawlor, Smith, & Ebrahim, 2004; Ramsay et al., 2007). However, these studies did not adjust for adult behavioral risk factors, like smoking, alcohol consumption, and obesity (Lawlor, Smith, & Ebrahim, 2004), which are known to be associated with poor health and increased risk of CHD (Beatty, Kamarck, Matthews, & Shiffman, 2011; Feinstein & Bynner, 2004; Kittleson et al., 2006), potentially confounding the effects of childhood SES on CHD. Although other studies have examined the association between childhood SES, adult behavioral risk factors, and CHD, the results are mixed, likely reflecting the limited availability of representative samples and a lack of comprehensive assessment of risk factors along with childhood and adult SES (Gliksman et al., 1995; Lawlor, Ebrahim, & Davey Smith, 2005; Smith, Hart, Blane, & Hole, 1998).
The limitations of this prior work warrant more careful analysis to better understand which factors affect the prevalence of CHD in older adults. To this end, we investigated the association between childhood SES and the incidence of CHD in adults aged 50 or older over a 20-year period, using maternal and paternal educational status as a proxy for the SES of the household in which the person lived during early childhood. We also assessed the role of adult SES and adult behavioral risk factors (smoking, alcohol consumption, and obesity) when examining the association between childhood SES and CHD. In other words, we have examined the effects of childhood SES and adult SES separately and in combination in addition to the effects of various behavioral risk factors on CHD.
Method
Data Source
We used data from the 1992-2012 waves of the Health and Retirement Study (HRS), a longitudinal household-based, nationally representative multistage probability survey of community-dwelling older adults and their spouses. The survey has been conducted by the University of Michigan and the National Institute of Aging since 1992. The first wave of the HRS occurred in 1992 with a 51- to 61-year-old cohort and was merged with the older Asset and Health Dynamics of the Oldest Old Study (AHEAD; born 1890-1923) in 1998. Two additional cohorts, the War Babies (WBs) Cohort (born 1942-1947) and Children of the Depression (CODA; 1924-1930) were added in 1998 resulting in a nationally representative sample of the U.S. population over age 50 in 1998. The purpose of the survey is to obtain self-reported data for the study of retirement and health among the elderly population. As of September 2014, 11 waves of data (HRS 1992, AHEAD 1993 and HRS 1994, AHEAD 1995 and HRS 1996, HRS 1998, HRS 2000, HRS 2002, HRS 2004, HRS 2006, HRS 2008, HRS 2010 final data releases, and the early release for HRS 2012) were released and compiled by the RAND Center for the Study of Aging (RAND HRS). We used the RAND HRS data in this study. Details of the HRS have been reported previously (Bowen, 2009, 2010; Bowen & Gonzalez, 2010).
The data set includes information on 36,935 respondents aged 50 or older. One of the problems with the data set is the number of missing variables related to adult and childhood SES. In the data set, 80 participants did not report their race, 20 participants did not report their educational status, 7,450 participants did not report maternal and/or paternal education levels, and eight participants did not report educational attainment of their spouse. We adopted a number of strategies to deal with the missing values. One approach is simply to exclude all the cases with missing relevant data (n = 7,499). If we exclude these cases, the final data set consists of 29,436 participants (12,989 men and 16,447 women). A second approach is to assume that the missing educational attainments of one of the parents is due to absence of the parent in the household. Therefore, the educational attainment of one parent should reflect childhood SES, and the educational level of the missing parent is considered a true zero. The third approach is to impute missing educational attainment data for one parent from the information we have on the educational attainment of the other parent. This approach implicitly assumes that there is a relationship between maternal and parental education levels.
Childhood SES
The main independent variable of interest was childhood SES. The HRS survey questionnaire asked subjects about the highest grade of school completed by their mother and father. Based on the maternal and paternal education levels, we calculated childhood SES by combining the educational attainments of both parents. All households were categorized into one of three equal groups—low childhood SES, middle childhood SES, and high childhood SES—based on the total years of parental education. Two additional childhood SES values were obtained by assuming that missing parental education for one parent should be considered as zero for the purpose of measuring childhood SES (assuming single-parent household) or imputing a value for maternal or parental education based on the reported education of their spouse.
Adult SES
The HRS survey questionnaire asked subjects about the highest grade of school completed by the subject and their spouse. Although income and wealth are widely used to measure current SES, savings and consumption behavior over the life cycle makes these variables unreliable proxies for SES for individuals who are retired or close to retirement. For example, the current income of a retired person may be low even though the person has a significant level of wealth. Even wealth ownership will bias the SES measure, especially for older adults who tend to convert wealth into liquid assets. For these reasons, we decided to use an index of income earning potential based on educational attainment of the individual and his or her spouse. Using the wage rate of workers by gender at different levels of educational attainment, we derived the index of income earning potential for both the respondent and the spouse. Once adult SES was derived, all households were grouped into two categories—low adult SES and high adult SES—using the median level of the income index as the cutoff. As almost all respondents reported their own educational attainment, estimation of adult SES using educational attainment levels did not pose any concerns.
CHD
The main dependent variable of interest was CHD. CHD was defined by a person’s self-identified response to the HRS survey question as to whether a doctor had told them they had a history of heart attack, CHD, angina, congestive heart failure, or other heart problems. A person was considered to have CHD if one of the above conditions occurred more than once over the 11 waves (1992-2012), and this was recorded as a binary outcome variable (ever or never). Respondents who had reported CHD at the starting wave were not excluded when the occurrence of CHD was studied.
Independent Variables
Based on a literature review, we identified eight variables in four domains (childhood SES factors, adult SES factors, demographic factors, and adult behavior risk factors) that are associated with CHD (Bowen, 2009; Cohen, Janicki-Deverts, Chen, & Matthews, 2010; Lawlor, Smith, & Ebrahim, 2004). Demographic factors included age (grouped as 50-59, 60-69, 70-79, and ≥80 years), sex (male, female), and race (White, Black, and Others). Adult behavioral risk factors included having ever smoked, having ever consumed alcohol, and having ever been obese (body mass index [BMI] ≥ 30 kg/m2). These binary variables were equal to 1 if smoking, alcohol consumption, or obesity occurred more than once over the 11 waves (1992-2012), and 0 otherwise. Adult behavioral risk factors were defined before the occurrence of CHD in each respondent across 1992-2012.
Statistical Analyses
We used descriptive statistics to describe participant characteristics and report the number and percentage of participants for each of the variables in the analysis. In addition, we used chi-square tests to identify differences between low and high childhood SES groups and between low and high adult SES groups. To assess the combined effect of SES, we categorized respondents into six subgroups using both the childhood and adult SES. These six subgroups were respondents with (a) high childhood and adult SES, (b) middle childhood SES and high adult SES, (c) low childhood SES and high adult SES, (d) high SES at childhood and low adult SES, (e) middle childhood SES and low adult SES, and (f) low SES at childhood and as adult. We calculated odds ratios (ORs) for CHD with 95% confidence intervals (CIs) for these six groups with those in high childhood and adult SES as the reference category.
We adopted a number of strategies to deal with the missing values. One approach is simply to exclude all cases with missing relevant data. A second approach is to assume that the missing educational attainments of one of the parents reflect absence of the parent in the household. Therefore, the educational attainment of one parent should reflect childhood SES, and the educational level of the missing case is considered a true zero. The third approach is to impute the missing educational attainment data for one parent from the information we have on the educational attainment of the other parent.
We used multivariable, hierarchical logistic regression models to identify predictors of CHD. We introduced the combined childhood and adult SES measure into the model first, followed by demographic and adult behavior risk factors, to examine whether the combined SES coefficients were influenced by adding other variables to the model. We assessed fully adjusted ORs after incorporating demographic and adult behavior risk factors in the logistic model. We performed all statistical analyses using SAS Version 9.4 (SAS Inc., Cary, NC, USA) and determined statistical significance using a two-tailed p value ≤.05.
If the adjusted ORs showed significant changes due to stepwise incorporation of demographic and behavioral risk factors, we carried out further analyses to examine the reasons for such changes. For example, if including demographic factors substantially changes the ORs, it may imply that the relationship between childhood SES and CHD varies significantly among different demographic groups, and therefore, a stratified analysis might be warranted.
Results
Characteristics of the study population (when educational attainments of both the parents are available) by childhood and adult SES are summarized in Table 1. Most respondents were in the age group 80 years and older (44.3%). The majority were White (79.2%) and females (55.9%). By design, one third of respondents were in the low childhood SES category. The proportion of respondents who had ever smoked before the occurrence of CHD was 19.1%, while 19.9% reported having ever consumed alcohol before the occurrence of CHD. The proportion of respondents who had ever had hypertension was 63.7%, while 11.7% reported experiencing stroke (Table 1). Moreover, survey respondents with low childhood SES reported having CHD more often than respondents with high childhood SES (p < .0001). Similarly, low adult SES appears to be associated with a higher prevalence of CHD compared with individuals with high adult SES (p < .0001).
Characteristics of Study Population by Childhood and Adult SES: HRS, 1992-2012.
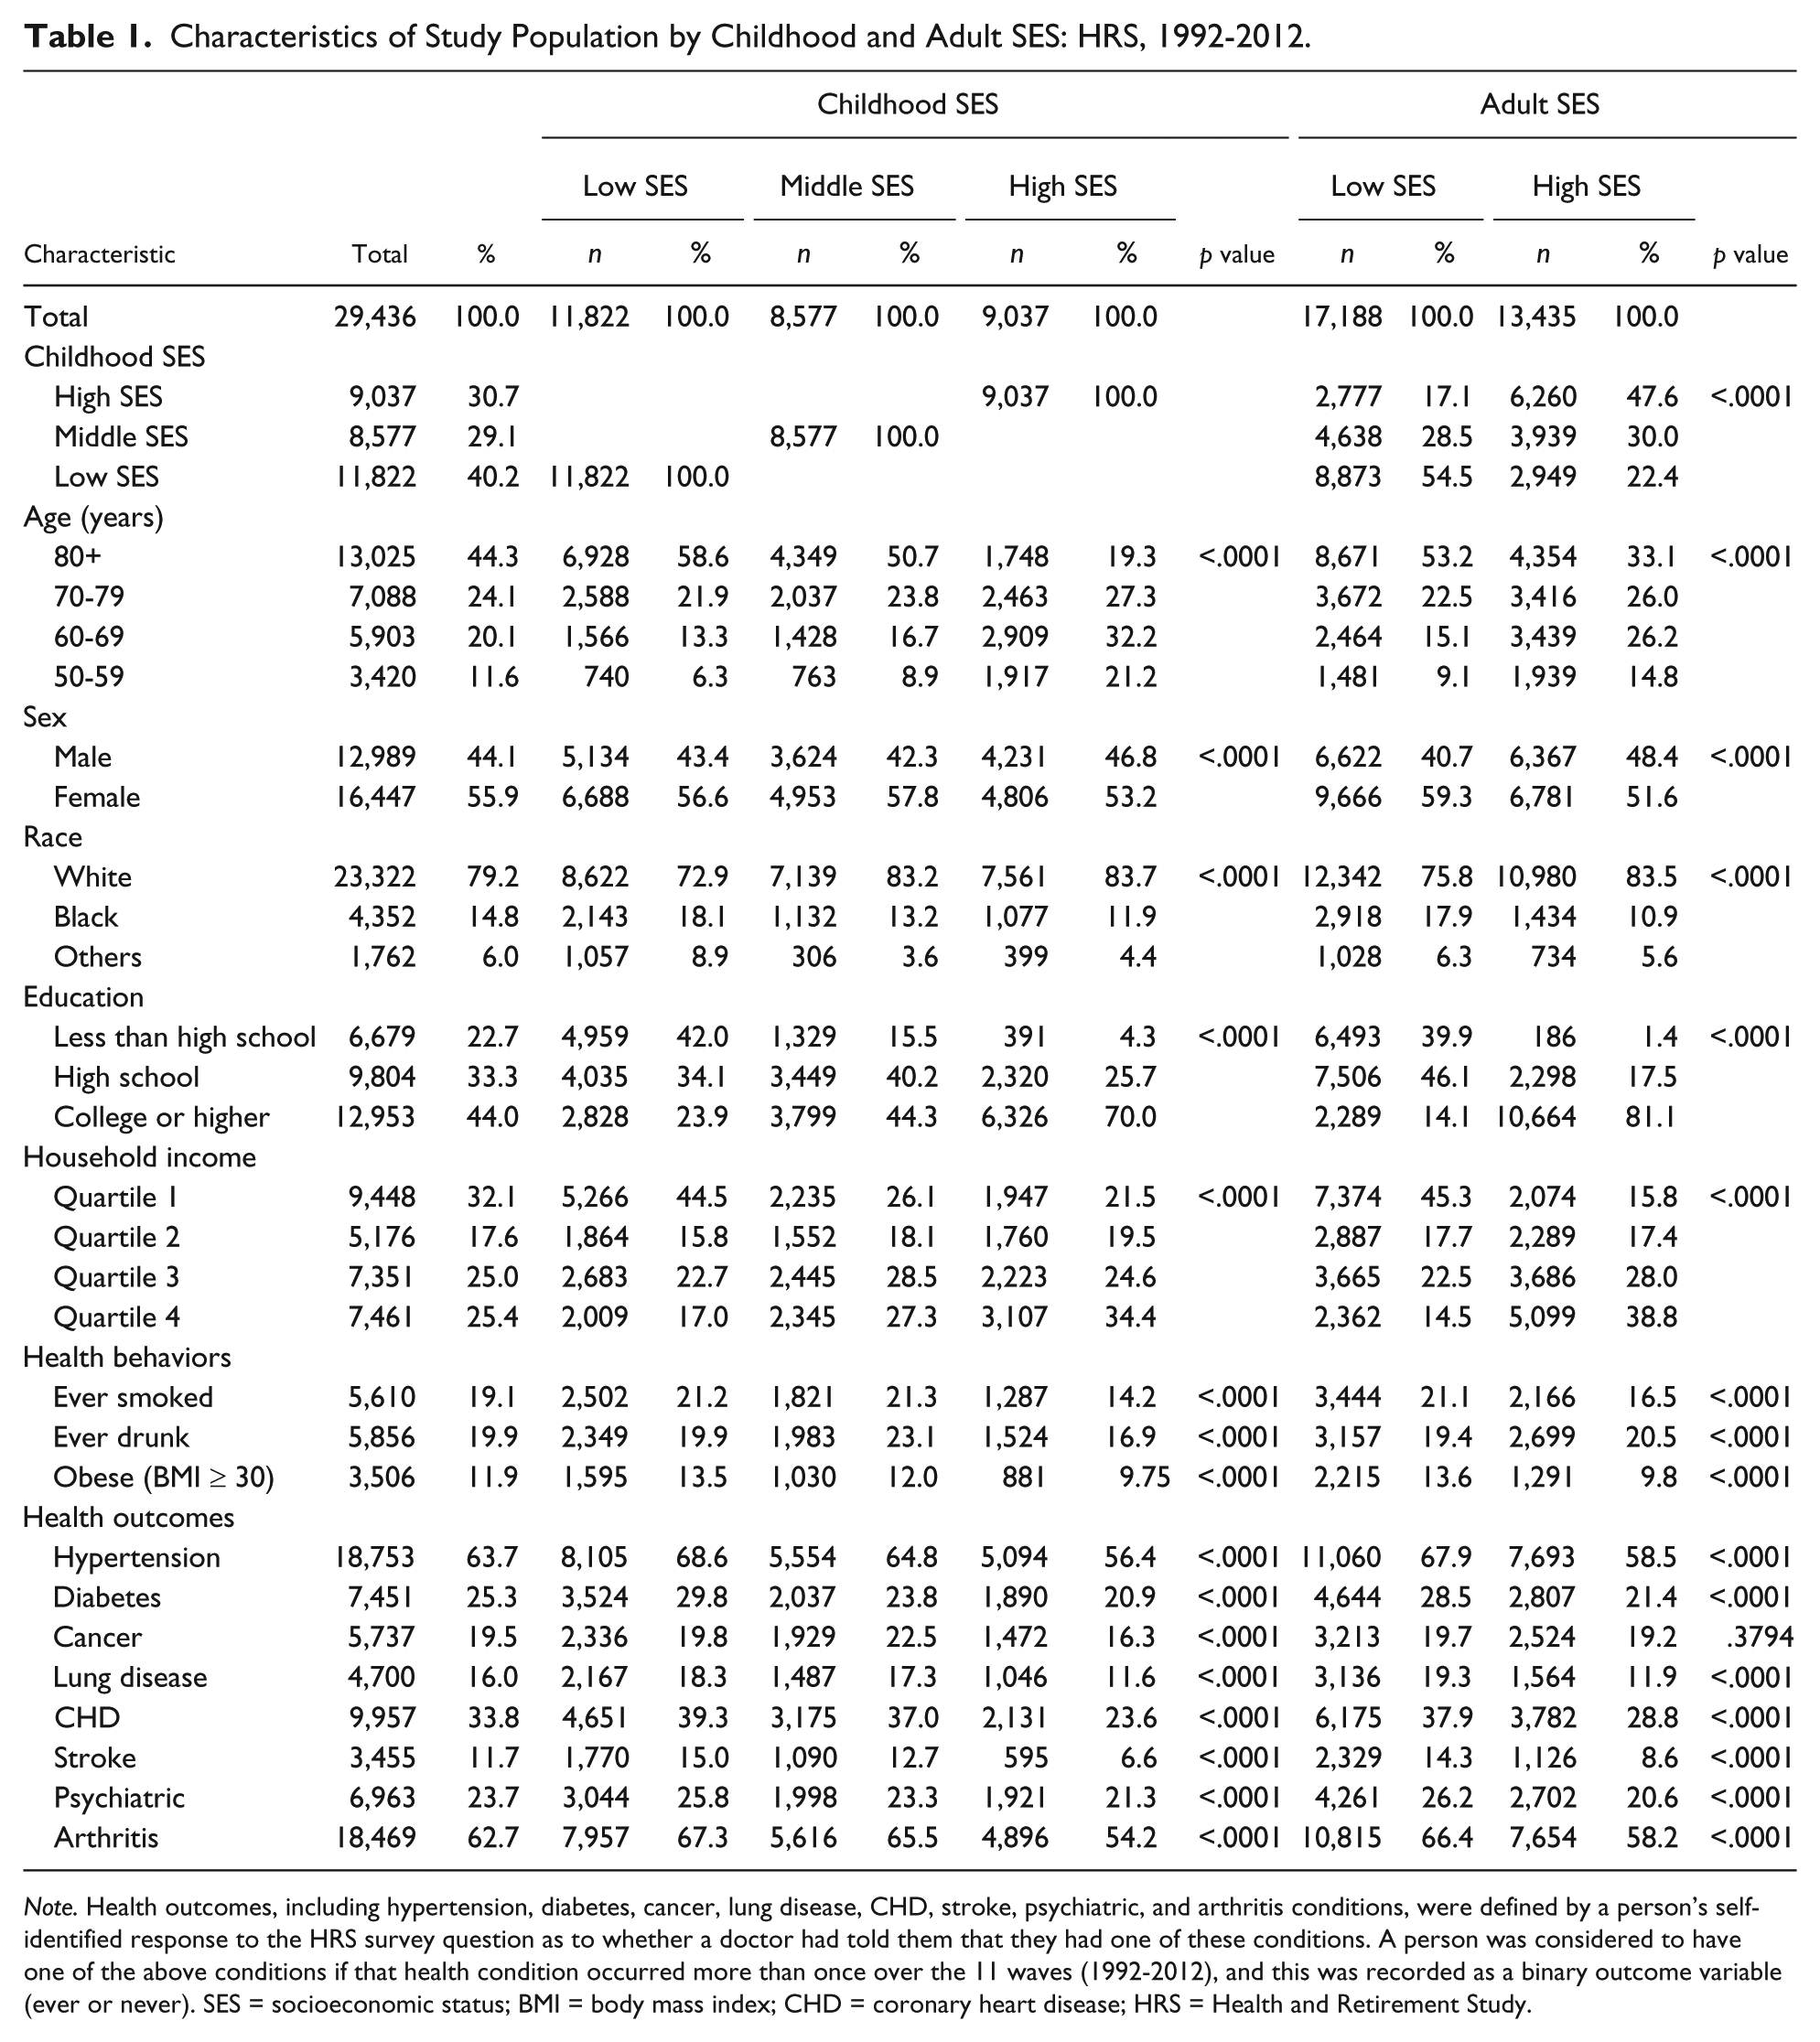
Note. Health outcomes, including hypertension, diabetes, cancer, lung disease, CHD, stroke, psychiatric, and arthritis conditions, were defined by a person’s self-identified response to the HRS survey question as to whether a doctor had told them that they had one of these conditions. A person was considered to have one of the above conditions if that health condition occurred more than once over the 11 waves (1992-2012), and this was recorded as a binary outcome variable (ever or never). SES = socioeconomic status; BMI = body mass index; CHD = coronary heart disease; HRS = Health and Retirement Study.
Table 2 shows the number of participants with CHD and the unadjusted relative risk of CHD by childhood and adult SES categories. About 39.3% of individuals with low childhood SES reported having CHD compared with 23.6% of individuals with high childhood SES (p < .0001). The occurrence of CHD is also about 37.9% among the low adult SES group compared with 28.7% among the high adult SES group (p < .0001). People with low childhood SES were 2.1 times more likely (95% CI = [1.98, 2.23]) to have CHD than people with high childhood SES. Similarly, people with low adult SES were 1.51 times more likely (95% CI = [1.44, 1.59]) than people with high adult SES to have CHD.
Unadjusted Childhood SES Differences in CHD: Health and Retirement Survey, 1992-2012.
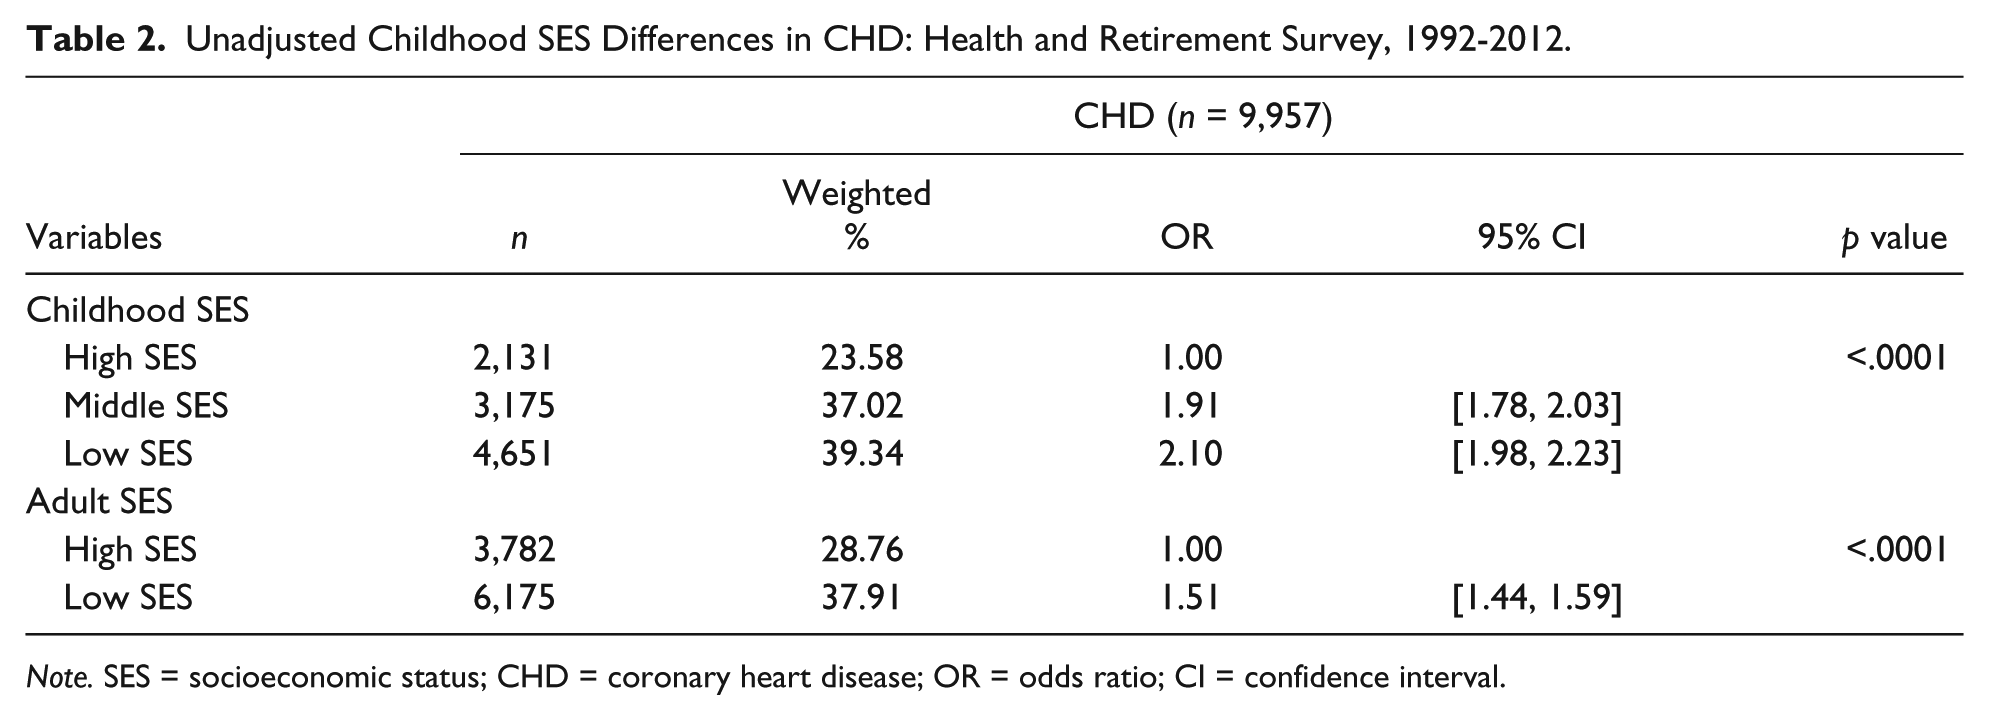
Note. SES = socioeconomic status; CHD = coronary heart disease; OR = odds ratio; CI = confidence interval.
Table 3 reports the unadjusted ORs for different combinations of childhood and adult SES among older adults to examine the relationship between CHD risk and childhood and adult SES in combination. The ORs were estimated using high childhood SES and high adult SES as the reference group. Of those with low childhood SES and low adult SES, 40.4% reported having CHD compared with 22.5% of those with high childhood SES and high adult SES (p < .0001). People with high childhood SES and low adult SES were 1.21 times more likely to report CHD (95% CI = [1.09, 1.35]) while people with low childhood SES and high adult SES were 1.94 times more likely (95% CI = [1.77, 2.14]) to report CHD compared with individuals with both high childhood and high adult SES. Lower SES in childhood appears to be a stronger determinant of CHD in older adults than lower SES in adulthood.
Risk of CHD According to Childhood and Adult SES: HRS, 1992-2012.

Note. CHD = coronary heart disease; SES = socioeconomic status; HRS = Health and Retirement Study; OR = odds ratio; CI = confidence interval.
Table 4 shows the relative risk of CHD adjusted for demographic and behavioral risk factors by childhood and adult SES group. Introducing demographic and behavioral risk factors slightly decreased the ORs relative to the basic model, with significant childhood and adult SES differences persisting (Table 4). In general, people with low childhood SES and low adult SES were significantly more likely to have CHD than individuals with high childhood SES and high adult SES. More specifically, people with both low childhood and adult SES were 2.44 times more likely (95% CI = [2.02, 2.93]) than people with both high childhood and adult SES to report CHD (Model 3). People with low childhood SES and high adult SES were 1.60 times more likely (95% CI = [1.26, 2.01]) than people with high childhood SES and high adult SES to report CHD in the fully adjusted model (Model 3). Although the results in this case are weaker, the association between childhood SES and adult CHD remains significant.
Association Between SES and CHD Among U.S. Older Adults: Health and Retirement Survey, 1992-2012.
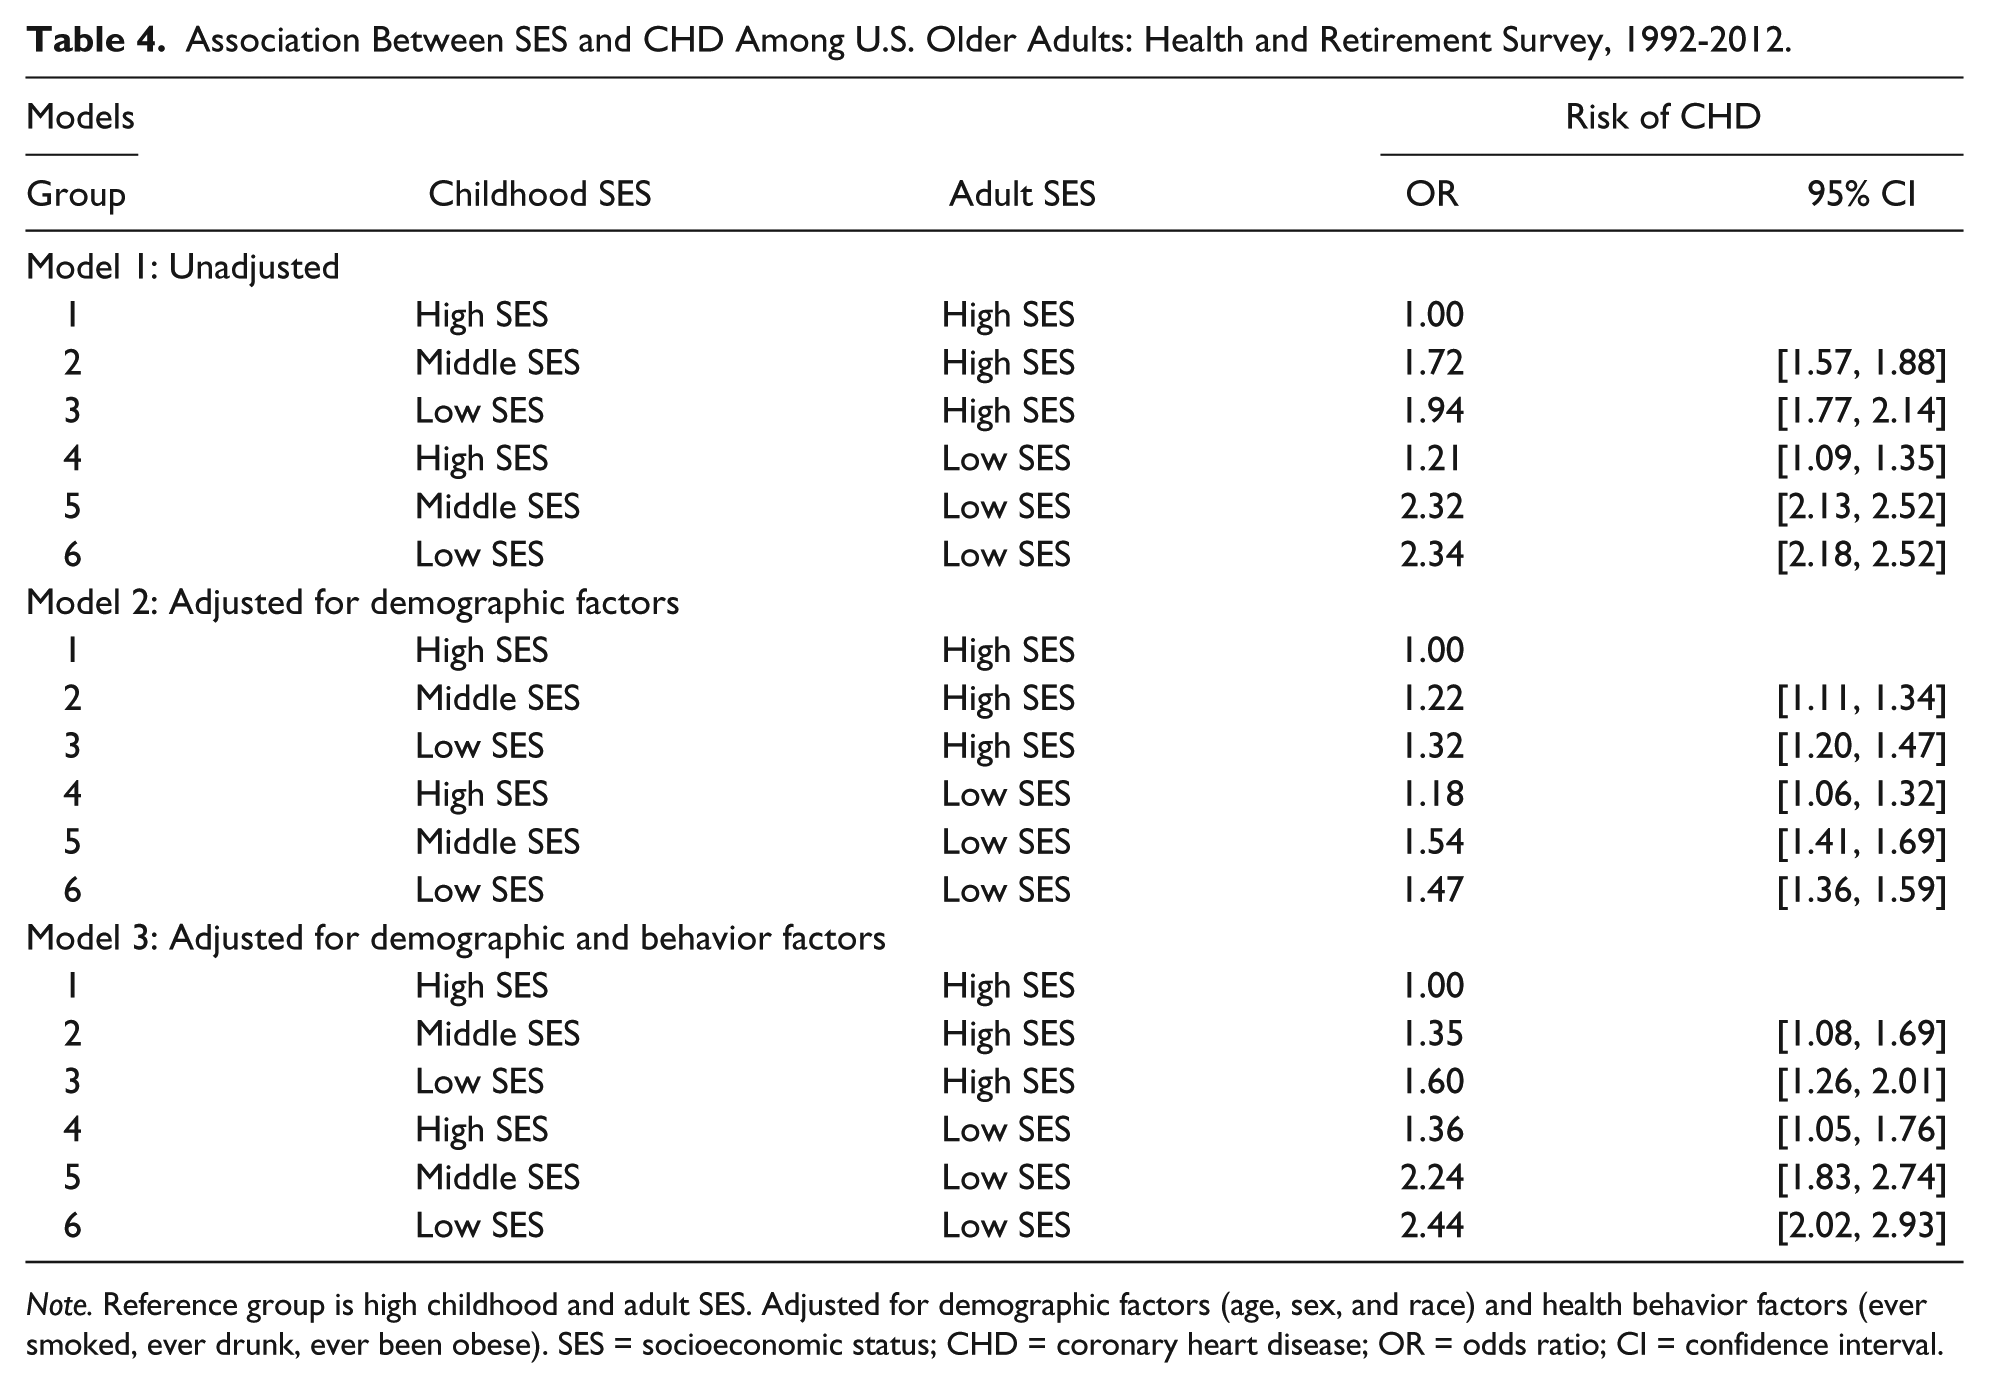
Note. Reference group is high childhood and adult SES. Adjusted for demographic factors (age, sex, and race) and health behavior factors (ever smoked, ever drunk, ever been obese). SES = socioeconomic status; CHD = coronary heart disease; OR = odds ratio; CI = confidence interval.
Discussion
In this nationally representative longitudinal study of community-dwelling older Americans, we found that childhood and adult SES are strongly associated with the development of CHD in later life. Adjusting for a variety of demographic and behavioral risk factors attenuated this relationship somewhat, but lower childhood SES and lower adult SES both remained important in explaining adult CHD risk. In our sample of 29,436 individuals (those who reported educational attainment of both parents), we found that people with low childhood SES were significantly more likely to report CHD. This finding is consistent with previous studies (Blackwell, Hayward, & Crimmins, 2001; Bowen, 2010; Cohen et al., 2010; Lawlor, Smith, & Ebrahim, 2004; Ramsay et al., 2007). Most concerning is the fact that 39.3% of those with low childhood SES had CHD compared with 23.6% of those with high childhood SES (p < .0001). Moreover, 37.9% of those with low adult SES had CHD compared with 28.7% of those with high adult SES (p < .0001).
Consistent with earlier research, our results confirmed that lower childhood SES is associated with increased CHD risk (Falkstedt et al., 2011; Galobardes, Lynch, & Davey Smith, 2004; Lawlor, Smith, & Ebrahim, 2004; Ramsay et al., 2007). Preston, Hill, and Drevenstedt (1998) investigated the relationship between childhood SES and mortality and reported that childhood poverty, being raised in a single-parent family, and parental illiteracy are all correlated with a greater risk of mortality among samples of Black adults. Furthermore, Lynch, Kaplan, and Salonen (1997) reported that childhood poverty is linked to risky health behaviors, such as poor nutrition, smoking, and physical inactivity in adulthood in a population-based sample of Eastern Finnish men. Assuming this is also true for the U.S. population, it implies that the total effect of childhood SES will be underestimated in our model that adjusts for behavioral risk factors. In our model, that does not adjust for the behavioral risk factors; low childhood SES was associated with a relatively high risk of CHD even after adjusting for individuals with high adult SES.
Our study has some limitations. First, the RAND HRS is based on self-reported responses and may be subject to recall bias or acquiescence bias. The survey did not perform a crosscheck of reported medical conditions with an individual’s medical records. However, self-reported chronic disease prevalence has been shown to be highly concordant with both repeated surveys and medical-record reports (Bush, Miller, Golden, & Hale, 1989; Psaty et al., 1995). Thus, the potential bias due to reporting error of medical condition should be minimal.
Second, we have used a proxy measure to determine childhood SES. We calculated childhood SES by combining the educational attainments of both parents. SES is a multidimensional construct, and other studies have used parental education level, occupation, and/or income as a childhood SES variable (Bowen, 2010; Lynch et al., 1997; Winkleby, Robinson, Sundquist, & Kraemer, 1999). Although several studies have shown that income may be the best marker of childhood SES (Daly, Duncan, McDonough, & Williams, 2002; Lantz et al., 1998), this study has used parental education for defining childhood SES for a number of reasons. First, parental education is unlikely to have significant reporting error, so using it to derive an index of childhood SES should be quite reliable. Second, for the older population, using income or asset to define adult SES will be biased as they tend to dissave at this phase of life cycle. Note that, to define adult SES, we have converted self-reported years of educational attainment of the individual and his or her spouse into an index of income earning potential. The derivation of education-based income earning potential, however, may become biased if labor force participation rates of men and women varied significantly during our study.
Third, there is the possibility of selection bias in recruiting survey participants. If low childhood SES is associated with higher mortality or a greater likelihood of being institutionalized rather than living in the community, then older adults with low childhood SES will be underrepresented in our sample. In that case, our results are likely to be biased downward, meaning the true relationship between childhood SES and prevalence of CHD later in life would be higher than the estimates reported here. It is also possible that the use of maternal and paternal education levels to evaluate childhood SES creates some bias in defining SES as educational attainments have changed significantly over time.
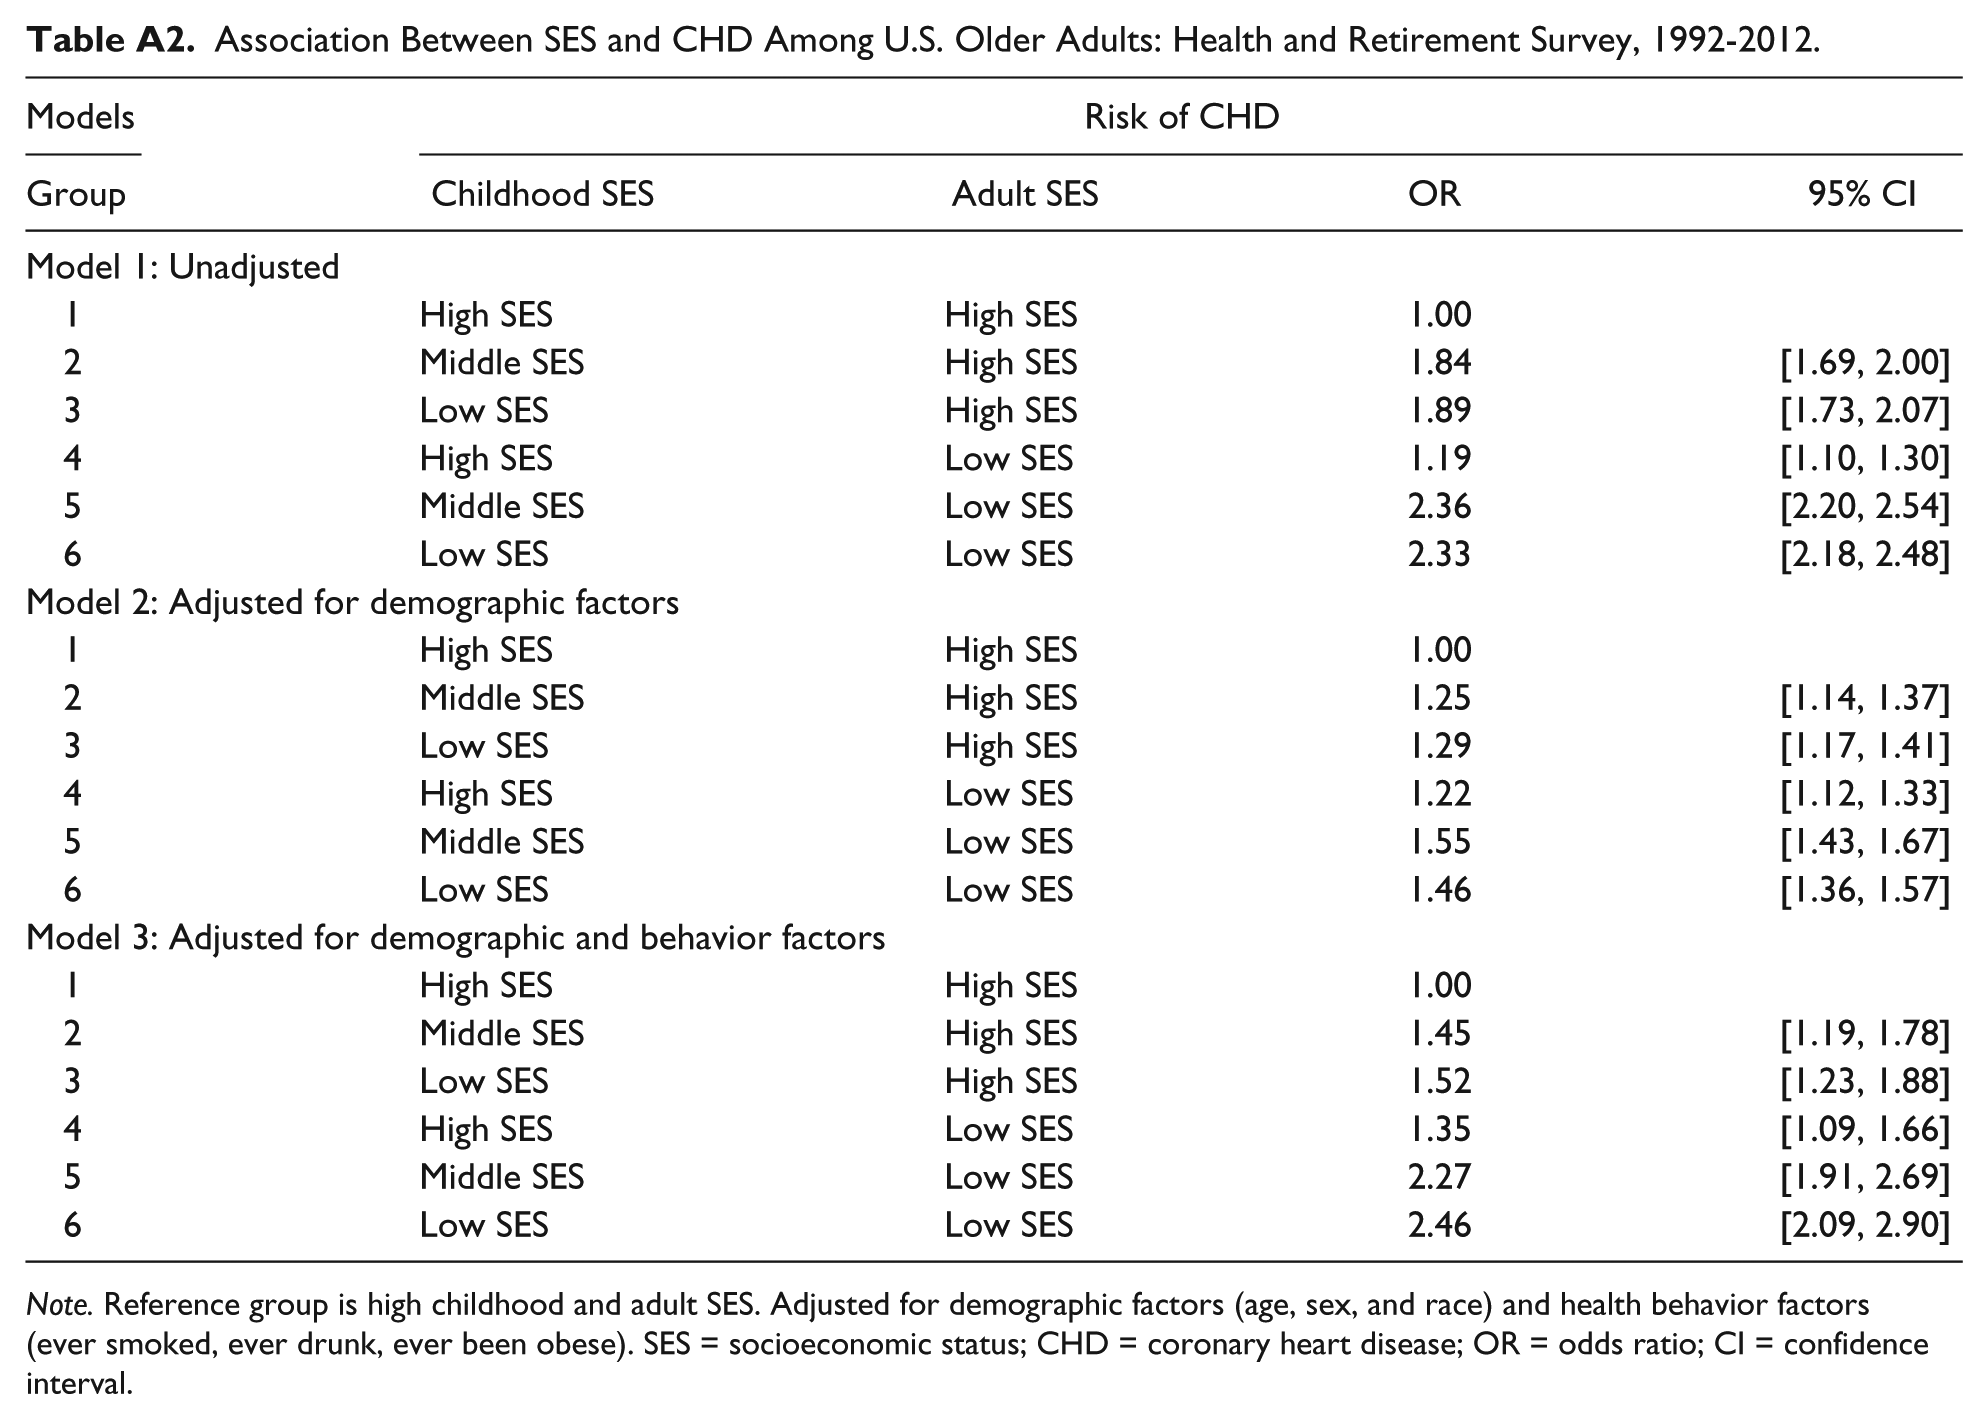
Finally, exclusion of more than 7,000 individuals who did not report parental education for both parents may bias the results presented here. In Appendix Table A1, we report the adjusted ORs by assuming that the missing educational attainment of one of the parents is due to absence of the parent from the household. Clearly, this is not necessarily true for all cases, but there is no information on single-parent household status in the data set. If we include all individuals with at least one of the parents’ educational attainments mentioned, missing cases decline from 7,450 to 3,096. Under this scenario, low childhood SES still increases the likelihood of CHD after controlling for adult SES and other behavioral risk factors. The third approach was to compute the missing educational attainment values after controlling for age of the respondents and/or educational attainment of one of the parents. Appendix Table A2 reports the results after missing value imputation. Although the results in this case are weaker, the association between childhood SES and adult CHD remains significant.
We found a significant association between childhood and adult SES and CHD in adults aged 50 or older over a 20-year period after adjusting for demographic and behavioral risk factors. These findings indicate the importance of viewing the development of chronic diseases like CHD as a lifelong process that may be most adequately combated by appropriate interventions during childhood. Although it is probably not feasible to suggest interventions that would improve childhood SES directly, public health policy makers should consider approaches to minimize the negative effects of low childhood SES as a strategy for reducing the prevalence of CHD later in life. The importance of this is underscored by the finding that improving SES later in life fails to offset the increased risk of CHD associated with low childhood SES. At the same time, efforts to intervene among low SES adults should not be discounted, and continued efforts to address known behavioral risk factors are warranted. Ultimately, however, our results suggest that efforts to improve the social well-being of low SES children are essential to lowering the risk of CHD among future generations of older Americans.
Footnotes
Appendix
Association Between SES and CHD Among U.S. Older Adults: Health and Retirement Survey, 1992-2012.
| Models |
Risk of CHD |
|||
|---|---|---|---|---|
| Group | Childhood SES | Adult SES | OR | 95% CI |
| Model 1: Unadjusted | ||||
| 1 | High SES | High SES | 1.00 | |
| 2 | Middle SES | High SES | 1.84 | [1.69, 2.00] |
| 3 | Low SES | High SES | 1.89 | [1.73, 2.07] |
| 4 | High SES | Low SES | 1.19 | [1.10, 1.30] |
| 5 | Middle SES | Low SES | 2.36 | [2.20, 2.54] |
| 6 | Low SES | Low SES | 2.33 | [2.18, 2.48] |
| Model 2: Adjusted for demographic factors | ||||
| 1 | High SES | High SES | 1.00 | |
| 2 | Middle SES | High SES | 1.25 | [1.14, 1.37] |
| 3 | Low SES | High SES | 1.29 | [1.17, 1.41] |
| 4 | High SES | Low SES | 1.22 | [1.12, 1.33] |
| 5 | Middle SES | Low SES | 1.55 | [1.43, 1.67] |
| 6 | Low SES | Low SES | 1.46 | [1.36, 1.57] |
| Model 3: Adjusted for demographic and behavior factors | ||||
| 1 | High SES | High SES | 1.00 | |
| 2 | Middle SES | High SES | 1.45 | [1.19, 1.78] |
| 3 | Low SES | High SES | 1.52 | [1.23, 1.88] |
| 4 | High SES | Low SES | 1.35 | [1.09, 1.66] |
| 5 | Middle SES | Low SES | 2.27 | [1.91, 2.69] |
| 6 | Low SES | Low SES | 2.46 | [2.09, 2.90] |
Note. Reference group is high childhood and adult SES. Adjusted for demographic factors (age, sex, and race) and health behavior factors (ever smoked, ever drunk, ever been obese). SES = socioeconomic status; CHD = coronary heart disease; OR = odds ratio; CI = confidence interval.
Acknowledgements
The authors thank reviewers of the article for the comments and suggestions provided on an earlier draft. They also thank John Sorrentino at Temple University for the comments in the 90th Annual Western Economic Association International Conference.
Authors’ Note
M. L. developed the research question, performed the analysis, and prepared the first draft. M.L., M.K., and B.W. revised the article, interpreted the results, and identified alternative modeling approaches. All authors participated in the design and planning of the study and approved the final article.
Declaration of Conflicting Interests
The authors declared no potential conflicts of interest with respect to the research, authorship, and/or publication of this article.
Funding
The authors received no financial support for the research, authorship, and/or publication of this article.