
Abstract
Intra-ocular straylight can cause decreased visual functioning, and it may cause diminished vision-related quality of life (VRQOL). This cross-sectional population-based study investigates the association between straylight and VRQOL in middle-aged and elderly individuals. Multivariable linear regression analyses were used to assess the association between straylight modeled continuously and cutoff at the recommended fitness-to-drive value, straylight ≥ 1.4 log(s), and VRQOL. The study showed that participants with normal straylight values, straylight ≤ 1.4 log(s), rated their VRQOL slightly better than those with high straylight values (straylight ≥ 1.4 log(s)). Furthermore, multivariable regression analysis revealed a borderline statistical significant association (p = .06) between intra-ocular straylight and self-reported VRQOL in middle-aged and elderly individuals. The association between straylight and self-reported VRQOL was not influenced by the status of the intra-ocular lens (natural vs. artificial intra-ocular lens after cataract extraction) or the number of (instrumental) activities of daily living that were reported as difficult for the elderly individuals.
Introduction
In the eye, light passing through the optical media can be partially scattered by typical structures resulting in a veil of scattered light over the retina (Mainster & Turner, 2012; van den Berg et al., 2007), a phenomenon known as straylight. Visual effects of straylight are hazy vision and decreased contrast sensitivity (Elliott, Hurst, & Weatherill, 1991). Also, the visual effect of straylight as an increased glare has been described, even to the extent of a disability glare with reduced visual performance (van den Berg, Franssen, & Coppens, 2010).
The impact of vision affects several domains of functioning such as mobility (Cimarolli & Jopp, 2014; Swenor, Munoz, & West, 2013), the ability to perform activities of daily living (ADL) and instrumental ADL (IADL; Gopinath, Liew, Burlutsky, & Mitchell, 2014), mental state and quality of life (Cimarolli & Jopp, 2014; Zhang et al., 2013). Studies regarding the specific influence of straylight are limited. Studies on straylight and the ability to drive safely indicate that individuals with straylight values exceeding 1.4 log(s) are unfit to drive safely (Bal, Coeckelbergh, Van Looveren, Rozema, & Tassignon, 2011; Michael et al., 2009).
Changes in vision progress slowly over time and are attributed to normal aging (Owsley, 2011). This process of gradual deterioration of the visual function is often not detected. Individuals are often not aware of the visual decline or consider it normal for their age. A study showed that 43.8% of the 65 years and older with self-reported moderate-to-severe visual impairment felt no need to seek help of an eye care professional despite visual complaints (Centers for Disease Control and Prevention [CDC], 2011). This is an unfortunate situation as early detection and timely treatment can delay the progression of ocular disease or restore visual function thus preserving vision-related quality of life (VRQOL). A Dutch study estimated that 58% of all visual impairment in the Netherlands would be preventable, if detected (Limburg, Keunen, & van Rens, 2009).
We hypothesize that straylight may have an important influence on vision in general and VRQOL and may be an indicator for decreased VRQOL. Therefore, the objective of our study is to investigate whether intra-ocular straylight affects perceived VRQOL in middle-aged and older individuals.
Method
Study Design and Population
This cross-sectional population-based study was conducted on visual functioning. The sample comprised 120 men and women, aged 50 to 89, who visited our research center in Utrecht, the Netherlands, for one half-day. All participants provided written informed consent before enrollment in the study. The study on visual functioning was an extension of a larger study on the PReservation Of Functioning In the ELderly (PROFIEL; den Ouden et al., 2013), which was a 10-year follow-up study of 802 independently living elderly men (Muller, Grobbee, Aleman, Bots, & van der Schouw, 2007) and women (Lebrun et al., 2002). In the longitudinal PROFIEL study, 625 individuals participated between February 2010 and November 2011.
Participants were eligible for this study, referred to as the Visual Functioning Extension Study (VF-PROFIEL), if they visited the study center independently for the measurements of the PROFIEL study and provided permission to be contacted for further studies, leaving 482 persons (264 men and 218 women). Due to organizational constraints, we were unable to examine all eligible PROFIEL participants. To ensure good representation of participants with and without functional limitations, the remaining 482 individuals were split into two groups based on the limitations in IADL: one group of participants with no limitations (KATZ score = 0, n = 373) and one group of participants with any type of limitation (KATZ score > 0, n = 109). To detect a 10-point difference between the groups on the National Eye Institute Visual Functioning Questionnaire (NEI-VFQ-25) composite score (range = 0-100), we needed 50 persons per group, assuming an alpha = .50, two-tailed t test with a power of 80%.
Each group was randomly sampled, and invitations were sent until 60 participants were included in each group. Measurements took place between May 2012 and June 2013.
Participant flow for inclusion is shown in Figure 1. The study protocols for the PROFIEL study as well as the VF-PROFIEL extension were approved by the Institutional Review Board of the University Medical Center Utrecht (METC 09-248).
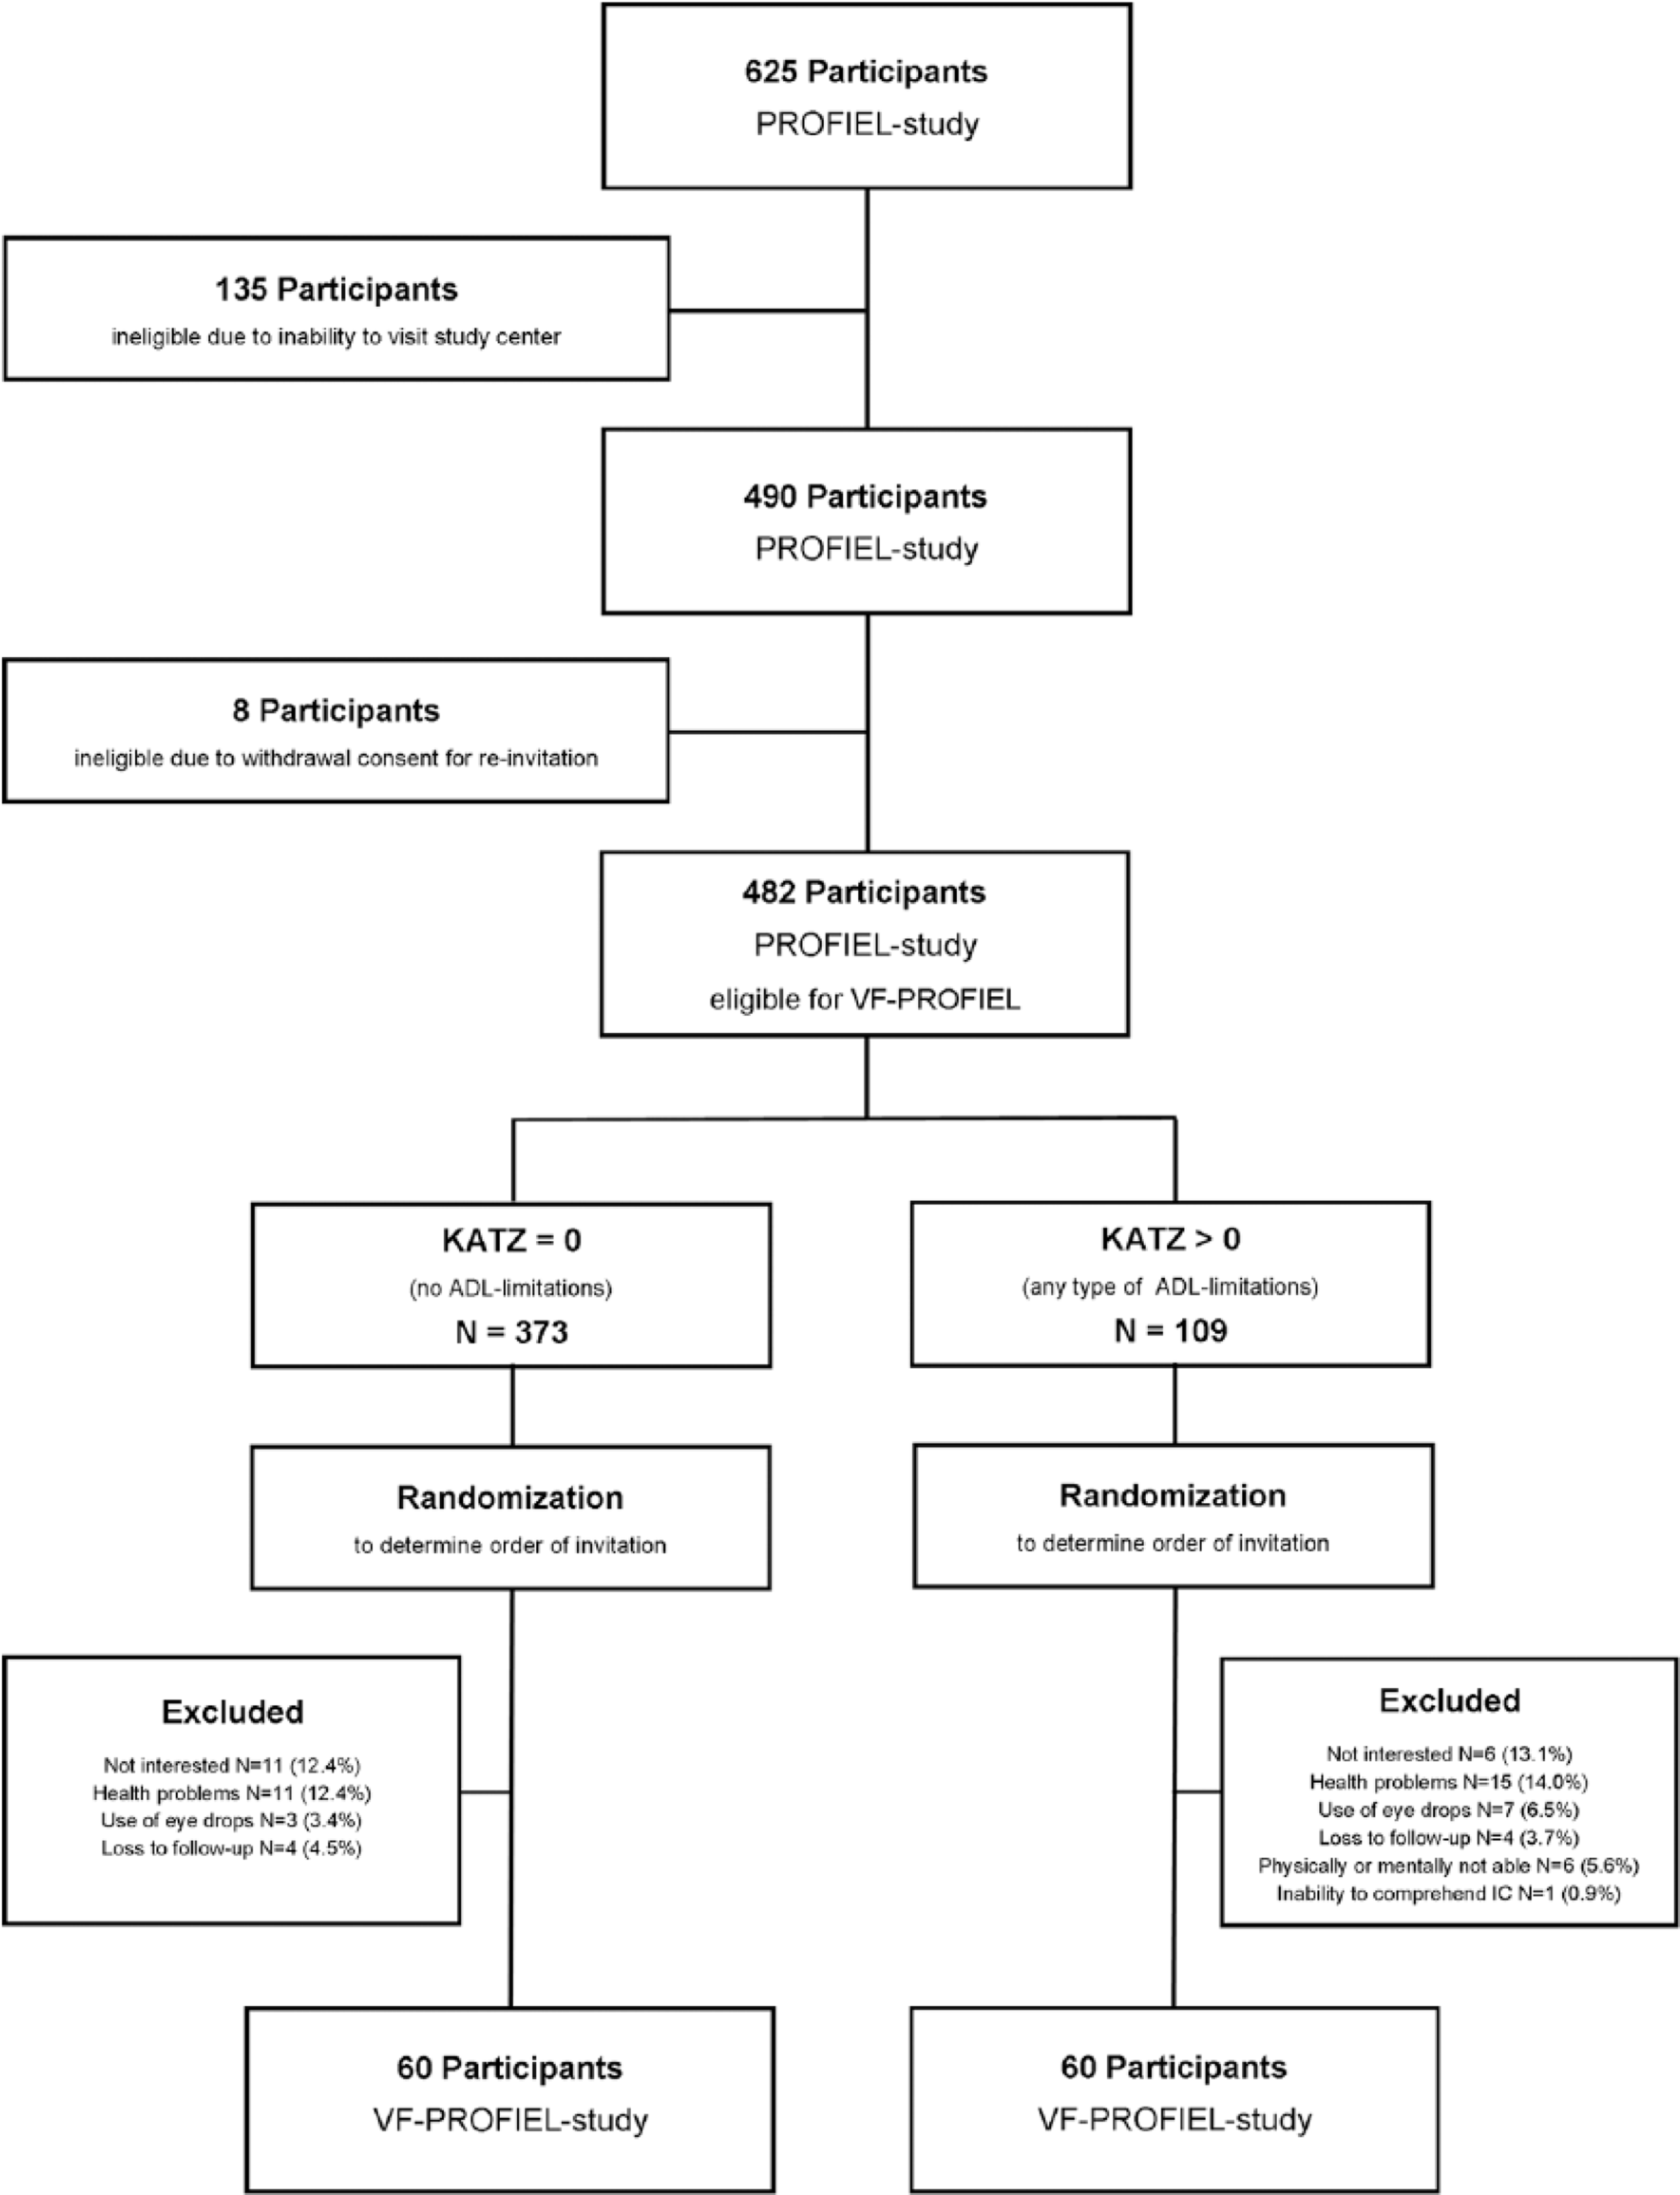
Flowchart on participant inclusion.
Measurements
General characteristics
Information on age, gender, educational level, smoking status, and number of chronic diseases was obtained during the PROFIEL study (February 2010 until November 2011). Based on the International Standard Classification of Education (UNESCO Institute of Statistics, 2012), educational level was categorized as low, middle, high, and university. Smoking habits were classified as never, former, or current. The number of chronic diseases was based on self-reported physicians’ diagnosis of cardiovascular disease, stroke, diabetes mellitus, chronic pulmonary disease, and psychological problems. All vision-related measurements, including a complete ocular history, were conducted during the VF-PROFIEL study.
Outcome of Interest
Self-reported visual functioning/VRQOL
The Dutch version of the NEI-VFQ-25 was used to assess VRQOL. The NEI-VFQ-25 comprises 12 different subscales: General Health (two questions), General Vision (two question), Near Vision (six questions), Distance Vision (six questions), Driving (three questions), Peripheral Vision (one question), Color Vision (one question), Ocular Pain (two questions), Role Difficulties (four questions), Dependency (four questions), Social Functioning (three questions), and Mental Health (five questions; Mangione et al., 2001). According to the NEI guidelines, answers to each question were first converted to a 100-point scale, with 100 representing the best possible score and 0 the worst possible score. Next, a score for each subcategory was created. Finally, an overall composite score was calculated ranging from 0 (worst score) to 100 (best score).
Determinant
Straylight was measured using the Oculus C-Quant instrument (Oculus GmbH, Germany). The participant was presented with a series of concentric areas with the central area being divided in two: one half with and one half without counter-phase comparison light. Participants were asked to identify the central half flickering the most by pressing a button. Using the compensation comparison method, the intra-ocular straylight was measured in log units (Franssen, Coppens, & van den Berg, 2006). Higher values of straylight indicate more intra-ocular straylight and higher sensitivity to glare. The average of the monocular straylight measurements of both eyes was calculated to obtain binocular straylight values to be used as a proxy for total straylight disability enabling binocular analysis (Franssen, de Wit, Coppens, & van den Berg, 2003). Measurements with an estimated standard deviation (ESD) of >0.1 were considered unreliable and recoded as missing.
Other Measurements
Visual acuity was tested monocularly and binocularly with and without habitual correction at distance and near—6 m and 40 cm, respectively—using Landolt C optotypes. In addition, the best corrected visual acuity was obtained after monocular and binocular refraction. Prior to analysis, decimal visual acuity values were converted to Logarithm of the Minimum Angle of Resolution (logMAR). Statistical analysis was performed using habitual correction and treating binocular visual acuity as a continuous variable.
Contrast sensitivity was obtained monocularly and binocularly using the Pelli-Robson Contrast Sensitivity Chart (Clement Clarke, Harlow, UK). Participants standing at a distance of 1 m were required to identify letters equivalent to a visual acuity of 0.2 (0.77 logMAR) with a decrease in contrast from the upper left to the lower right corner of the chart. The last letter group at which at least 2 out of 3 letters were correctly identified was noted as the contrast sensitivity threshold in log units.
Ocular lens status was evaluated after pupillary dilation with Tropicamide 0.5%. If pupillary dilation was contra-indicated (narrow anterior chamber angle/elevated blood pressure), the evaluation was performed without pupillary dilation. Pictures of the intra-ocular lens were taken with the BON digital DigiPro2 slit lamp. The condition of the lens was classified as either phakic (natural intra-ouclar lens [NIOL]) or pseudophakic (artificial intra-ocular lens [AIOL]).
Cognitive status was assessed using the Mini-Mental State Examination (MMSE) as a measure of global cognitive function (maximum score = 30; Folstein, Folstein, & McHugh, 1975).
ADL were assessed using the KATZ-questionnaire which measures self-reported basic and IADL (Katz & Akpom, 1976). The ADL scale includes eight functions, namely, bathing, dressing, grooming, toileting, mobility (rising from a chair and walking), continence, and feeding (Katz & Akpom, 1976). The IADL scale assesses seven functions, namely, use of telephone, transportation, grocery shopping, household tasks, meal preparation, taking medications as prescribed, and managing money (Katz & Akpom, 1976). A summery score, ranging from 0 (lowest score) to 15 (highest score), is calculated from all functions evaluated. A score of 0 indicates no IADL limitations.
Data Analysis
Descriptive statistics were calculated for participant characteristics. Missing data were imputed by multiple imputation (m = 11) using the statistical program PASW Statistics 20.0.
Univariate and multivariate linear regression models were used to assess the association between ocular straylight and VRQOL. In the first model, the crude estimate and its 95% confidence intervals (CI) were calculated. In the second model, estimates were adjusted for age (in years) and gender. In the third and final model, estimates were additionally adjusted for binocular habitual visual acuity, smoking, number of chronic diseases, number of ocular diseases, cognition, and education. Confounders were selected if they were previously identified in the literature or if plausible biological or clinical reasons warranted an adjustment. Modification of the association between straylight and VRQOL by intra-ocular lens status or IADL status (no limitation, KATZ = 0, or any type of limitation, KATZ > 0) was tested by adding interaction terms of intra-ocular status or IADL status with straylight to the multivariable model.
NEI-composite score and subscale analyses for subcategories of the NEI-VFQ-25 questionnaire were performed to identify areas affected the most by straylight.
Additional analysis was performed with straylight values being categorized into lower than 1.4 log(s) (normal straylight) versus equal to or higher than 1.4 log(s) (high straylight). This cutoff value for straylight was chosen based on a study that identified straylight values of equal to or higher than 1.4 log(s) as impairment for driving a car (van Rijn et al., 2011).
Results
Table 1 shows the participant characteristics of the study population with reliable binocular straylight measurements split by normal and high straylight. The average NEI-composite score of all participants was 86.6 (SD = 10.8). It was slightly, but not significantly, higher (p > .05) in participants with normal straylight as compared with of those with high straylight, respectively, 87.5 (SD = 10.7) and 85.1 (SD = 11.1). The average binocular visual acuity with habitual correction was 0.2 logMAR (SD = 0.2) equivalent to 20/30 Snellen acuity. It was slightly, but significantly, better (p < .05) in those with normal straylight as compared with participants with high straylight, 0.2 logMAR (SD = 0.2) and 0.3 logMAR (SD = 0.2) equivalent to 20/40. The majority of participants had a NIOL in both eyes (58.5%, n = 62). This was 64.1% (n = 41) of participants with normal straylight versus 50% (n = 21) of those with high straylight (p < .05). Approximately, 30.0% had an AIOL binocularly (31.1%, n = 33 vs. 31.3%, n = 20 vs. 30.0%, n = 13, p > .05). A total of 55.8% (n = 67) reported no physician-diagnosed ocular diseases. Of those with normal straylight, 71.9% (n = 46) reported no physician-diagnosed ocular diseases, compared with 31.0% (n = 13) of participants with high straylight (p < .05). A total of 64.2% (n = 68) of participants were active drivers. There were more drivers with normal straylight (70.3%, n = 45) than with high straylight (54.8%, n = 23; p < .05). Figure 2 shows the binocular straylight as a function of age. Figure 3 shows the binocular straylight as a function of age based on intra-ocular lens status. In Figure 4, the monocular straylight values of the right eye are plotted against the monocular straylight values of the left eye based on intra-ocular lens status.
Participant Characteristics.

Note. ISCED = International Standard Classification of Education; MMSE = Mini-Mental State Examination; NEI = National Eye Institute; NIOL = natural intra-ocular lens; AIOL = artificial intra-ocular lens; logMAR = Logarithm of the Minimum Angle of Resolution.

Binocular straylight as a function of age.
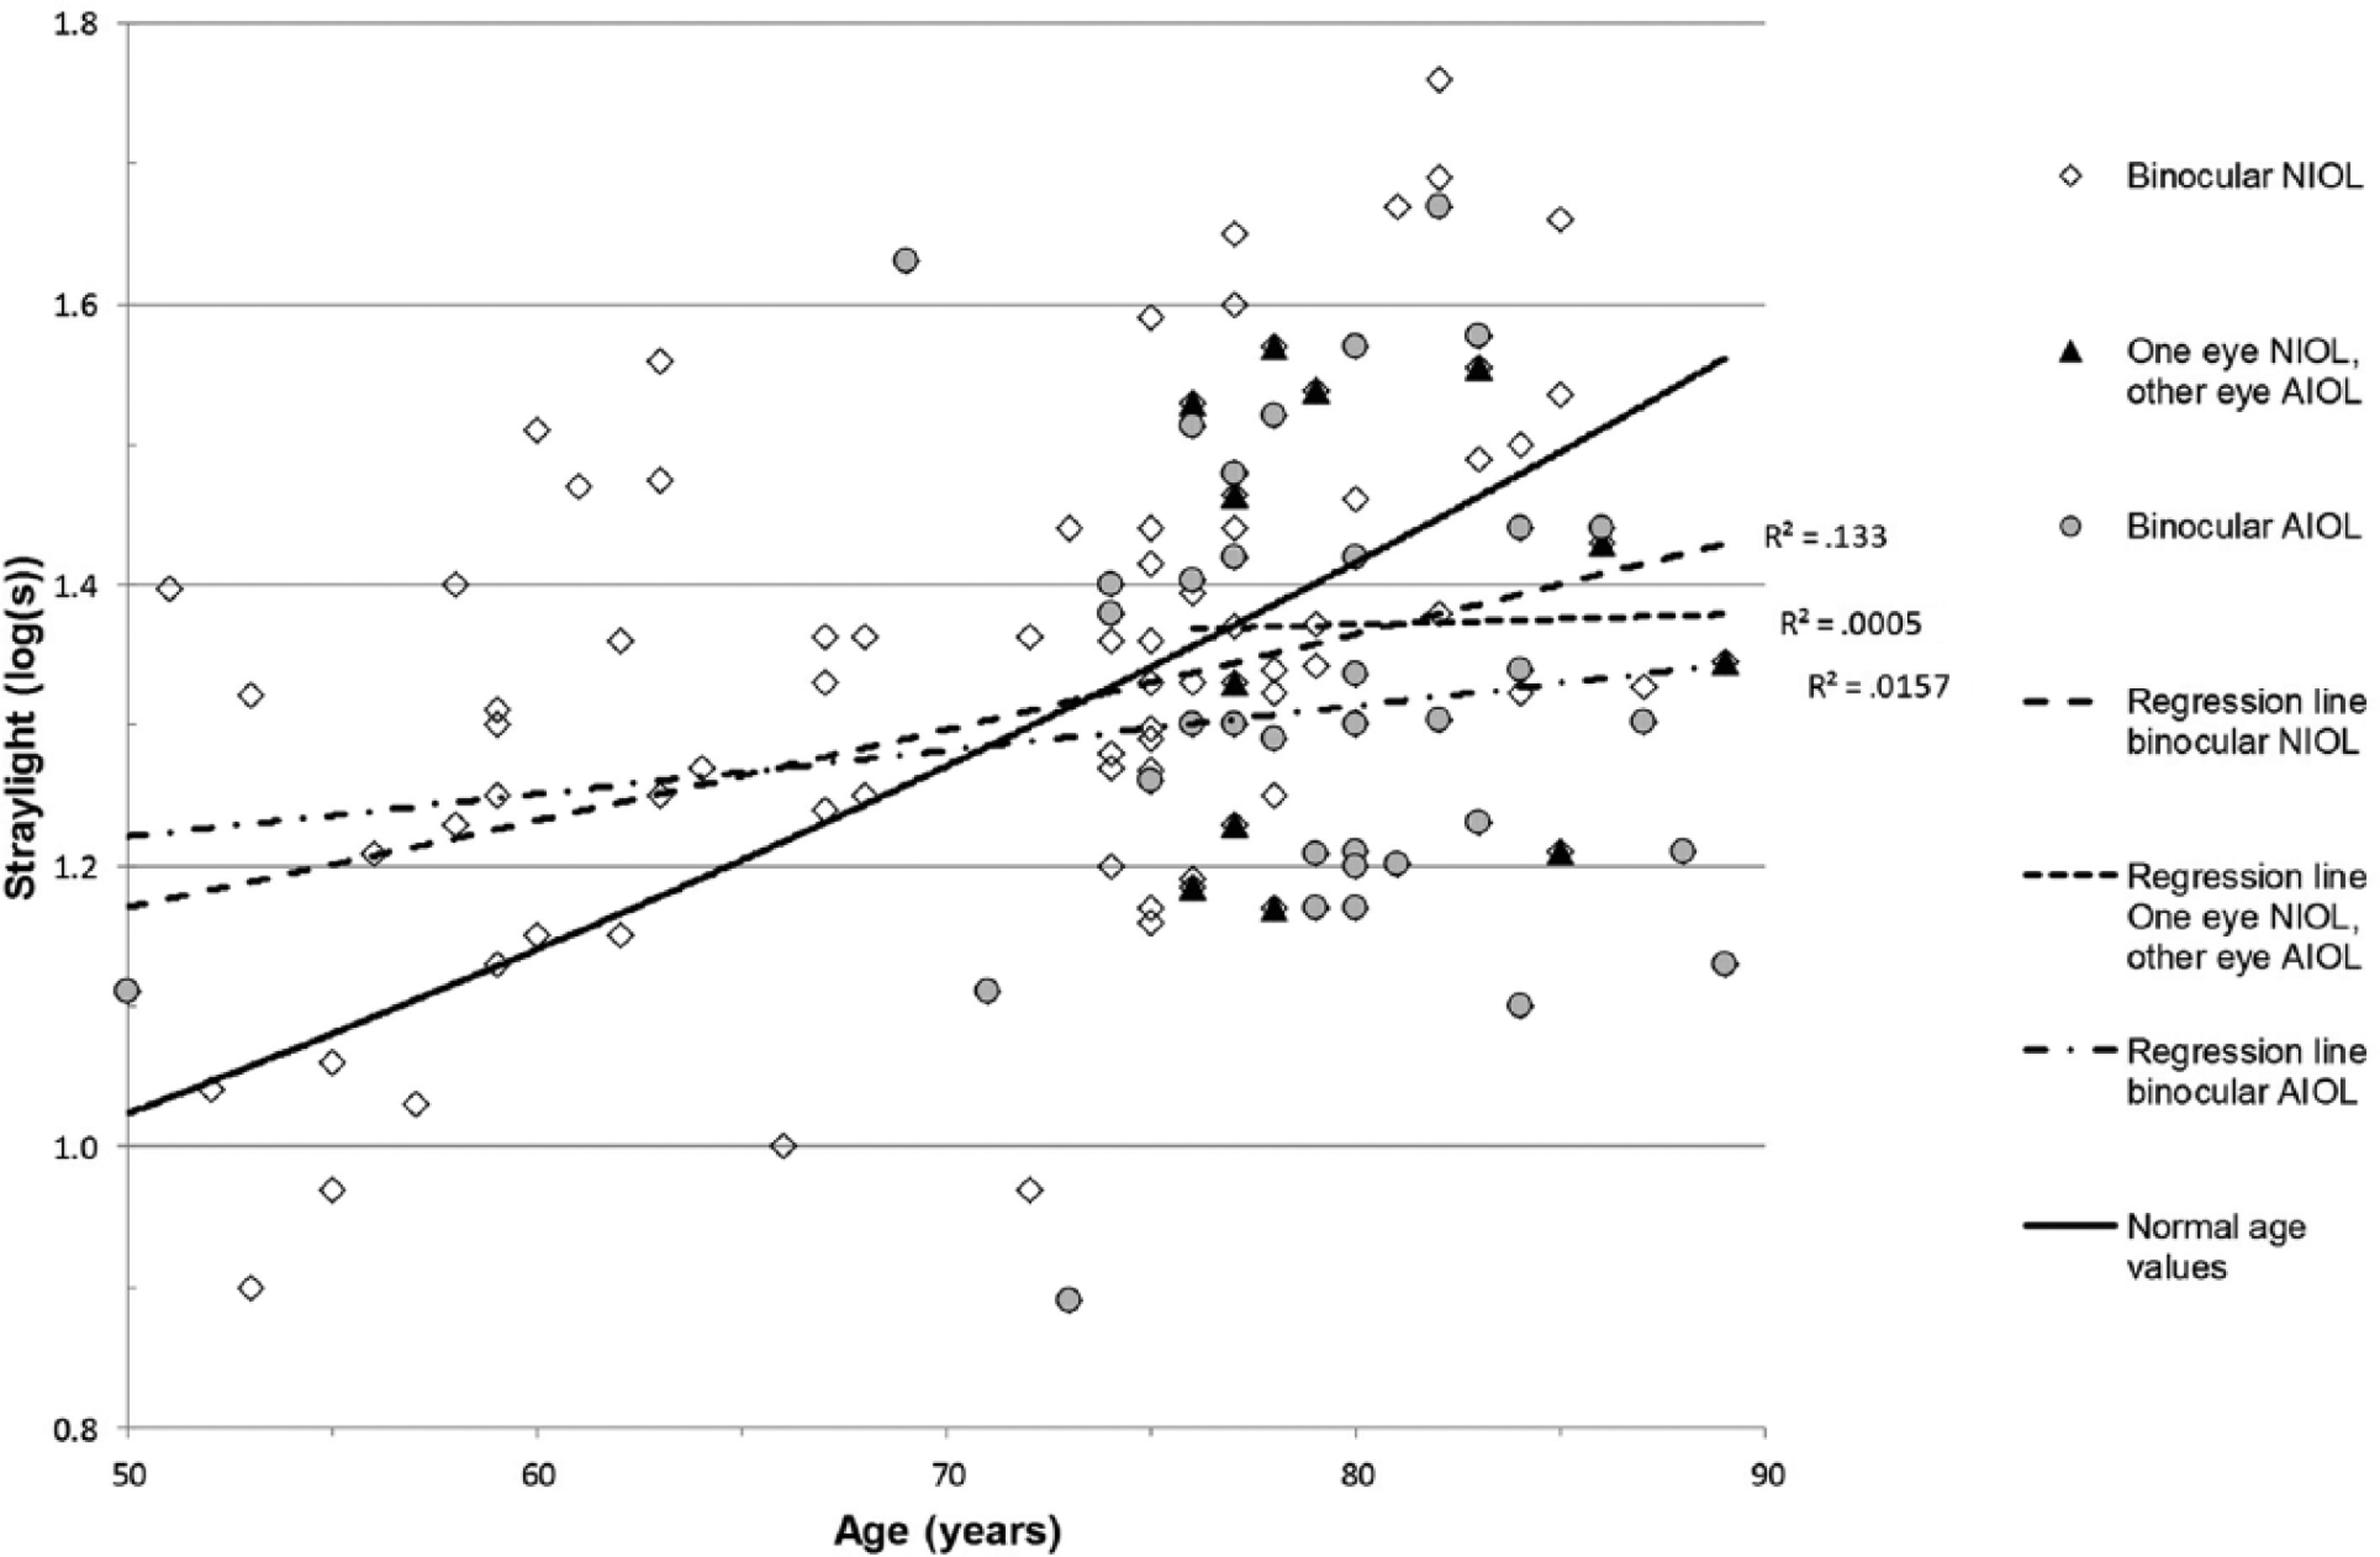
Binocular straylight as a function of age by status of intra-ocular lens.

Monocular straylight right eye plotted against monocular straylight left eye.
Table 2 shows the association between binocular straylight and VRQOL. In univariate analysis, each unit increase in straylight value was associated with 1.1 (95% CI = [−13.0, 11.0]) point decrease in NEI-composite score. When adjusted for age, gender, and confounders (Model 3), each unit increase in straylight resulted in a 9.6 (95% CI = [−0.4, 19.7]) point increase in NEI-composite score, which was borderline statistically significant (p = .60).
Linear Regression Coefficients for the Association Between Ocular Straylight and Vision-Related Quality of Life (NEI-Composite Score).

Note. NEI = National Eye Institute; CI = confidence interval.
Crude model.
Adjusted for age and gender.
Adjusted for age, gender, smoking, binocular habitual visual acuity, number of systemic diseases, number of ocular diseases, cognition, and education.
n = 77.
Subscale analysis on general health showed a small, non-significant negative estimate in the fully adjusted model (BGH = 0.4, 95% CI = [−14.5, 15.3]). All other subscales had larger positive estimates compared with the crude model but were statistically non-significant. When comparing participants with high versus normal binocular straylight, the associations did not materially change (results available on request). Neither intra-ocular lens status nor IADL status modified the association between straylight and VRQOL: p values for interaction of NEI-composite score and subscales >.05 for lens status as well as IADL status, respectively.
Discussion
In this study, we explored the association between intra-ocular straylight and VRQOL based on the hypothesis that increased intra-ocular straylight would result in decreased VRQOL. No association between intra-ocular straylight and VRQOL was found, neither overall nor for particular subdomains of VRQOL. A borderline association was found when the straylight was treated as a continuous variable, and no association was found when the straylight was categorized in normal versus high straylight based on the cutoff value of “fit to drive.” The association between straylight and VRQOL was not affected by the status of the intra-ocular lens or by the performance on IADL, though participants who had undergone cataract surgery in one eye had a lower overall rating for VRQOL. Our results are in line with other studies that found a weak association between straylight and the NEI-composite score (Michael et al., 2009; Van der Meulen, Gjertsen et al., 2012). A study on straylight and VRQOL in European drivers found a small negative association between straylight and VRQOL (Michael et al., 2009). However, the authors felt that self-reported difficulties were better captured by visual acuity and contrast sensitivity rather than straylight (Michael et al., 2009). In our study population, straylight levels increased adequately with age (Bal et al., 2011; Cervino, Montes-Mico, & Hosking, 2008; Rozema et al., 2010; van den Berg et al., 2007; Van der Meulen, Gjertsen et al., 2012). No significant difference between straylight values of participants with NIOL and AIOL was found. This is in contrast to other studies that showed a significant difference in patients with NIOL and AIOL with cataract (Bal et al., 2011; Nischler et al., 2010; van den Berg et al., 2007). Several factors may account for this difference. First, the selection criteria for study participation were different. Active car driving was the inclusion criteria of most studies (Bal et al., 2011; Nischler et al., 2010; van den Berg et al., 2007) or individuals who sought ophthalmological care (Bal et al., 2011; Cervino, Hosking, Montes-Mico, & Alio, 2008; Van der Meulen, Gjertsen et al., 2012); whereas in our population, only 64.2% (n = 68) were drivers, and participant selection was independent of the use of ophthalmological care. A second explanation could be the presence of posterior capsule opacities in participants with AIOLs causing an increase in straylight (van Bree, van den Berg, & Zijlmans, 2013). This may be a reason why straylight in the group with AIOLs was similar to those with NIOLs. Third, we purposely did not exclude participants with other ocular pathology. This may have led to a further dilution of the effect. In any case, we were interested in the effect of straylight on VRQOL in the elderly rather than the VRQOL in individuals with specific ocular diseases or different intra-ocular lens status.
A number of choices of the present study are important for the interpretation of our results. Strength of the present study is the selection of the study population. In this population-based study, we recruited participants from the general population, and inclusion was independent of the presence of any particular ocular disease. In addition, we explored overall VRQOL as well as different domains of VRQOL to get insight into specific areas of functioning. Furthermore, we imputed missing straylight values by multiple imputation which has proven to provide better estimates than complete case analyses (Edwards, Cole, Troester, & Richardson, 2013; van der Heijden, Donders, Stijnen, & Moons, 2006; Zelnick et al., 2014).
A potential limitation was that we obtained one straylight measurement per eye. Most studies used the average of at least two measurements to increase test reliability (Cervino, Hosking, et al., 2008; van Bree et al, 2013; van der Meulen, Gjertsen, et al. 2012); however, others considered one reliable measurement sufficient in the absence of additional measurements (van Bree et al., 2013). Moreover, studies on the reliability of repeated straylight measurements failed to show a benefit in all age groups (Cervino, Montes-Mico, & Hosking, 2008; Franssen et al., 2006). Second, we may have missed individuals with decreased VRQOL or potentially higher straylight levels. However, when comparing our data with other studies, the correlations between best corrected visual acuity and VRQOL (ϱ = −0.47, p = .00), contrast sensitivity and VRQOL (ϱ = 0.31, p = .00), and best corrected visual acuity and contrast sensitivity (ϱ = 0.51, p = .00) were in line with other studies (Bal et al., 2011; Datta et al., 2008) confirming the internal validity of our data. Third, the NEI-VFQ questionnaire was developed to measure the impact of ocular disease on VRQOL (Mangione et al., 2001). It has proven valuable in the elderly population (Nischler et al., 2010; Owen et al., 2006) and in assessing the impact of ocular diseases (Chatziralli, Sergentanis, Peponis, Papazisis, & Moschos, 2013; Mitchell et al., 2013; Wolfram, Lorenz, Breitscheidel, Verboven, & Pfeiffer, 2013). However, it may be less sensitive to straylight-related VRQOL. A review on the usefulness of the NEI-VFQ-25 questionnaire published in 2013 indicated that the questionnaire insufficiently addresses glare and the loss of contrast (Nassiri, Mehravaran, Nouri-Mahdavi, & Coleman, 2013) especially as glare was identified as one of five main factors affecting VRQOL (Richman et al, 2010). This may be a reason why we were unable to establish an association between straylight and VRQOL. Despite these shortcomings, the NEI-VFQ questionnaire is still commonly used as a standard for VRQOL assessment (Chatziralli et al., 2013; Van der Meulen, Gjertsen et al., 2012). Recent studies added a five-item questionnaire to the NEI-VFQ questionnaire to specifically address straylight-related complaints (van der Meulen, Gjertsen, et al., 2012; van der Meulen, van Riet, Lapid-Gortzak, Nieuwendaal, & van den Berg, 2012). They concluded that the assessment of subjective visual functioning is improved when both questionnaires are combined. Nevertheless, at the time of study design and with Institutional Review Board approval, this evidence was not available. Furthermore, the number of participants included could be a limitation of our study. However, compared with other studies on straylight, our number of participants is well within the range of the majority of these studies varying between 20 to 239 individuals (Cervino, Hosking, et al., 2008; Cervino, Montes-Mico, & Hosking, 2008; van Bree et al., 2013; van der Meulen et al., 2012).
Based on our findings, two explanations can be given. First, our findings confirm that the current assessment of VRQOL may not capture all facets of visual functioning and should be extended by additional questions related to visual complaints due to straylight. Second, individuals appeared not to perceive straylight as a factor affecting their VRQOL despite deterioration in visual functioning. The latter can result in unsafe participation in traffic. In our study population, 33.8% (n = 23) of active drivers had straylight values above the current recommendations for “safe driving.” Both aspects need further evaluation in research. In conclusion, straylight appears not to be a sensitive indicator for a decrease in VRQOL at this time.
Conclusion
In our study, a borderline statistical significant association between intra-ocular straylight and self-reported VRQOL in middle-aged and elderly individuals was detected. Further research should focus on factors that contribute to the awareness of deterioration in visual function. In addition, tools to assess VRQOL should be re-evaluated on whether they capture all aspects of visual functioning.
Footnotes
Declaration of Conflicting Interests
The authors declared no potential conflicts of interest with respect to the research, authorship, and/or publication of this article.
Funding
The authors disclosed receipt of the following financial support for the research, authorship, and/or publication of this article: The PReservation Of Functioning In the Elderly (PROFIEL) study was funded by ZonMw, the Netherlands organization for health research and development, grant 60-61900-98-146. The funding organization played no role in design and conduct of the study, data collection, management, analysis, and interpretation of the data nor in the preparation, review, or approval of the manuscript. The VF-PROFIEL extension study was self-funded.