
Abstract
Objectives
Home blood pressure monitoring (HBPM) is crucial for managing hypertension, but there is a potential trade-off between measurement accuracy and health/economic outcomes due to asymmetric costs associated with misclassifying an individual as having hypertension or not. We assessed whether adjustments to device readings that increased overall accuracy produced net health and economic benefits.
Methods
We analyzed data from N = 89 Alaska Native individuals who used 2 HBPM devices and a standard aneroid sphygmomanometer. We modeled changes in expected costs associated with individuals being misclassified as hypertensive or not under 3 different models of adjusting HBPM device readings.
Results
The gains in accuracy produced by adjusting HBPM readings decreased the overall rate of hypertension misclassification but increased the rate of false-negative readings. Adjusting readings led to a net increase in expected health and economic costs.
Discussion
Ignoring asymmetric costs of misclassification can escalate overall costs and worsen uncontrolled hypertension. Home blood pressure monitoring algorithms must be cautiously designed, considering both false negatives and positives. Greater transparency in HBPM algorithms is needed for effective coordination among manufacturers, clinicians, and patients.
Introduction
The proliferation of affordable home blood pressure monitoring (HBPM) devices in recent years has created considerable enthusiasm among clinicians and public health researchers for the potential to cost-effectively improve management of chronic cardiovascular conditions, such as hypertension.1,2 Notably, the 2017 American College of Cardiology/American Heart Association (ACA/AHA) guidelines recommend home blood pressure (BP) measurements to manage the diagnosis of hypertension, as well as to titrate BP medication. 3 As HBPM devices become a more common feature of hypertension management, determining ways to maximize the benefits of such devices has important implications for population health.
One seemingly straightforward way to increase the utility of HBPM devices is to increase their accuracy. Unlike the auscultatory method of measuring BP, in which an aneroid sphygmomanometer (AS) is used to listen for the onset and disappearance of Korotkoff sounds associated with turbulent blood flow, 4 digital HBPM devices use a pressure sensor to sense cuff pressure oscillations. This is known as the oscillometric method. 5 Systolic and diastolic BP are then calculated using an algorithm specific to the device and sensor utilized. An obvious goal of the algorithm is accuracy of the monitor reading as compared to the AS. By international standards, accuracy is measured as the mean absolute difference between the HBPM device and a reference standard. 6 The current “gold standard” reference is from an AS. What is less obvious is that this pursuit of accuracy may not result in the best health and economic outcomes.
We illustrate this point with data from a study of the accuracy of HBPM devices in an Alaska Native (AN) population. In that study, a simple adjustment factor (AF) applied to the HBPM readings improved overall accuracy as defined by comparison to readings obtained from an AS 7 (see also Ref. 8 ). a The use of AFs in that study can be thought of as a specific and illustrative example of issues facing HBPM device manufacturers when designing their proprietary algorithms. This gain in accuracy from using AFs decreased the overall rate of BP misclassifications—findings of hypertension (defined by a systolic BP reading ≥130 mm Hg or diastolic BP ≥80 mm Hg) when it does not exist or no hypertension when it does. b However, using AFs resulted in an increased rate of false-negative readings, that is, saying there is no hypertension when the AS indicated there was. In this study, we examined the cost implications of the use of AFs to improve HBPM device accuracy.
Methods
Study and Sample
Our data come from Schaefer et al 7 that study was conducted through Southcentral Foundation (SCF), a tribally owned and operated healthcare system in Southcentral Alaska. One hundred AN adults with self-reported hypertension were recruited for the study. Blood pressure readings were taken using 3 devices in a clinical setting. The study used 2 different HBPM devices; an Omron BP786 arm cuff and an Omron BP654 wrist cuff, as well as the gold standard Baum-Desk Aneroid 0910 AS with auscultation by trained and certified research personnel. c
Their study used the 2017 ACA/AHA guidelines which indicate Stage 1 hypertension for a systolic BP reading ≥130 mm Hg or diastolic BP ≥80 mm Hg. The procedure for BP measurement was to take 3 readings, with the first reading discarded and the average of the next 2 readings recorded as the measurement. Measurements across devices were compared within each visit to define misclassification. In their study, Schaefer et al 7 found high intraclass correlation (ICC) for each measurement device. For the wrist cuff, the ICC was 0.91 for both systolic and diastolic BP. The corresponding numbers for the arm cuff were 0.91 and 0.83, and for the AS, 0.98 and 0.97. These indicate strong consistency in measurements within devices.
Compared to the AS, the wrist cuff and arm cuff showed different levels of accuracy. The mean signed differences (averaging both over and under measurements) for the wrist cuff were 4.8 systolic and 3.6 diastolic. For the arm cuff, the mean signed differences were −1.5 systolic and 2.5 diastolic. Hence, the arm cuff showed greater overall average accuracy. When measured as absolute differences, the mean differences for the wrist cuff were 9.4 systolic and 7.0 diastolic; for the arm cuff they were 6.6 systolic and 5.0 diastolic. Again, the arm cuff showed greater average accuracy overall.
Home BP Monitoring Device Adjustments
An additional purpose of their study was to determine if adjustments to the readings from the HBPM devices could improve accuracy. Parameters of 2 adjustment models used to generate AFs were estimated and tested using a “test and split” approach. A random two/thirds selection of the participants was used as a “training” sample, and adjusted HBPM BP values were compared against observed AS BP values in the remaining 1/third “test” sample. The dependent variable for both models was the AS BP value observed for each individual in the training sample. The first adjustment model (Adjustment 1) used a simple linear regression with HBPM readings as the sole independent variable, and the second adjustment model (Adjustment 2) used a linear regression that also included age, sex, and arm/wrist circumference as independent variables. Once parameters of the model were estimated in the training sample, those parameters were applied to the test sample, for instance leading to a HBPM reading of 140/85 mm Hg being adjusted to 138/83 mm Hg.
By the British Hypertension Society standards (Table 3 9 ), Adjustment 1 on the wrist cuff moved the systolic rating from D to C, while Adjustment 2 moved it from D to B. For diastolic BP, the ratings improved from C to A with Adjustment 1, and C to B with Adjustment 2. The arm cuff was rated as A in all cases for diastolic BP but showed improvement in systolic BP from B to A with Adjustment 1 no change from the Adjustment 2. For both cuffs, both adjustments increased false negatives for hypertension and decreased false positives.
Table 1 shows the numbers and percents of false-positive and false-negative readings (taken from Figure 2 in the Schaefer et al 7 paper) for each adjustment model. A false positive was defined by the HBPM device indicating hypertension when the AS did not, and false negative was defined by the HBPM not indicating hypertension when the AS did. Blood pressure was measured using all 3 devices at 3 separate occasions over 2 weeks. Of the 100 participants who originally entered the study, 94 returned for the second visit and 89 individuals were at all 3, for a total of 283 readings for each device. With no adjustment, 13.4% of the wrist cuff readings were false positives, compared to 6.7% of the arm cuff readings. Both cuffs had a much smaller percentage of false-negative readings; 2.5% for the wrist cuff, 3.5% for the arm cuff. For both cuffs, the adjustment models increased the percent of false negatives by relatively small amounts with somewhat larger decreases in the percent of false positives.
Observed Count and Percent of False Hypertensive and False Not-Hypertensive Readings, by Device and Adjustment Method.
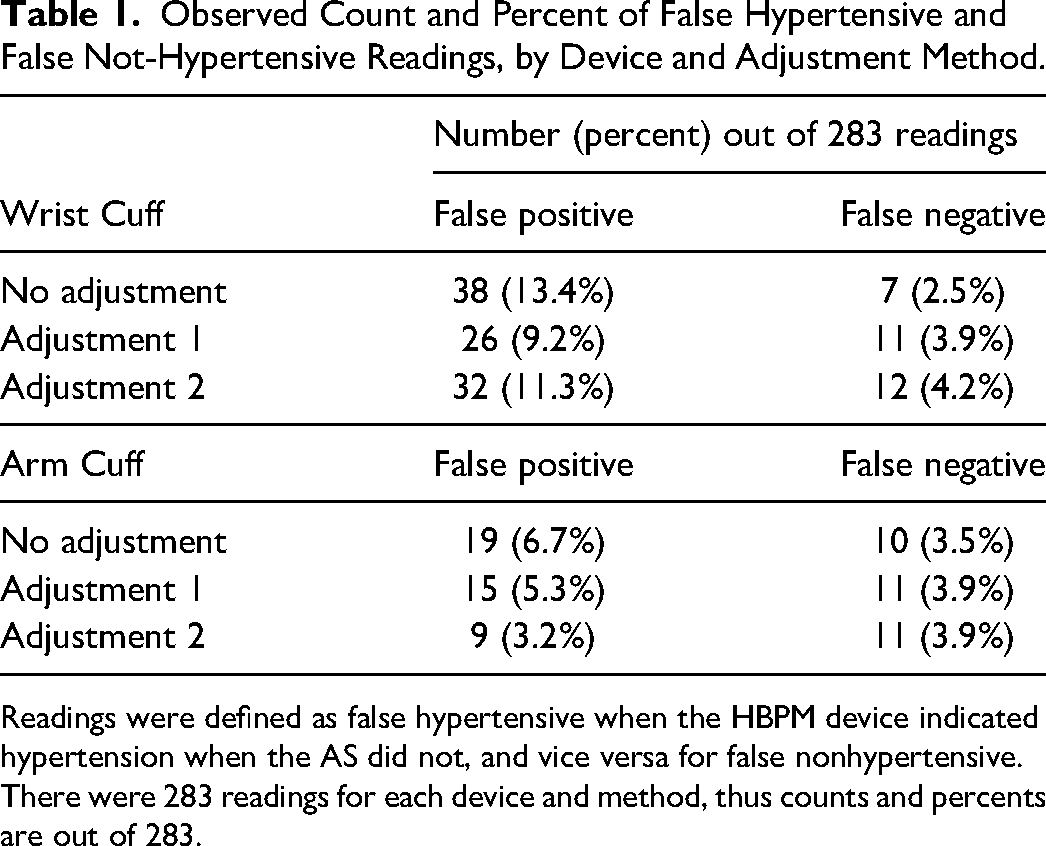
Readings were defined as false hypertensive when the HBPM device indicated hypertension when the AS did not, and vice versa for false nonhypertensive. There were 283 readings for each device and method, thus counts and percents are out of 283.
Analytic Approach
The goal of our analysis is to produce an estimate of expected total costs, at a population level, when using each of the approaches to adjusting HBPM readings. Total costs of misclassification in a patient population of N takes the following form given an AF:
For healthcare costs, we use estimates from the literature (see below in Assumptions). We compare those healthcare costs of an additional clinical visit (in the false of a false positive) against the cost of cardiovascular disease (CVD) events and the value of lives lost, expressed in dollar terms, when treatment for someone with hypertension is delayed because HBPM falsely indicates they are not hypertensive.
We examine the costs of misclassification first by treating the possibility of misclassification as random in each individual, and second by treating individuals as having a tendency toward misclassification. This is because BP readings may be correlated within individuals as well as within devices, and individuals are likely to use their HBPM devices multiple times in-between clinical visits. We identify an individual as having a tendency toward false positives when 2 or more of their 3 average HBPM readings across visits read in a BP range indicating hypertension when the AS reading did not and having a tendency for being misclassified at not hypertensive (a false negative) if 2 or more of their 3 average HBPM readings across visits were in a range indicating no hypertension when the AS reading indicated hypertension.
By this latter metric, for example, an individual whose HBPM measurement is once in agreement with the AS and has 2 readings that show up false (in the same direction) compared to the AS, is classified as false in that direction. Another individual who has one HBPM measurement that indicates the same hypertension classification as the AS, one that is a false negative, and one that is a false positive, will not be shown as having a tendency toward false-positive or false-negative readings. Similarly, an individual with 2 HBPM readings putting them in the same hypertension classification as the AS, and 1 HBPM reading that puts that individual in a different hypertension category than does the AS is not classified as having any tendency toward false-positive or false-negative readings. Table 2 provides the numbers and percents (out of the 89 individuals for whom we have BP measurements at all 3 visits) who are classified as having a tendency toward false positives or false negatives, again by adjustment model. These numbers are uniformly smaller than the absolute numbers and percents based on the number of readings.
Count and Percent of Individuals With a Tendency Toward Each Type of Hypertension Misclassification, by Device and Adjustment Method.

Individuals were defined as tendency for being misclassified as hypertensive (false positive) or not hypertensive (false negative) if at least 2 readings were misclassified compared to AS. N = 89 individuals returned for all 3 visits and thus comprise the study sample in this table.
Assumptions
We make several assumptions about the context and consequences for each type of error to generate plausible health and economic costs. First, we assume patients make regular clinical visits, in which their true hypertension status is measured. In between these regular visits, patients measure their BP using HBPM devices. d If patients are not making regular clinical visits, then the costs of false negatives for hypertension will be larger.
In the case of a false positive for hypertension indicated by a wrist or arm cuff, we assume this reading is followed quickly by an office visit and measurement with an AS, which then provides the correct diagnosis that the patient is nonhypertensive and needs no additional care. e Hence, the cost of a false positive is simply the cost of that single routine follow-up monitoring visit, around $71.f, 10
In the case of a false negative for hypertension, we assume the patient is not seen until the next regularly scheduled clinic visit. At that point, the patient's hypertension would be discovered. Hence, there is an increased risk of CVD due to unmanaged hypertension over the time from the home measurement until their next clinic visit. Moran, et al estimate that there are 860 000 cases of untreated hypertension each year, and that treatment would result in 56 000 (6.5% of the population) fewer CVD events annually and 13 000 (1.5% of the population) fewer deaths annually from CVD. Hence, for every 1000 cases of untreated hypertension over a year, we can expect 65 CVD events and 15 deaths. For the costs of these outcomes, we use Ahern et al, who estimate the cost of CVD g in 2008 dollars is $30 000 and we value a life at $10 million. 11
At issue is if we can apply these rates to uncontrolled hypertension. One meta-analysis, which defined uncontrolled hypertension as BP 140/90 mm Hg or greater found that more than half of people with uncontrolled hypertension were actually untreated. 13 Zhao et al compared those with normal BP (hazard rate 1.00) to individuals with successfully treated hypertension, untreated hypertension, and uncontrolled hypertension. The hazard rate of death from a CVD was 2.23 for those with treated but uncontrolled hypertension. The same hazard rate for those with untreated hypertension was 1.77. They also show that the hazard rate for patients successfully treated (ie, with controlled hypertension) was not different from those without hypertension. For CVD events, Lanti et al 14 found a hazard rate for uncontrolled hypertension patients of 2.04 compared to a hazard rate for untreated hypertension patients of 1.95. Again, the hazard rates of a CVD event for normotensive and controlled hypertension patients did not differ. Hence using the values from untreated hypertension in our analysis is a conservative approach.
Second, we assumed misclassifications are randomly and symmetrically distributed throughout the period when the HBPM is being used. Some individuals experiencing a false negative will have uncontrolled hypertension for longer than one-half the period, others for less than one-half the period, but on average for all those with false negatives, uncontrolled hypertension will be untreated for one-half the period between regular checkups. Using the yearly periodicity in Moran et al, we expect 32.5 extra CVD events and 7.5 extra deaths per 1000 individuals. This, of course, assumes patients classified as hypertensive would have a clinical visit only one a year; shorter periods between regular check-ups would result in fewer CVD events and deaths due to untreated hypertension, reducing the negative consequences of misclassified hypertension. Another limitation of this assumption is that if there is a positive association between length of time since the last clinical BP measurement and having unmanaged hypertension (consistent with BP increasing over time for any reason) then the distribution of false-negative hypertension classifications will be shifted closer to the next clinical BP reading, lowering the aggregate health costs of false negatives.
Results
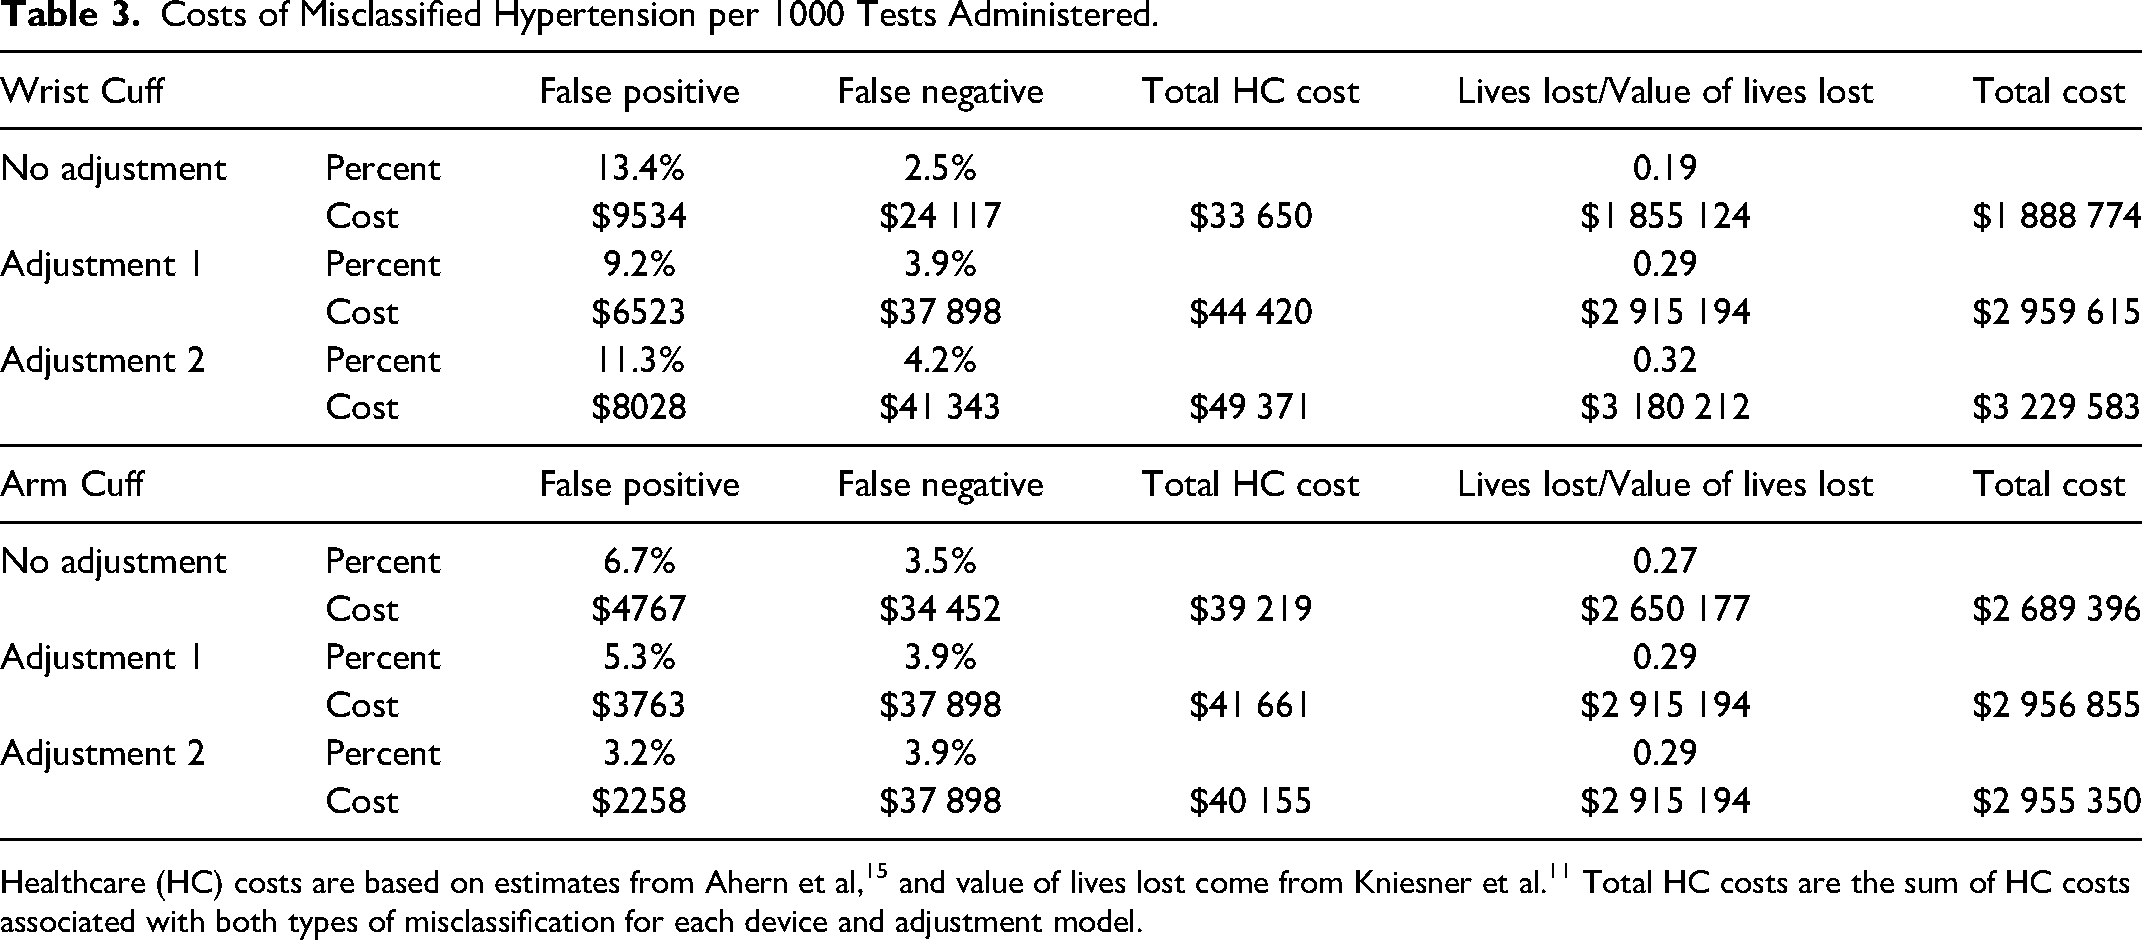
Table 3 shows the cost of misclassified BP readings under each adjustment scheme based on the rate of misclassified readings shown in Table 1. Table 4 shows the cost of misclassified BP using the tendency of individuals toward being falsely classified as not hypertensive (a false negative) or as hypertensive (a false positive) according to the metric given in Table 2. We also illustrate total costs by adjustment method and HBPM device in Figure 1. Both tables use the same costs for a false negative and a false positive, as well as the $10 million figure for the value of a life.

Total expected healthcare costs by adjustment method and cuff type.
Costs of Misclassified Hypertension per 1000 Tests Administered.
Costs of Misclassified Hypertension per 1000 Individuals.

The numbers in the tables are based on the prospect of misclassification and the consequences of follow-up or untreated hypertension. For example, with an unadjusted wrist cuff, in Table 3 we expect 13.43% false positives. For every 1000 tests, that would result in 134.3 visits to a practitioner at a cost of $71 per visit, for a cost of $9534. We would also see 24.7 false negatives, so 24.7 individuals have untreated hypertension for half a year, resulting in 0.803 CVD events (24.7 × 0.0325) at a cost of $24 083. Total healthcare cost sums these 2 amounts. In addition, we expect almost 0.2 deaths (actually, 0.1855) from the untreated hypertension, which is valued at $1.855 million. h
First consider the implications of Table 3. For the wrist cuff, a simple adjustment that improves the average accuracy of the cuff when compared to an AS decreases the false positives and increases the false negatives. In fact, both adjustment models decrease the false-positive rate more than the false-negative rate increases. But, as noted above, false negatives likely have more dire health and economic costs than false positives. Hence, the total cost from misclassified readings increases with both adjustment models for both the wrist and arm cuffs, demonstrating that adjusting the algorithm so cuffs produce better overall accuracy is bad for health and not cost beneficial. The same is true for arm cuffs, although the additional cost from the adjustment is not especially large.
Table 4 reports the results with the alternative definition of misclassification based on individual tendency. We have the same pattern of results, although the magnitudes differ because of differences in the percents of false positives and false negatives. Using either adjustment model to improve overall accuracy decreases false positives, increases false negatives, and increases total cost because of greater healthcare costs and value of lives lost. For the arm cuff, adjustment 1 decreases false positives with no difference in false negatives so there is a small cost saving from lower healthcare costs identifying the false positives—the healthcare costs and value of lives lost due to false negatives does not change. However, adjustment 2, while cutting the number of false positives by two-thirds, doubles the rate of false negatives and thus produces a large increase in total cost.
Discussion
In this study, we considered the costs of hypertension misclassification that come from using AFs with HBPM devices. In our analysis, the costs of misclassification came from required follow-up verification in the case of false positives and in deaths resulting from uncontrolled hypertension from false negatives. The follow-up verification is innocuous to health and relatively inexpensive. i Conversely, uncontrolled hypertension leads to more frequent CVD events and concomitant health consequences, including death. The large difference in costs between false positives and negatives produces the result that adjustments to HBPM readings can lead to higher net costs when they increase the rate of false-negative readings, even when they increase the overall accuracy of the HBPM device.
Accuracy, broadly stated, is an important feature for patients choosing a device, practitioners prescribing a device, and for policy makers in both advocating HBPM and approving devices. Major health organizations point to accuracy as an important consideration, including the World Health Organization 16 and the American Medical Association. 17
While we agree accuracy is generally desirable, our study shows how that accuracy is achieved has important consequences. If an algorithm improves accuracy (defined by the difference between the HBPM measurements and those from an AS) by increasing the number of false-negative hypertension readings, the improvement in average accuracy may be detrimental because it leads to an increase in uncontrolled hypertension and CVD events. As illustrated here, using the data from Schaefer et al, 7 overall accuracy could be easily improved by a simple adjustment downward in the algorithm, but it would increase total health and economic costs. Although we perform our analysis with a simple model of binary misclassification and the behavioral responses thereof, the purpose of our analysis was not to produce precise estimates of predicted costs, but rather to highlight an important consideration in the pursuit of accuracy for HBPM devices.
As manufacturers develop devices, and consumers, practitioners, and policymakers evaluate devices, they all face a bedeviling coordination problem in the absence of clear and transparent communication between parties on what the algorithms are doing. That clear and transparent communication is currently lacking: there are no uniform standards for calculating BP with HBPM devices, meaning there may be differences in measurements between individual devices and manufacturers. 18 It is difficult to coordinate an appropriate response to the insights of this paper without also addressing the opacity around device calibration. Turning the insights of this paper into improvements in hypertension management will depend upon effective coordination between device manufacturers, regulators, and institutions that validate HBPM technologies so that practitioners can better understand measurement biases.
In addition to considerations regarding the specific algorithm a device uses to predict BP, our analysis reinforces the value in the regular clinical assessment of BP even in patients who are utilizing HBPM equipment. Reducing the amount of time spent with uncontrolled hypertension is a critical component of bringing down health and economic costs.
Limitations
The key limitation of this study is that we rely upon other studies to provide estimates of the expected costs associated with delayed care for hypertension, as opposed to deriving these estimates within the context of this study sample itself, since those costs were not available. This meant our analysis relied upon plausible but fallible assumptions of patient behaviors and outcomes. A second limitation of our study was the relatively small sample size, as large sample sizes could’ve led to more precise or alternative methods of adjustment. Third, individuals seeking care at SCF might have superior access to healthcare compared to the broader population with hypertension, potentially leading to better management of hypertension. It is unclear whether adjusting HBPM devices using similar methods would produce the same patterns in a population with higher average BP levels. Fourth, HBPM measurements in this study was obtained by trained study staff and may not be reflective of measurements taken at home. Fifth, the study was carried out solely in Anchorage and involved urban and suburban patients at SCF. Although the Anchorage population typically mirrors the broader AN population, it is important to note that these findings might not apply universally to other populations. Finally, our analysis focuses on the performance of HBPM devices at the population level and does not speak to the value of adjustments for specific individuals. However, population-level analyses are essential for making decisions regarding public health, including the selection of interventions and medical devices within healthcare systems, as well as for effectively regulating medical devices.
Conclusion
The algorithms HBPM devices use to predict BP should be made with caution, accounting for the asymmetric health implications and costs of false-negative and false-positive measurements. Our analysis suggests there should be greater transparency around HBPM device algorithms to facilitate effective coordination between manufacturers, clinicians, and patients. Such transparency is perhaps of primary importance; otherwise, clinicians and patients may conflate population-level outcomes with individual experience, making it harder to talk about the importance of BP for overall health. Finally, this research should motivate more investigations into the definition of accuracy used for HBPM devices and other medical equipment. This study demonstrates there is cause for concern using seemingly benign adjustment approaches in a unique population—future research should be conducted using alternative approaches to adjustment and in different populations to determine whether similar patterns emerge.
Footnotes
Acknowledgments
The authors are grateful to the members of the Southcentral Foundation and Alaska Native Tribal Health Consortium research review committees for their continued review of research at the Alaska Native Medical Center campus and to the Community Advisory Board for their guidance on this study. The authors thank the Alaska Native and American Indian participants in the study.
Declaration of Conflicting Interests
The author(s) declared no potential conflicts of interest with respect to the research, authorship, and/or publication of this article.
Funding
The author(s) disclosed receipt of the following financial support for the research, authorship, and/or publication of this article: This work was supported by the National Institute on Minority Health and Health Disparities, (grant number U54MD011240).
Data Availability Statement
Data sharing not applicable to this article as no datasets were generated or analyzed during the current study.