
Abstract
The study aimed at applying Multivariate Generalized Linear Mixed Models to examine factors associated with correlation outcomes, in particular, anthropometric measurements among under-five children in Tanzania. Three anthropometric measurements: weight-for–age (WAZ), height-for–age (HAZ), and weight-for–height (WHZ) among under-five children in Tanzania were jointly modeled to identify common factors associated with childhood malnutrition. A total of 9052 children with valid measures of height and weight were processed and analyzed. The results indicate that WAZ was correlated with HAZ (P-value < 2e-16) and WHZ (P-value < 2e-16). The Multivariate Ordered Logit Model has lower AIC = 53213.92 and BIC = 52727.95, indicating better model fit than the Multivariate Ordered Probit Model. In Tanzania, the age of the child, birth order, mother education level, child gender, mother working status, wealth index, marital status, and mother body mass index are important determinants of malnutrition among children under the age of five. Moreover, the common factors were child's age, Birth order, Mother's education attainment, child's sex, Mother working status, wealth index, Marital status, and Mother's Body Mass Index. As a result, emphasis should be placed on analyzing correlated health outcomes in order to draw conclusions about the factors that may have a mutual effect on anthropometric measurements.
Keywords
Introduction
Malnutrition is a leading cause of morbidity and mortality among children under the age of five worldwide. In Africa, the prevalence of wasting is 6.4%, which is lower than the global average of 6.9% and there has been a slow progress to meeting global nutrition goals, and children under the age of five are at the highest risk of all types of malnutrition, with 40% stunting and 27% wasting. 1
According to TDHS reports, the pattern indicates that stunting has dropped from 38% in 2004/2005 to 35% in 2010 (3 percentage points). 2 Wasting increased a bit from 3% in 2004–2005 to 4% in 2010 among children under the age of five, while underweight shrunk from 22% in 2004–2005 to 21% in 2010. 2 Using a comparative assessment of MoHCDGEC et al 3 indicates that in 2015/2016, the rates of underweight, stunting, and wasting were 14%, 34%, and 5%, respectively.
One of the natural features in analyzing nutrition status is the correlation between the measurements. The child is underweight because of wasting or stunting, or both. However, Mdimu et al, 4 Mrema, 5 and Ismail et al 6 continued to model and analyze factors associated with child nutrition status in Tanzania using the Logistic Regression model. The model ignores the correlation effects which may lead to inaccuracy of the result.
With the correlated outcomes, efforts have been made to advance our understanding of the risk factors associated with multiple, repeated, and correlated anthropometric measurements in Malawi and Ethiopia.7,8 It is noteworthy that both have employed a set of log-linear models to explore correlation among anthropometric measurements while covariates were considered independently. The correlation among anthropometric measurements remains unstudied in Tanzania, though it is useful for assessing joint effects. Therefore, this study is utilizing a mixed-effects model to identify common factors and find out the possible correlation effect of anthropometric measurements among under-five children in Tanzania.
Materials and Methods
The national-wide cross-sectional data from the Tanzania Demographic and Health Survey (TDHS-MIS) 2015–16 was used for analysis. A total of 9052 out of 10,233 children with valid weight and height were chosen from the dataset from women's individual recode files (TZKR7BFL).
Three anthropometric measurements were used as outcome variables. These include weight-for-age (WAZ), height-for-age (HAZ), and weight-for-height (WHZ). Based on WHO child Growth Standards), a child is considered to be severely malnourished if WAZ, HAZ, WHZ ≤ -3, moderately malnourished if −3 < WAZ, HAZ, WHZ ≤ -2 and malnourished if −1 < WAZ, HAZ, WHZ < 0. Undernutrition Ordinal scale (1 = Malnourished, 2 = Moderately Malnourished & 3 = severely malnourished).
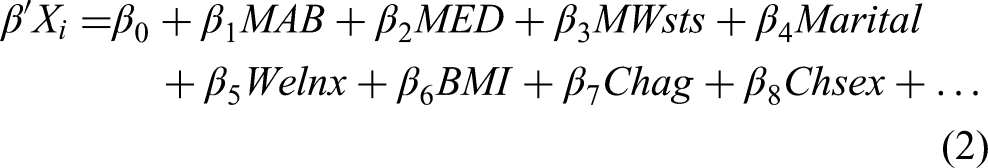
The Independent Variables in this study, the variables include the following characteristics: Child's age in month (Chag: 1 = less than 24 months, 2 = 24-48 months and 3 = 49-59 months), Child's sex (Chex: 1 = male, 2 = female), Birth order (1 = first, 2 = 2-3 order, 3 = 4-6 order, 4 = 6 or later), Mother's educational attainment (MED: 1= No education, 2 = primary, 3 = secondary+), Mother's current work status (MWsts: 1 = No and 2 = Yes), Current marital status of mother (Marital: 1 = Never married/separated/divorced/widowed and 2 = Married/living with a partner), Wealth indices (Welnx: 1 = Poor, 2 = Medium and 3 = Rich), and Body mass index of the mother (BMI: 1 = BMI < 18.5 (underweight), 2 = BMI 18.5–24.9 (Normal), 3 = BMI ≥25 (Overweight/obese)).
This conceptual framework (Figure 1) below depicts the relevant variables and possible relation with the outcome's variables. Undernutrition in children under the age of 5 years has been caused by children's demographic, health and caring practices factors, and Mother/caregiver socio-economic and demographic factors. Children are underweight because of either stunting or wasting; therefore, this study focused on the analysis of correlated outcomes, ie WAZ/HAZ; WAZ/WHZ; and HAZ/WHZ.

Conceptual framework of all forms of malnutrition for under-five children.
STATA version 16 and Mvord package in R were used for data processing and analysis. Descriptive statistics of categorical variables were summarized using frequencies and the percentage, while the mean and standard deviation were used to summarize continuous variables. A multivariate generalized linear mixed model was employed to investigate the possible relationship among anthropometric measurements in children under the age of five, as well as to identify key determinants associated with anthropometric measurements.
With the correlated ordinal responses, the Multivariate Ordered logit Models were considered as follows:


Threshold Parameters
The threshold parameters are divided into two groups: one with the equivalent response's name and a vertical bar separates two adjacent categories. The calculated coefficients are labeled with the covariate name and a number for each covariate. This number corresponds to the covariate and is derived the sequence and the number of columns in the constraints list element.
Results
The analysis includes a total of 9052 children under 5 years. Figure 2 shows that, for underweight (WAZ), 2.7% of children were severely malnourished, 11.1% were moderately malnourished, and 86.2% were classified as malnourished. In terms of stunting (HAZ), 11.2% of children were severely malnourished, 22.5% were moderately malnourished, and 66.3% were classified as malnourished. Regarding wasting (WHZ), 1.3% of children were severely malnourished, 3.6% were moderately malnourished, and 95.1% were classified as malnourished. Still there is high prevalence of malnourished children.

Prevalence of the anthropometric measurements among children below 5 years age.
Table 1 shows the observed number and percentage of explanatory variables used in the analysis. The study considered almost the equal number of female and male children. About 22.5% of all observed children was infant, 21.3% of children was aged between 12 and 22 months, whereas 56.2% of children aged from 23 to 59 months. From the same table, it is observed that most mothers had primary or higher level of education (78%). We also note that 44.1% of households were poor. It was observed that 60% of mothers gave birth at age 7–19 years, 61% of mothers has normal weights, more than half (77.95%) of mothers/caregivers were current working and the majorities (85%) of mother/caregivers were married.
Distribution of Frequencies of Explanatory Variables Used in the Analysis.

The result in Table 2 presents the estimated correlation parameters as well as their standard errors. The findings show a statistically significant relationship between WAZ and HAZ z-score (P = 2e-16), WAZ z-score and WHZ z-score (P=< 2e-16), However, there is no relationship between WAZ Z-score and HAZ Z-score (P = 0.0521); correlation for WAZ/HAZ and WAZ/WHZ at the 1% level are statistically significant.
Correlation Parameters.

aindicates 1% significance level.
WAZ: weight-for-age; HAZ: height-for-age; WHZ: weight-for-height.
In Table 3, it was observed that there was slight difference between Multivariate Ordered Logit Model and Multivariate Ordered Probit Model. Multivariate Ordered Logit Model has lower AIC and BIC; this implies that Multivariate Ordered Logit Model is better model fit than Multivariate Ordered Probit Model.
Goodness of Fit for the Multivariate Probit and Multivariate Logit Model.

Source: Author's Computations.
In Table 4, it is noted that the variable found to be at least significant at one of the three anthropometric indicators is therefore considered as a key determinant of malnutrition. From Table 2, a strong positive relationship is found between underweight and stunting and then the pair, underweight, and wasting. This finding within the domain of the current scientific setting is uniform with the findings of other researchers as well. 10
Estimates of Parameters for a Joint Model for Anthropometric Measurements.

aReference category; Source: Author's Computation.
Therefore, identified common determinant for WAZ/HAZ are mothers’ current working status, sex of the child, age of the child, childbirth order, and mother's education. Also, the key determinants for the correlation among WHZ/ WAZ are wealth status, child birth order, and child age. Note that, childbirth order appeared common to all form of malnutrition
Discussion
The main objective of this research was to identify the key factors at the same time of WHZ, WAZ, and HAZ and determine the possible correlation effect of anthropometric measurements among under-five children's nutrition status in Tanzania. Multivariate GLMM was employed for analysis. Myatt et al 11 and Aheto 12 employed descriptive epidemiology of anthropometric measurements and multilevel models, respectively, to explore the correlation among anthropometric measurements. It was found that WAZ/HAZ and WAZ/WHZ were correlated, and there is no correlation between HAZ/WHZ. A study conducted in Rwanda backs up these findings. 13
The Multivariate Ordered Logit Model was used instead of the Multivariate Ordered Probit Model in modeling joint outcome variables to test the association across measurements and associated risk factors. The Multivariate Ordered Logit Model has a smaller BIC and AIC than Multivariate Ordered Probit Model. This finding was supported by Hirk et al. 9 The results showed that the standard error associated with factors estimated from Multivariate Ordered Logit Model was less than those factors resulting from analyzing HAZ, WAZ, and WHZ separately. In addition to that, estimates derived from joint modeling techniques of two or more outcomes are predicted to be more accurate and reliable, as evidenced by lower standard errors when compared to estimates derived from separate models. 14
Conclusion and Recommendations
The current study made use of a multivariate generalized linear mixed model to identify simultaneously the key determinants of malnutrition of the child under age five in Tanzania using underweight, wasting, and stunting. However, the MGLMM was used to recognize common factors associated with anthropometric measurements of children under-five years in Tanzania. Age of the child, order of birth, Mother's educational attainment, child's sex, mother working status, wealth index, marital status, and mother body mass index are common factors associated with the measurements. This is due to the fact that HAZ, WAZ, and WHZ are all correlated in nature.
We recommend the following to mitigate the occurrence of undernutrition in children under the age of five (0-59 months) in Tanzania. Firstly, the intervention to control undernutrition among children under-five years should be focused on modeling the combination of nutritional outcomes enables us to draw conclusions concerning unmeasured factors that may have a mutual impact on the correlated variables Anthropometric measurements. However, the policymakers, government, and other stakeholders should consider risk factors associated with correlated anthropometric measurements across WAZ&HAZ and WAZ&WHZ to better formulate strategies and policies to minimize the risk of childhood nutrition.
Footnotes
Acknowledgements
The authors acknowledge the DHS program portal for providing data for analysis process.
Author Contributions
EEP conceived the idea, carried out data analysis, and drafted the manuscript. ASM participated in data analysis and reviewed the manuscript. All the authors reviewed the first draft of the manuscript and approved the final draft of the manuscript.
Availability of Data and Material
Declaration of Conflicting Interests
The authors declared no potential conflicts of interest with respect to the research, authorship, and/or publication of this article.
Funding
The authors received no financial support for the research, authorship, and/or publication of this article.
Ethics Approval and Consent to Participate
The permission to do this was given by Demographic and health surveys (DHS) program. Since we only used secondary, anonymized data, personal consent was not required.
Data Availability Statement
Data are freely available from the Demographic and Health Survey (DHS) portal (www.dhsprogram.com) and are allowed upon request.